
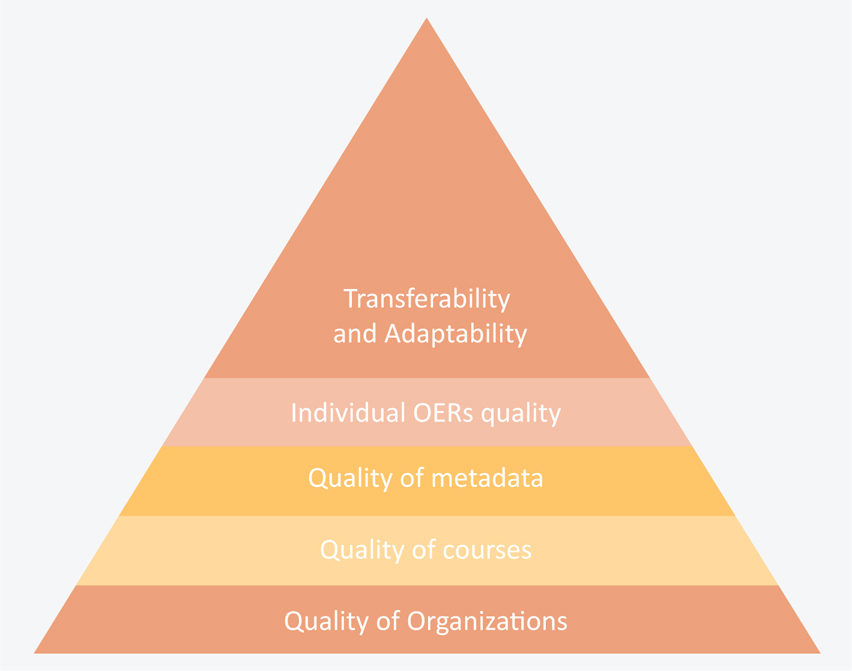
Figure 1
Levels of quality in Open Education – Adapted from Camilleri, Ehlers, & Pawlowski (2014).
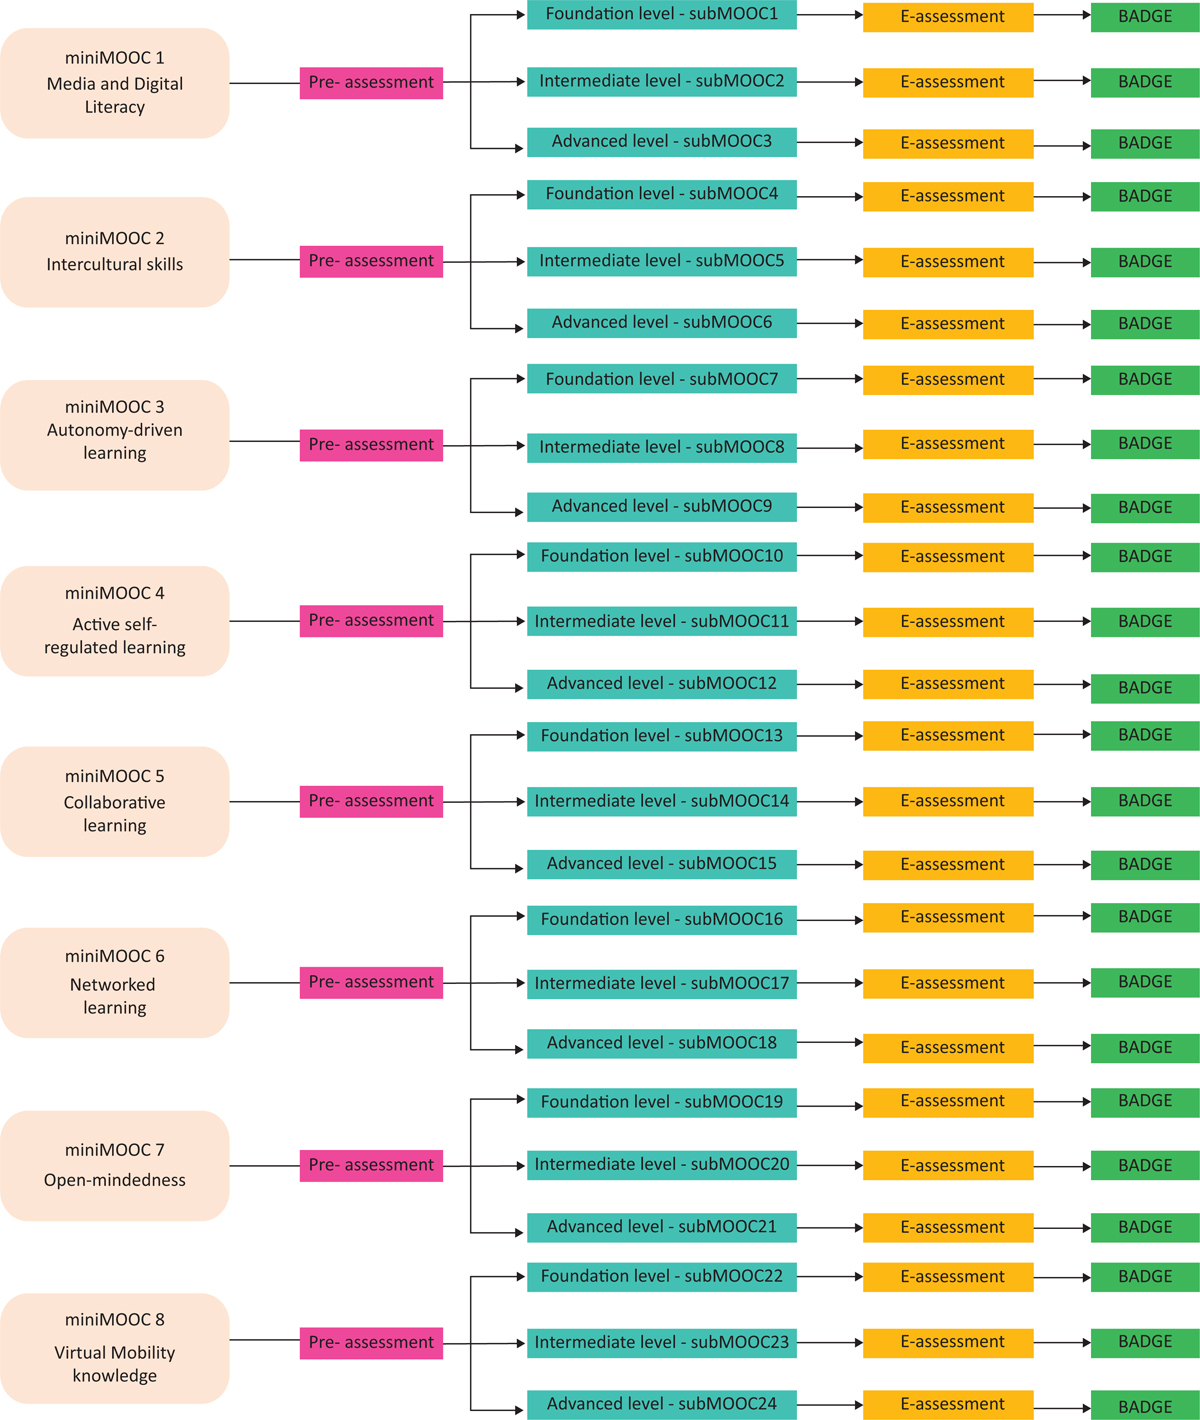
Figure 2
The OpenVM MOOC structure.
Table 1
OER rubrics adapted from ACHIEVE, 2011
| Quality | Appropriateness | Technical aspects |
|---|---|---|
|
|
|
[i] Overall evaluation: (0 = not usable; 1 = limited; 2 = good; 3= superior).
Table 2
A description of the OERs selected and assessed
| Skills to promote in the VM MOOC | Level | Number of OERs for each level | Date of the creation of the resources (in average) | Quality overall peer assessment |
|---|---|---|---|---|
| Autonomy driven learning | Foundation | 4 | 2007 (from 2001 to 2018) | 80% good; 20% superior. |
| Intermediate | 4 | |||
| Advanced | 3 | |||
| Mainly for teachers | 6 | |||
| Self-regulated learning | Foundation | 3 | 2014 (from 2010 to 2017) | 80% good; 20% superior. |
| Intermediate | 3 | |||
| Advanced | 3 | |||
| Collaborative learning | Foundation | 3 | 2013 (from 2010 to 2017) | 20% not usable; 20% limited; 20% good; 20% superior; |
| Intermediate | 3 | |||
| Advanced | 3 | |||
| Networked learning | Foundation | 3 | 2013 (from 2008 to 2017) | 40% limited; 40% good; 20 % superior; |
| Intermediate | 3 | |||
| Advanced | 3 | |||
| Open-mindedness | Foundation | 2 | 2011 (from 2004 to 2018) | 20% limited; 30% good; 50% superior |
| Intermediate | 3 | |||
| Advanced | 5 | |||
| Intercultural skills | Foundation | 5 | 2014 (from 2008 to 2018) | 20% limited; 30% good; 50% superior |
| Intermediate | 5 | |||
| Advanced | 5 |
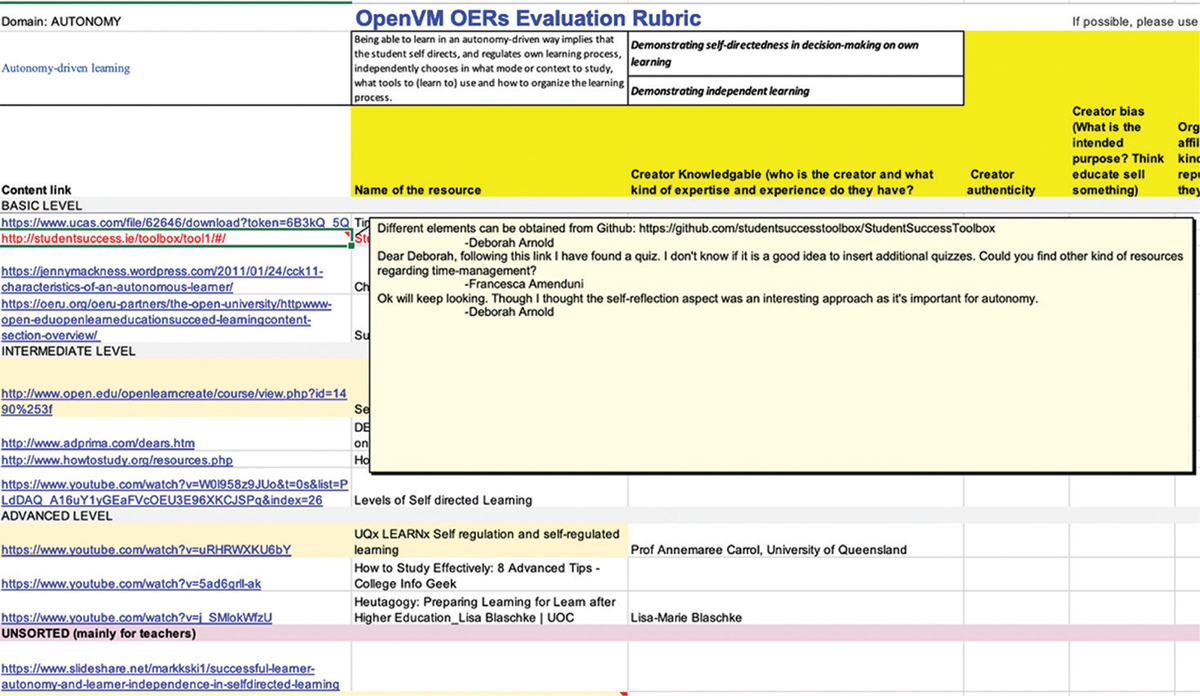
Figure 3
Screenshot – Google Spreadsheet used to discuss OERs assessment.