
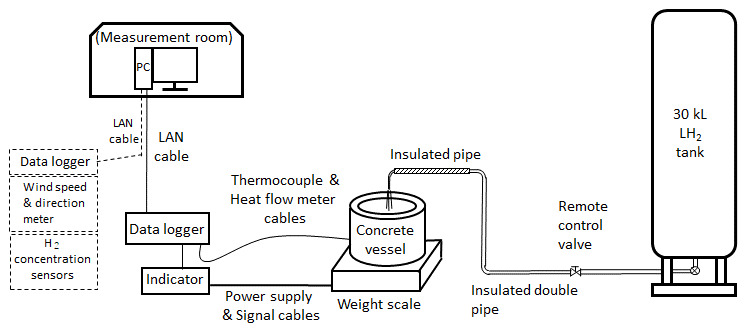
Figure 1
Experimental set-up.
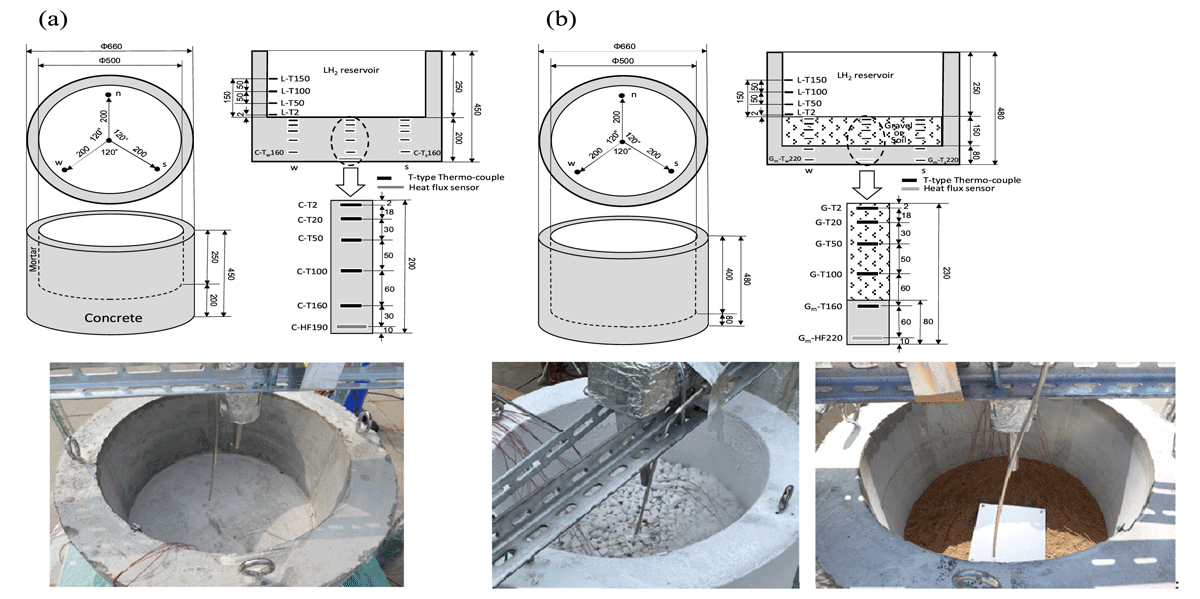
Figure 2
Schematic illustrations and photos of vessels. (a) Concrete vessel. (b) Mortar vessel for the experiments using gravel or soil.
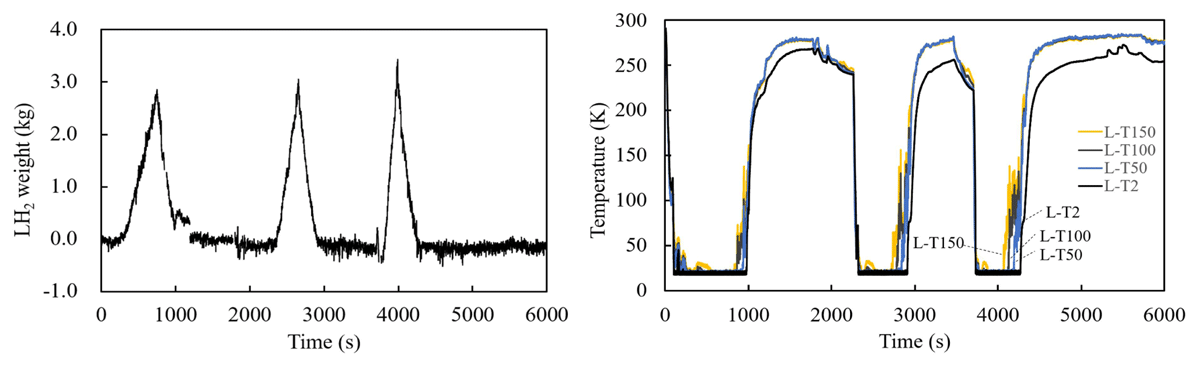
Figure 3
Experimental results using concrete vessel. (a) Temporal variations of LH2 weight. (b) Temporal variations of temperature in the LH2 reservoir.
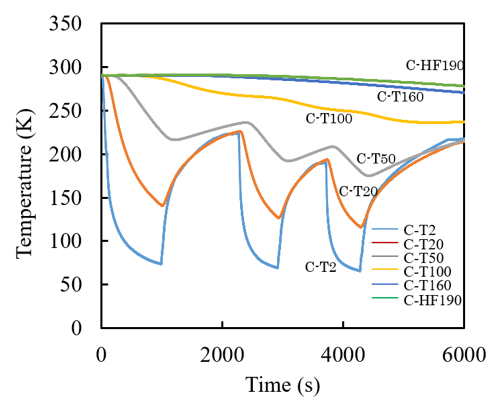
Figure 4
Temporal variation of the temperature at each depth at the center of the concrete vessel.
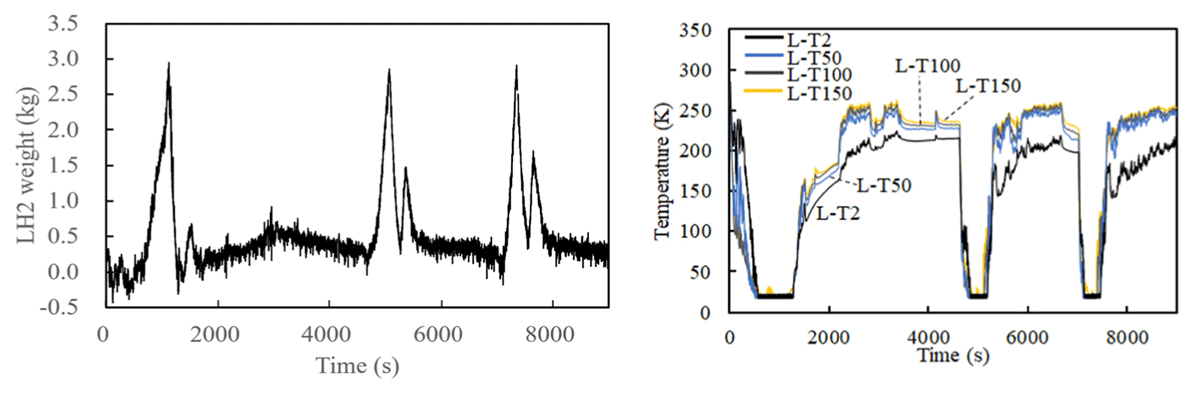
Figure 5
Experimental results using the mortar vessel with a gravel layer. (a) Temporal variations of LH2 weight. (b) Temporal variations of temperature in the LH2 reservoir.
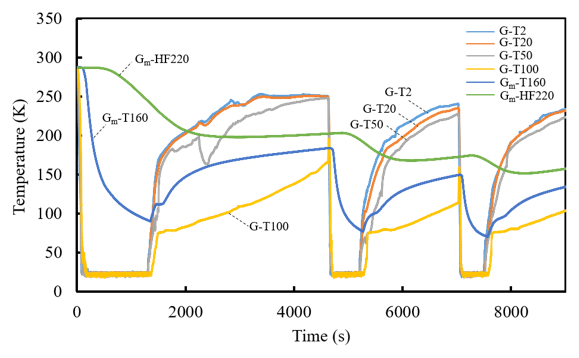
Figure 6
Temporal variation of the temperature at each depth at the center of the mortar vessel with a gravel layer.
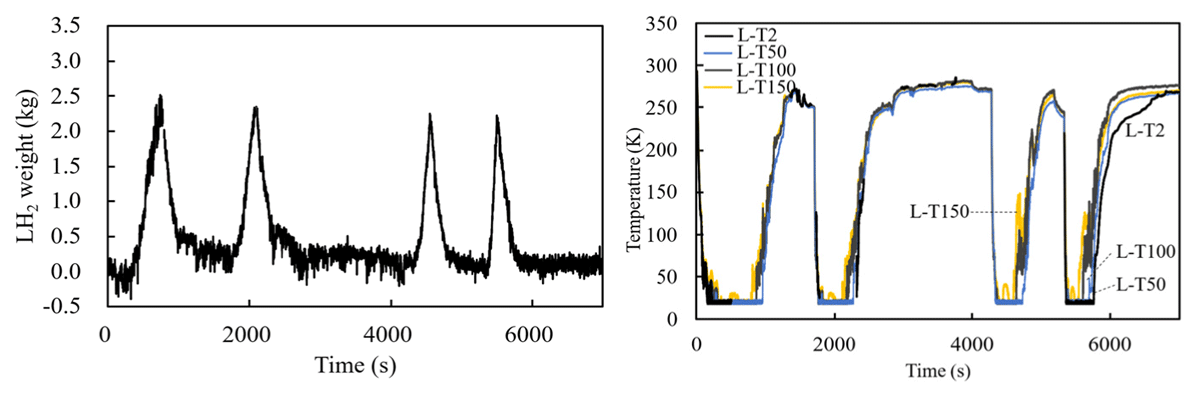
Figure 7
Experimental results using the mortar vessel with a soil layer. (a) Temporal variations of LH2 weight. (b) Temporal variations of temperature in the LH2 reservoir.
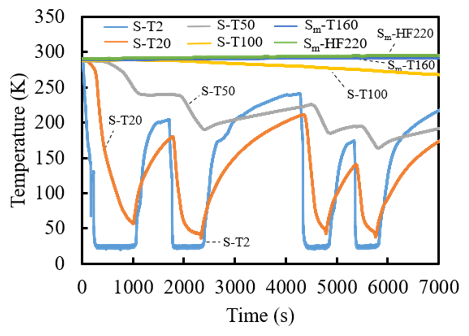
Figure 8
Temporal variation of the temperature at each depth at the center of the mortar vessel with a soil layer.
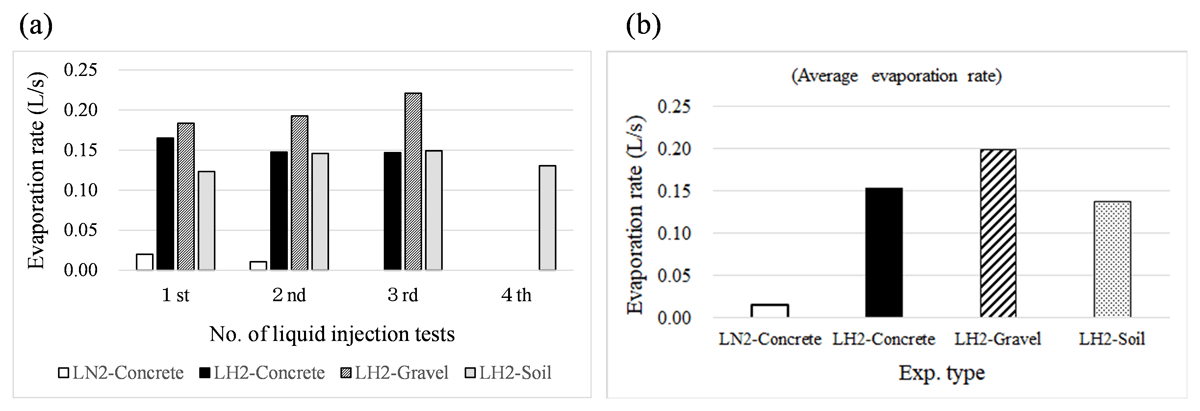
Figure 9
Comparison results for vaporization rate. (a) Vaporization rate for each liquid injection test. (b) Average vaporization rate for each experiment type.