
1.0 Introduction
Japan Suiso Energy Ltd. (JSE), ENEOS Corporation, and Iwatani Corporation have planned to construct a large-scale liquid hydrogen (LH2) storage tank with a capacity of 50,000 m3 as a demonstration project of a large-scale international hydrogen supply chain (Japan Suiso Energy Ltd., n.d.). Since an LH2 storage tank of this size is unique anywhere in the world, the risk of LH2 leaking from the tank or associated equipment must be evaluated. Study on the vaporization process of LH2 that has spilled onto the ground is important for the quantitative risk assessment (Verfondern and Bienhart, 2007; Takeno et al., 1994). Heat transfer from the ground is the main heat source for the vaporization of LH2, and it is necessary to investigate the heat transfer from the ground to the LH2 pool (Xie et al., 2023). In this study, we investigated the differences in vaporization rates on different ground conditions such as concrete, gravel, and soil to provide the knowledge necessary for safer design.
2.0 Experimental Set-Up
Figure 1 shows the schematic of the experimental set-up used in JAXA Noshiro Rocket Testing Center. LH2 from the LH2 storage tank with a capacity of 30 kL was supplied to a concrete vessel. The weight of the LH2 was measured using the load cell type floor scale (Tanaka scale works Co., LTD. Floor scale TT-300, Readability 50 g). The temperature measurements were carried out using a fluororesin-coated T-type thermocouple (Netsushin Co., Ltd. TC-T-6F-0.1). In addition, a heat flow meter (Climatec. CHF-FHF05) was installed at the bottom of the concrete vessel.
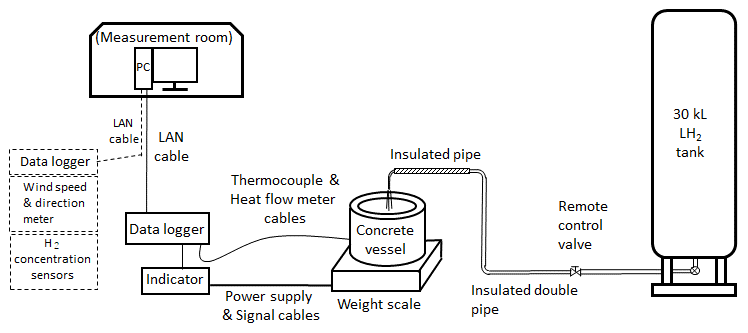
Figure 1
Experimental set-up.
The measurement data was stored in the personal computer (PC) equipped with LabVIEW through the National Instruments Data Acquisition System. Figure 2 shows the concrete and mortar vessels, which were manufactured by Sansho-Bussan Co., Ltd. through Noshiro Densetsu Kogyo Co., Ltd. Figure 2(a) shows the concrete vessel and Figure 2(b) shows the mortar vessel using the experiments of gravel and soil. The outer and inner diameters were 0.66 m and 0.5 m, respectively, for both vessels. The height of the concrete vessel was 0.45 m, and that of the mortar vessel was 0.48 m. The thickness of the bottom for the concrete and mortar vessels was 0.25 m and 0.08 m, respectively. The gravel or the soil was placed in the mortar vessel to a depth of 0.15 m; therefore, the depth of all LH2 reservoirs was set to 0.25 m. Thermocouples and the heat flow meter were installed in each vessel, as shown in Figure 2(a) and 2(b). The gravel used in the experiment was limestone with a grain size of 1.5 cm to 3 cm. In contrast, we used good-quality soil for construction work in the experiment with the soil layer. The soil was sieved through a 5 mm × 5 mm mesh prior to the experiment, resulting in a texture similar to coarse brown sand.
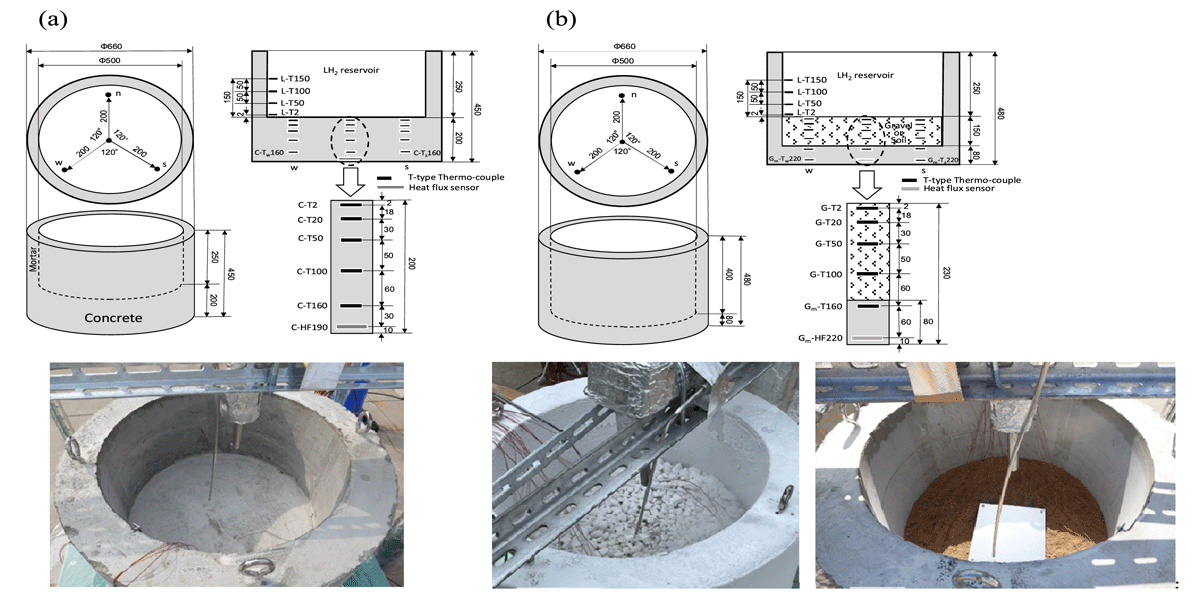
Figure 2
Schematic illustrations and photos of vessels. (a) Concrete vessel. (b) Mortar vessel for the experiments using gravel or soil.
3.0 Experimental Results
3.1 Concrete vessel
Figure 3 shows the temporal variations of LH2 weight, and the temperature in the LH2 reservoir of the concrete vessel (Figure 2(a); L-T2, L-T50, L-T100, and L-T150). In this experiment, three LH2 injections were administered to investigate the heat transfer and the vaporization rate under several ground conditions. Figure 3(a) shows the LH2 weight that was calibrated at the 0.15 m level by deducting the mass of the vessel, the AEROFULEX lid used during LH2 injection, and the mass of accumulated frost. It is seen that the weight increases as the LH2 is poured and decreases as it evaporates. Figure 3(b) shows the temperature in the LH2 reservoir. The temperatures obtained using the T-type thermocouples were calibrated in the temperature range of approximately 20–77 K using the atmospheric pressure data and the saturated vapor pressure temperatures of LH2 and liquid nitrogen (LN2) read from the National Institute of Standards and Technology REFPROP (NIST, 2018). It is to be noted that the average temperature and temperature fluctuation when the four thermocouples were immersed in LH2 was 20.3 ± 2.2 K. It is noted from Figure 3(a) and 3(b) that LH2 was surely stored in the concrete vessel and completely evaporated in all three LH2 injection tests.
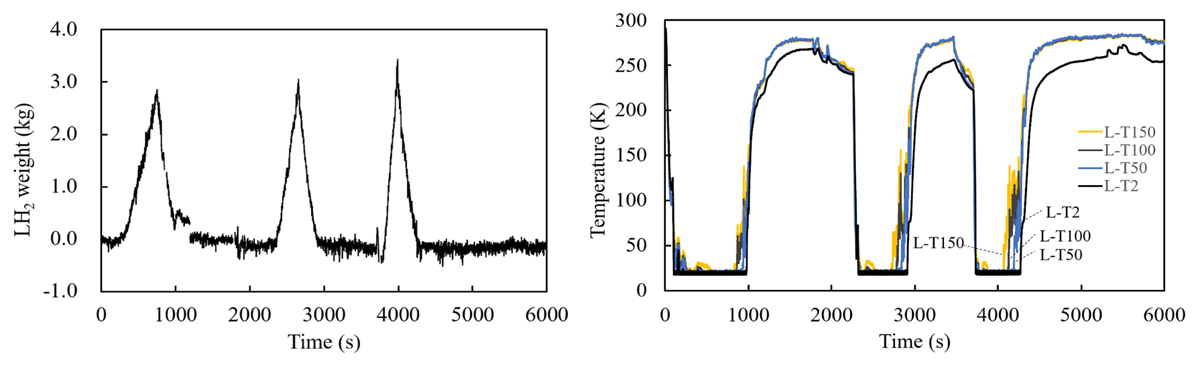
Figure 3
Experimental results using concrete vessel. (a) Temporal variations of LH2 weight. (b) Temporal variations of temperature in the LH2 reservoir.
Figure 4 shows the results of the temperature profiles at different depths at the center of the concrete vessel. The temperature at each location changed over time and was lower at locations closer to the LH2-contacting surface, indicating transient heat transfer within the concrete. The lowest temperature was recorded 2 mm below the bottom of the reservoir (C-T2); however, even during the third injection, it remained relatively high at approximately 63 K. In contrast, the temperature near the bottom of the concrete vessel (C-T160) was slightly lower than the ambient temperature.
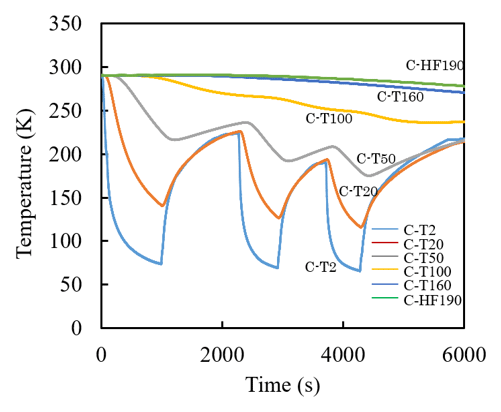
Figure 4
Temporal variation of the temperature at each depth at the center of the concrete vessel.
3.2 Mortar vessel with gravel layer
Figure 5 shows the temporal variations of LH2 weight and the temperature in the LH2 reservoir of the mortar vessel with a gravel layer. Three LH2 injections were also administered in this experiment. Figure 5(a) shows the weight of LH2, and Figure 5(b) shows the temperature in the LH2 reservoir. It is confirmed from Figure 5(a) and 5(b) that LH2 was surely stored in the LH2 reservoir. Figure 5(a) shows that there was secondary weight gain and loss after the LH2 vaporization was done in all three injection tests. Figure 5(b) indicates that these secondary weight change phenomena occurred during the rapid temperature increase from 20 K to approximately 150K (L-T2) after the LH2 vaporization ended for each injection. These weight changes are considered to represent condensation (solidification and liquefaction) and the subsequent vaporization of air, that is, nitrogen and oxygen. A similar phenomenon regarding gravel was reported in a previous study by Friedrich et al. (2021); however, a weight decrease that could clearly be attributed to subsequent vaporization of condensed air was not observed in this study. The difference may be attributed to the smaller grain size of the gravel used in the present study compared with that reported in Friedrich et al. (2021), which enabled the detection of air vaporization.
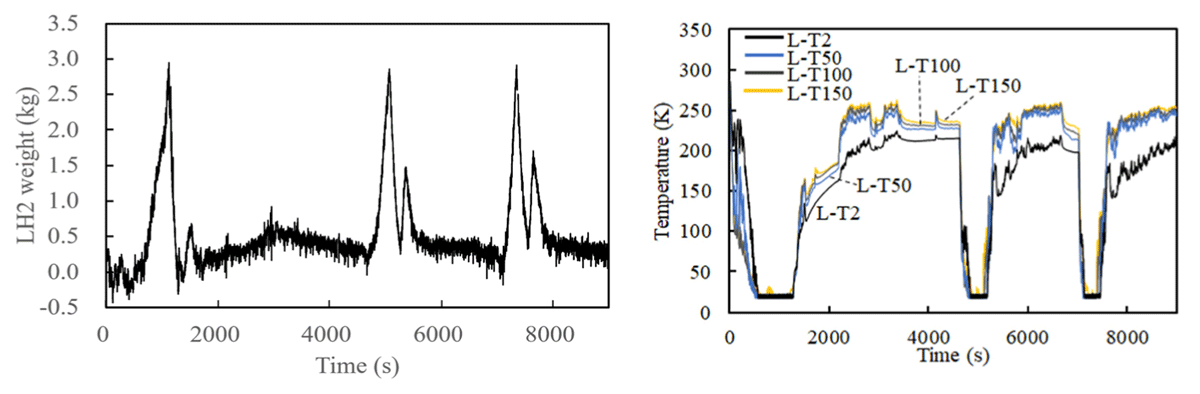
Figure 5
Experimental results using the mortar vessel with a gravel layer. (a) Temporal variations of LH2 weight. (b) Temporal variations of temperature in the LH2 reservoir.
The temporal variations in the temperature profiles at different depths at the center of the mortar vessel with a gravel layer are shown in Figure 6. The temperature profiles differ markedly from those of the concrete vessel. The temperature in the gravel layer rapidly decreased to the LH2 temperature, and the temperature inside the mortar vessel also decreased significantly. This suggests that the LH2 quickly reached the bottom of the mortar vessel once it was poured. It is also noted that the rate of temperature increase after the LH2 vaporization was slower in the deeper gravel layer (G-T100) than in the shallower layers (G-T2, G-T20, and G-T50), suggesting that liquid air tended to remain at the bottom of the reservoir.
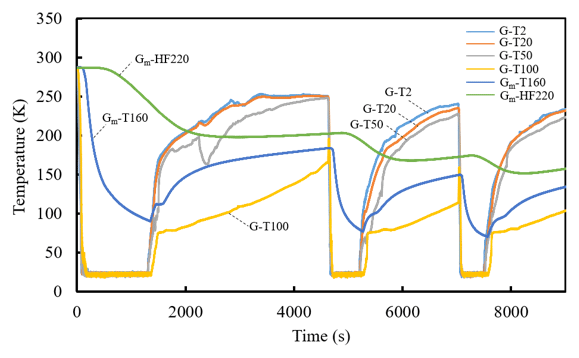
Figure 6
Temporal variation of the temperature at each depth at the center of the mortar vessel with a gravel layer.
3.3 Mortar vessel with soil layer
Figure 7 shows the temporal variations of LH2 weight and the temperature in the mortar vessel with a soil layer. Figure 7(a) shows the weight and Figure 7(b) shows the temperature in the reservoir. In this experiment, four LH2 injections were administered.
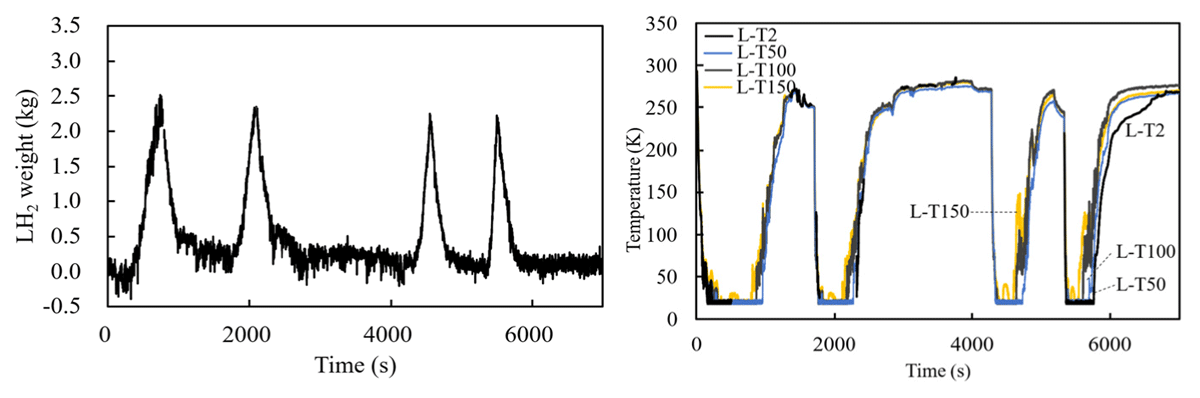
Figure 7
Experimental results using the mortar vessel with a soil layer. (a) Temporal variations of LH2 weight. (b) Temporal variations of temperature in the LH2 reservoir.
Figure 7(a) shows that no secondary weight change was observed, in contrast to the behavior shown in Figure 5(a). Figure 7(b) shows that all thermocouples installed in the LH2 reservoir indicate a temperature decrease to approximately 20 K, confirming that LH2 was stored in the mortar vessel with the soil layer.
Figure 8 shows the temporal variation in temperature at different depths at the center of the mortar vessel with the soil layer. The temperature at 2 mm below the soil surface (S-T2) reached approximately 20 K after injection. The temperature at 20 mm below the soil surface (S-T20) also dropped significantly. In contrast, the temperature at 100 mm below the soil surface (S-T100) decreased more slowly, and the temperature within the mortar vessel remained slightly below the ambient temperature. These results indicate that LH2 penetrated the soil layer to a depth greater than 2 mm but less than 20 mm, suggesting limited infiltration of LH2 into the soil layer. It should be noted that it depends on the run time. Total run time for each run was approximately 1050 s for the first run, 640 s (from 1710 s to 2350 s) for the second run, 500 s (from 4290 s to 4790 s) for the third run, and 480 s (from 5350 s to 5830 s) for the fourth run, respectively. In our experiment, total run time was decreased, followed by the number of runs, because the initial surface temperature was getting decreased.
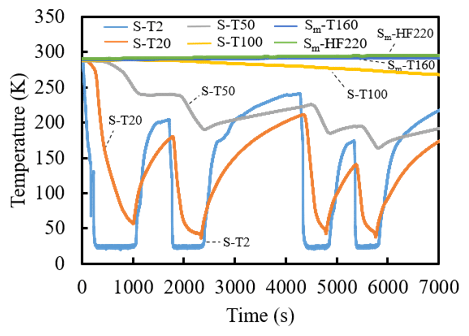
Figure 8
Temporal variation of the temperature at each depth at the center of the mortar vessel with a soil layer.
3.4 Comparison of vaporization rates among several substrate conditions
Figure 9 presents the vaporization rates after the termination of the LH2 injection once a LH2 pool had formed in the vessel. The vaporization rate was defined as the mass loss per unit time, determined from the slope of the weight–time curve over the period between LH2 detection at 150 mm and complete vaporization. The average vaporization rate during this period was calculated from the time variation of the measured weight data. Figure 9(a) shows the vaporization rates for each substrate and for each injection, while Figure 9(b) summarizes the average vaporization rate for each substrate. For comparison, the experimentally measured vaporization rate of LN2 under the concrete substrate condition is also included.
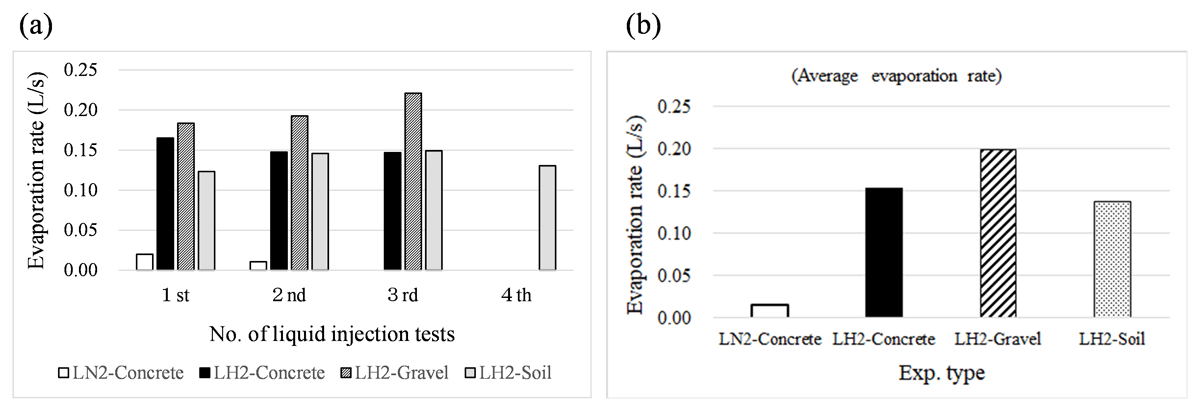
Figure 9
Comparison results for vaporization rate. (a) Vaporization rate for each liquid injection test. (b) Average vaporization rate for each experiment type.
Figure 9(a) shows that the vaporization rates of both LH2 and LN2 on the concrete substrate slowed down as the number of injections increased, while the opposite trend was observed on the gravel. The vaporization rate is likely to decrease under the lower ground surface temperature (Kim, Nguyen and Choi, 2016), as shown in the result of the concrete ground test. It is speculated that the difference in the trend is related to the presence of air in the gravel layer; however, further investigation is required. In contrast, no clear trend was observed from the soil ground test.
Figure 9(b) shows that the average vaporization rates of LN2 and LH2 in the concrete vessel are 0.015 L/s and 0.153 L/s, indicating that LH2 vaporization rate is approximately 10 times larger than that of LN2. The average vaporization rates of LH2 in the mortar vessel with the gravel and soil layers are 0.199 L/s and 0.137 L/s, respectively. In this series of experiments, the vaporization rate was fastest on gravel, followed by concrete and soil. This difference is thought to be due to the difference in the heat input from each material to LH2.
4.0 Conclusions
LH2 was poured into the cylindrical concrete vessel as well as the cylindrical mortar vessel with a gravel or soil layer at the bottom. For comparison, LN2 was also poured into the concrete one. From the LH2 weight and temperature measurements, it is confirmed that LH2 was surely stored in the LH2 reservoirs.
It is also confirmed from the temperature profiles inside the concrete-, gravel-, and soil-layer bottoms that the thermal phenomena were transient. In the case of the concrete vessel, the lowest temperature inside the concrete bottom was about 63 K. In the case of the experiment using gravel, the temperature in the gravel layer rapidly decreases to approximately 20K, and the temperature inside the mortar vessel also decreases significantly. A secondary weight change after LH2 vaporization was observed only when gravel was used as the bottom material. This weight change is thought to be due to the condensation (solidification and liquefaction) and vaporization of air. In the case of the experiment using soil, LH2 penetrated into the soil layer to the depth of more than 2 mm but less than 20 mm at the center, suggesting limited infiltration of LH2 into the soil layer. In contrast, the temperature inside the mortar vessel remained at approximately ambient levels.
The vaporization rate was fastest on gravel, followed by concrete and soil. This difference is considered to be due to the difference in the heat input from the LH2 contact surface with each material. In addition, the vaporization rate of LH2 is about 10 times larger than that of LN2 in the concrete vessel.
In this study, LH2 was pooled and evaporated in a relatively small, bounded vessel. While this confined geometry promoted local cooling and air condensation—and thus is not directly identical to a highly dispersive spill into a large open bund—it effectively simulates a severe, worst-case scenario. Specifically, it represents a condition where a massive leak rapidly forms a localized pool, maximizing the conductive heat transfer from the foundation material.