
Figure 1
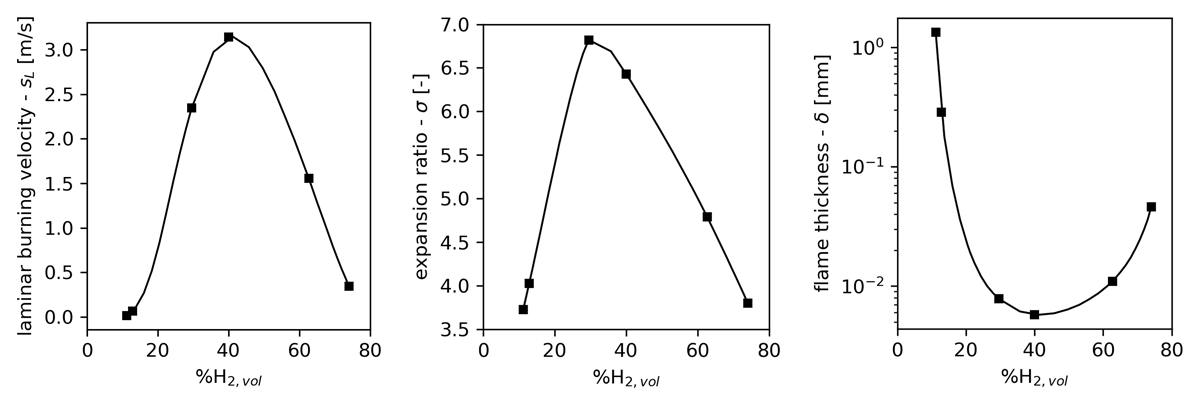
Laminar burning velocity, expansion ratio, and laminar flame thickness as a function of %H2,vol in air. Markers are shown for 11.2, 12.8, 19.6, 40.1, 62.7, and 74 %H2,vol. Initial conditions: p0 = 100 kPa and T0 = 300 K.
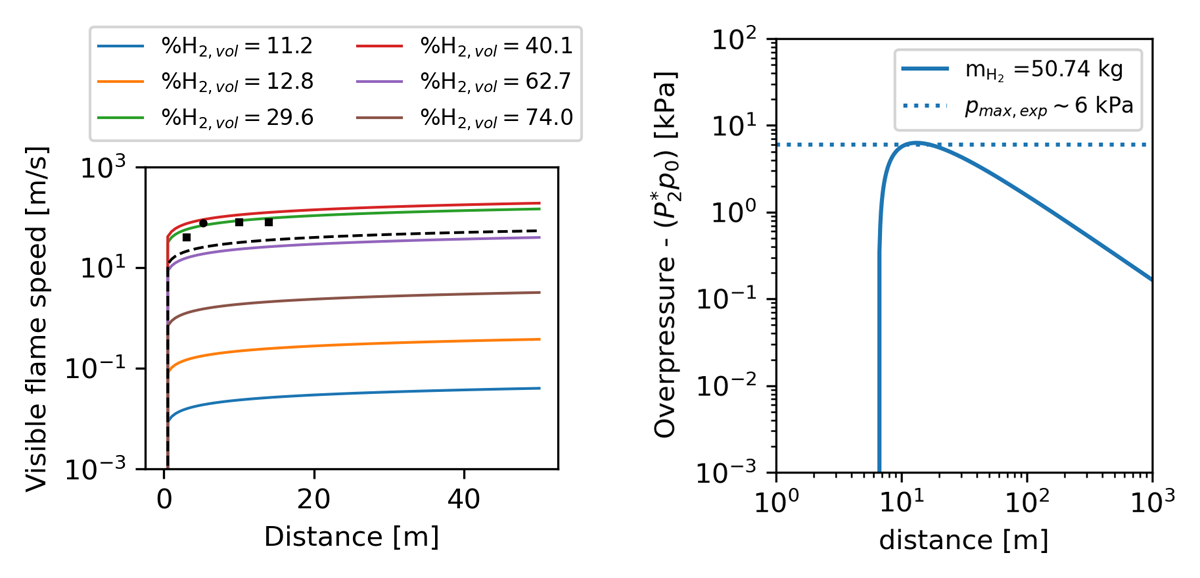
Figure 2
Left: Visible flame speed Vf versus distance computed with Equation 2 for varying H2 content in air. Initial conditions: p0 = 100 kPa and T0 = 300 K. Dashed line shows the results for the arithmetic average of FCP for %H2,vol ≥ 29.6. Square and circular markers are experimental data points for a hemisphere filled with 29.6 %H2,vol taken from Pförtner and Schneider (1983) and computed using data from Groethe et al. (2007), respectively. Right: Predicted (Equation 1) and maximum measured overpressure for experimental configuration in Pförtner and Schneider (1983).
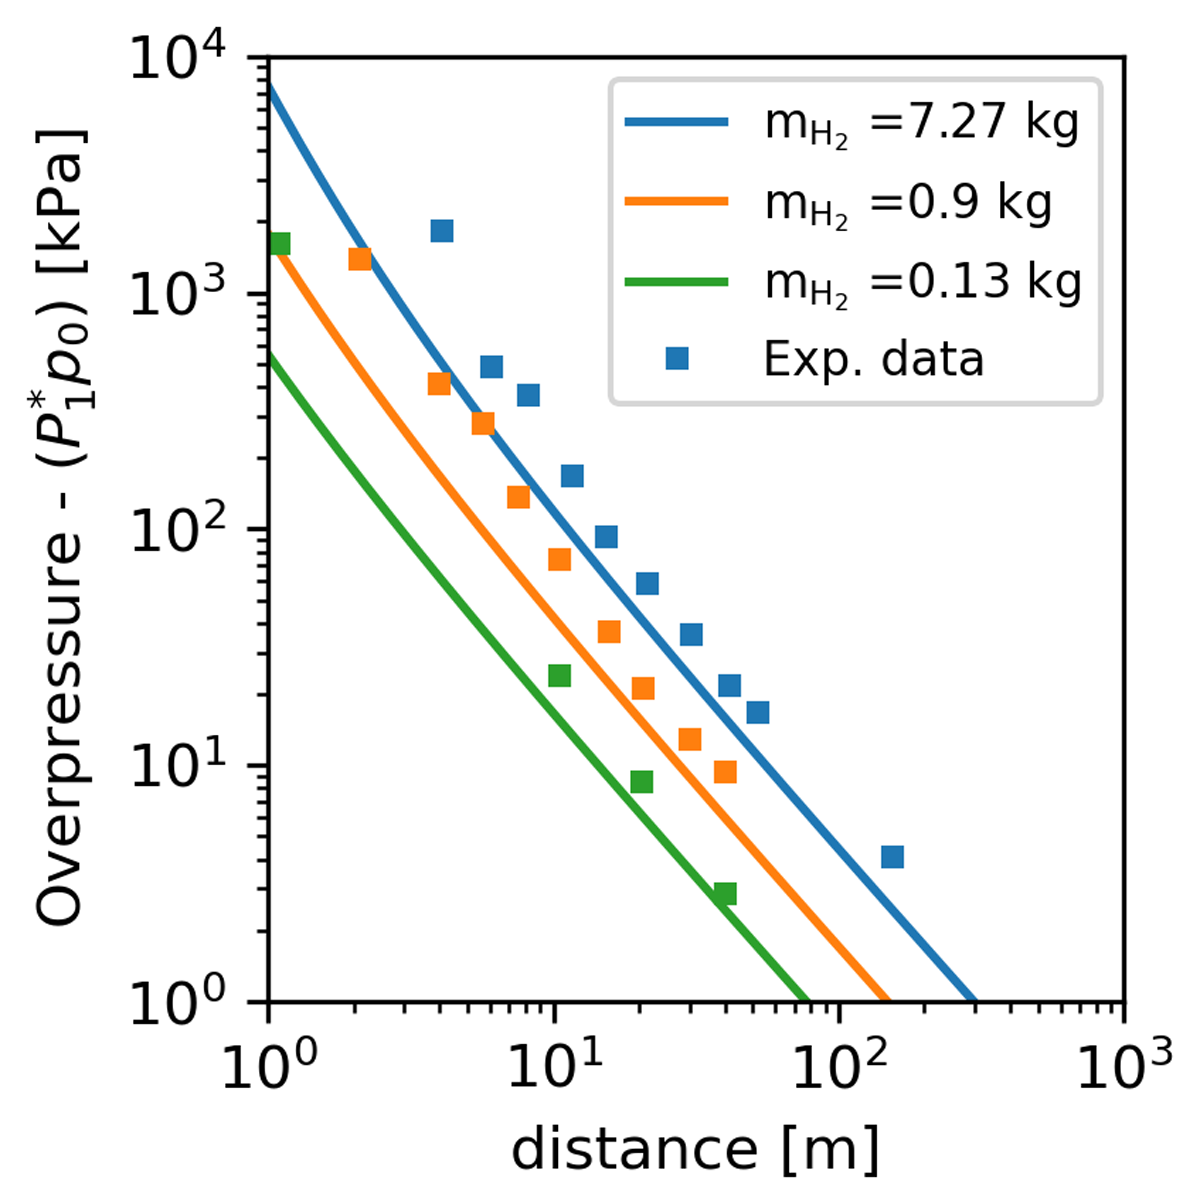
Figure 3
Predicted (Equation 3) and measured overpressure as a function of distance R. Square markers are experimental data points for a 300 m3 hemisphere filled with a stoichiometric H2-air mixture (∼30 %H2,vol) taken from Groethe et al. (2007). Initial conditions: p0 = 100 kPa and T0 = 300 K.
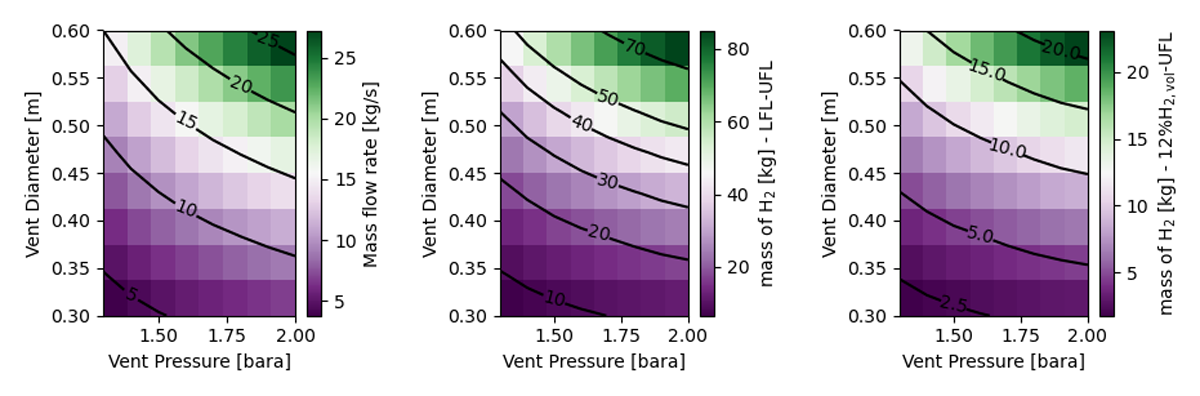
Figure 4
Dispersion results: heat maps showing relevant metrics that serve as inputs to the deflagration and detonation correlations.
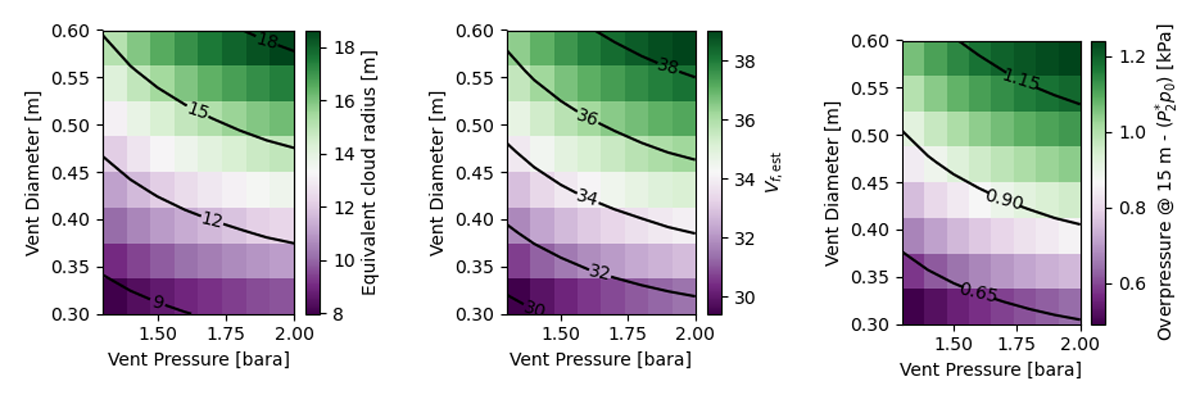
Figure 5
Heat maps of equivalent cloud radius, Rcloud = (3Vcloud/2π)1/3 of a hemisphere containing the same volume as the entire release, estimated visible flame velocity, Vf, and estimated overpressure at 15 m computed using the unconfined uncongested deflagration correlation (Equation 1).
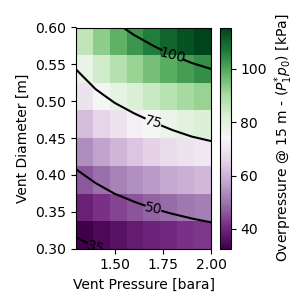
Figure 6
Heat map of estimated overpressure at 15 m computed using the unconfined uncongested detonation correlation (Equation 3).
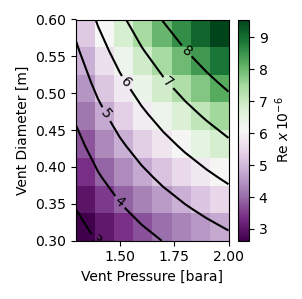
Figure 7
Reynolds number for the parametric space considered.
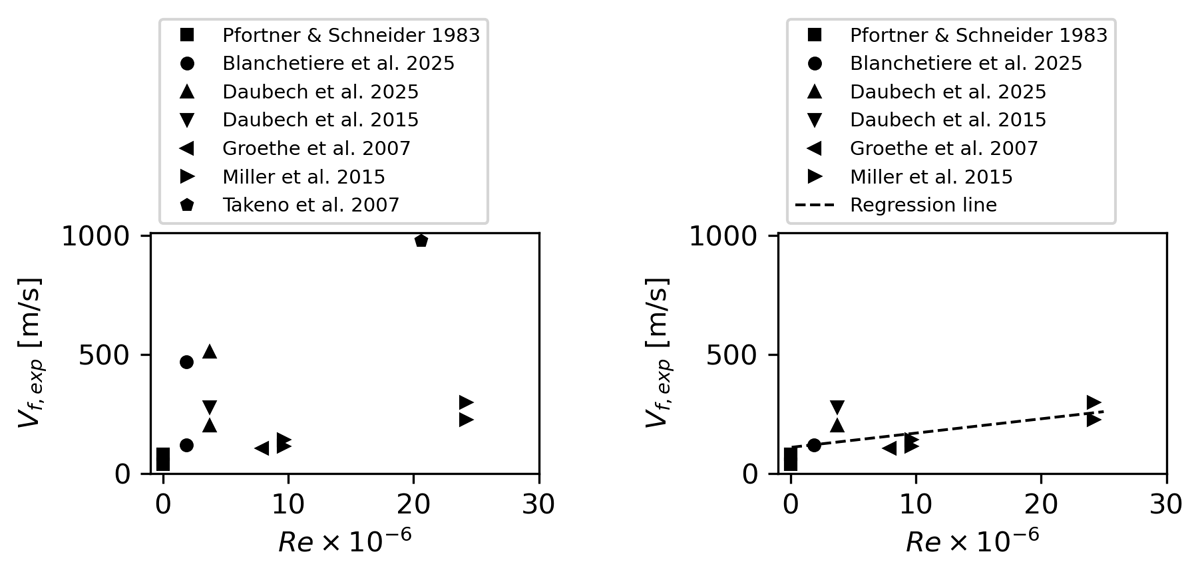
Figure 8
Measured visible flame velocity, Vf as a function of vent Reynolds number, Re. Left: complete dataset. Right: curated dataset. Dashed line is a least-squares regression line to the data points given by Vf = 6.0061Re + 110.0135.
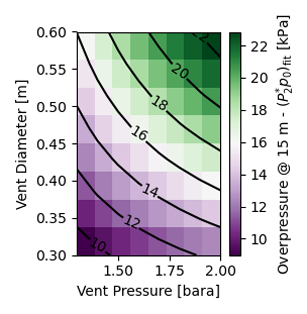
Figure 9
Unconfined uncongested deflagration results recomputed using the Vf = f(Re) correlation derived from the experimental data.