
1. Introduction
Hydrogen venting is a critical safety process in industries where hydrogen is produced, stored, or used as fuel (Dorofeev, 2007; Melguizo-Gavilanes, Pekalski, and Crerand, 2024). As hydrogen plays a growing role in the low-carbon energy transition, managing its venting is essential to prevent overpressurization and ensure system safety. Hydrogen’s low molecular weight and high diffusivity allow it to disperse quickly, reducing accumulation risks (Boivin et al., 2023). However, improper venting can lead to hazards such as flammable cloud formation, delayed ignition, or hydrogen jet ignition (Schefer et al., 2007). High-pressure venting creates high-velocity jets that, if ignited by static electricity, sparks, or hot surfaces, may result in jet fires. Hydrogen’s wide flammability range (4–75%) and low ignition energy make it particularly prone to ignition, necessitating robust safety measures (Brennan and Molkov, 2013).
The key challenges in hydrogen venting include predicting dispersion patterns under varying environmental conditions (e.g., wind, temperature, humidity) (Venetsanos, Papanikolaou, and Bartzis, 2010) and mitigating ignition risks. Tools such as Shell FRED (Fire Release Explosion Dispersion) and PHAST (Professional, Process Hazard Analysis Software Tool) provide initial dispersion modeling. At the same time, vent system designs must incorporate safety measures such as grounding, bonding, and flame arrestors (Astbury and Hawksworth, 2007). A significant concern is delayed ignition, where dispersed hydrogen clouds ignite after encountering a distant ignition source, potentially causing deflagration or even detonation under certain conditions (Chamberlain, Oran, and Pekalski, 2019; Thomas, Eastwood, and Goodrich, 2015; Oran, Chamberlain, and Pekalski, 2020). While vent releases into open air typically reduce explosion risks due to minimal congestion, it is argued that hydrogen’s high burning rate may still generate damaging overpressures in turbulent conditions (Groethe et al., 2007; Miller, Eastwood, and Thomas, 2015).
Industry standards, such as API 521 (Standard, 2020), focus on thermal radiation safety but may not adequately address overpressure risks from hydrogen venting. For instance, a worker beneath a vent stack designed to meet thermal radiation guidelines may still face unsafe overpressure levels if ignition occurs. This highlights the need for reliable models to predict overpressures during venting.
This article builds on the methodology first introduced in the work of Melguizo-Gavilanes, Pekalski, and Crerand (2024) that has been revisited by Dorofeev (2007). The limitations of the predictive capabilities of unconfined and uncongested deflagration/detonation models when tested against available experimental data are addressed (i.e., large under-/overpredictions in overpressure estimates). An updated methodology is proposed based on a scaling that relates the vent release conditions (i.e., pressure and diameter) to the visible flame velocity in nonuniform, nonquiescent flammable clouds. The magnitude of the resulting overpressure estimates is in agreement with experimentally reported values.
2. Methodology
This section introduces the methodology, which comprises a dispersion calculation and the use of correlations to compute overpressures or blast loads from unconfined and uncongested deflagrations and detonations. It was first introduced in the work of Melguizo-Gavilanes, Pekalski, and Crerand (2024) and is included below for completeness.
2.1. Dispersion
The dispersion contours can be estimated for the actual composition in the vent using the pressurized release scenario in Shell FRED or using any other standard consequence modeling software such as PHAST. This information is useful to estimate the total mass/volume of gas present in the cloud between lower flammability limit (LFL) and upper flammability limit (UFL), or other relevant contours, in particular, the mass of H2 that is likely to contribute to the overpressure in case of delayed ignition of the H2-air cloud. Note that it is the available mass of H2 that determines the total (potential) combustion energy that can be released. This is a key input parameter required for the correlations used to estimate the expected overpressures from deflagrations or detonations that is presented as follows.
The external environment conditions are also an important input to the model. For vertical releases and expected configuration of vents, care must be taken when the exit velocities are comparable to typical wind speeds in the area where the vent is to be operating.
2.2. Overpressure: Unconfined deflagration case
An appropriate description for the blast loads induced by deflagrations should necessarily include the flame speed as the pushing of the gas ahead of the flame is responsible for the pressure buildup. The overpressure at the cloud boundary can be obtained by a quasi-acoustic approximation, which yields the following expression for overpressure:
The coefficients are applicable to air explosions. The parameters P* = ∆p/p0 and R* = R(p0/E)1/3 are referred to as Sachs variables and represent a scaled overpressure and distance, where R denotes the radius from the blast epicenter. ∆p = p – p0 is the overpressure, p0 is the ambient pressure, and E is the total combustion energy released.1 The latter is a function of the type and mass of fuel present in the cloud. Additional details about this correlation can be found in Dorofeev’s papers (2007, 1995). Vf denotes the visible flame speed or flame speed in the laboratory frame of reference, σ is the expansion ratio, and a0 the sound speed in air (353 m/s at 300 K). Note that the prediction of turbulent flame speeds Vf for given initial and boundary conditions is a rather complex problem; however, an estimate for the increase in Vf with distance R for freely propagating flames based on fundamental combustion properties (FCP) can be suggested (Dorofeev, 2007).
Here, A = 8.5 × 10⁻³ is an empirical parameter obtained via least-squares regression by fitting experimental data for various fuel–air mixtures to the functional form mentioned above. The remaining variables are FCP, namely, sL which indicates the laminar burning velocity and δ = ν/sL which indicates the laminar flame thickness with ν denoting the momentum diffusivity or kinematic viscosity of the reactive gas. The FCP are a function of stoichiometry or fuel concentration and can be computed using thermochemical packages such as that provided by Cantera (Goodwin et al., 2023), together with a detailed chemical mechanism like GRI-Mech 3.0 (Smith et al., 2021). This is shown in Figure 1.
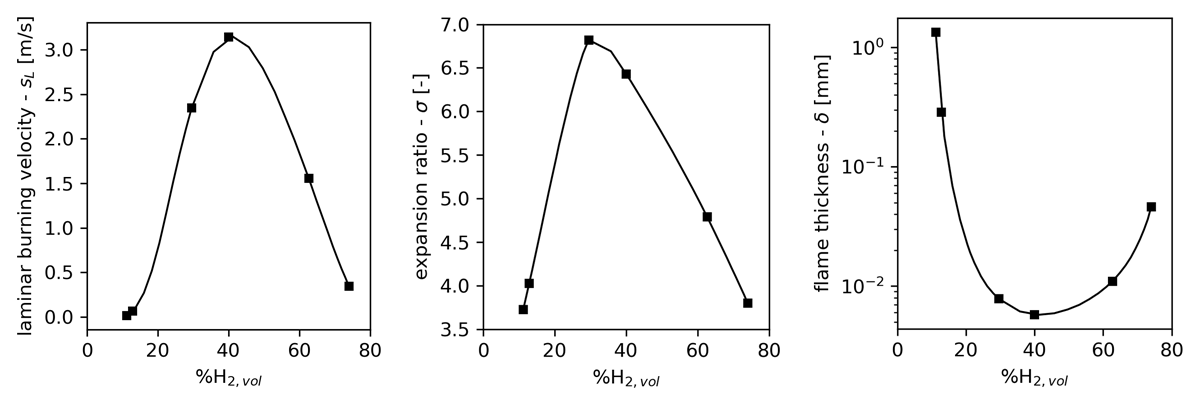
Figure 1
Laminar burning velocity, expansion ratio, and laminar flame thickness as a function of %H2,vol in air. Markers are shown for 11.2, 12.8, 19.6, 40.1, 62.7, and 74 %H2,vol. Initial conditions: p0 = 100 kPa and T0 = 300 K.
For H2-air mixtures at ambient pressure and temperature, sL exhibits a lower and upper limit of 0.014 m/s and 3.14 m/s at %H2,vol of 11.2 and 40, respectively; σ is bounded between 3.73 at %H2,vol = 11.2, and 6.82 at %H2,vol = 29.6; δ shows a minimum at %H2,vol = 40 (5.76 × 10⁻³ mm) and a maximum at %H2,vol = 11.2 (1.33 mm).
An added complexity in realistic releases is that the resulting clouds are nonuniform. Thus, their eventual delayed ignition would result in spatially dependent visible flame velocities, Vf. However, the correlations discussed include a single value of the FCP to be used as inputs. Approaches using varying degrees of complexity can be thought of to arrive at sensible values to use, such as defining average values accounting for the FCP dependence on stoichiometry by integrating over the volume of the cloud and invoking some simplifying assumptions2 or using computational fluid dynamics (CFD). For the latter, the length and time scales of industrial interest may render the use of CFD intractable at present. Here, for simplicity, an arithmetic average based on the dependencies shown in Figure 1 for %H2,vol ≥ 29.6 is deemed as sufficient.
Figure 2 (left) shows the predicted Vf as a function of distance predicted by Equation 2. Note that in the range of %H2,vol present in reactive clouds, Vf can easily span four orders of magnitude. The lower bound corresponds to 11.2 %H2,vol whereas the upper bound is given by 40.1 %H2,vol. The dashed line in the figure shows the result obtained using the arithmetic average of the FCP mentioned above, i.e., sL = 1.85 m/s, σ = 5.46, and δ = 1.76 × 10⁻² mm. The markers show experimental results from Pförtner and Schneider (1983) (squares) and Groethe et al. (2007) (circle – one data point) for unconfined deflagrations in quiescent stoichiometric H2-air (29.6 %H2,vol) ignited in a hemispherical plastic envelope which was cut before ignition. Vf values of 40, 78, 80, and 80 m/s are reported at distances of 3, 5.23, 10, and 14 m, respectively, from ignition. Equation 2 yields 57, 69, 85, and 96 m/s at the same distances. Figure 2 (right) shows the overpressure predictions for deflagrations (quiescent 29.6 %H2,vol uniform flammable cloud) containing a mass of hydrogen of approximately 51 kg in a hemisphere of radius R = 10 m. The maximum overpressure recorded in the air blast wave was about 6 kPa; the maximum overpressure given by Equation 1 is 6.21 kPa, which is in good agreement with the experimental data.
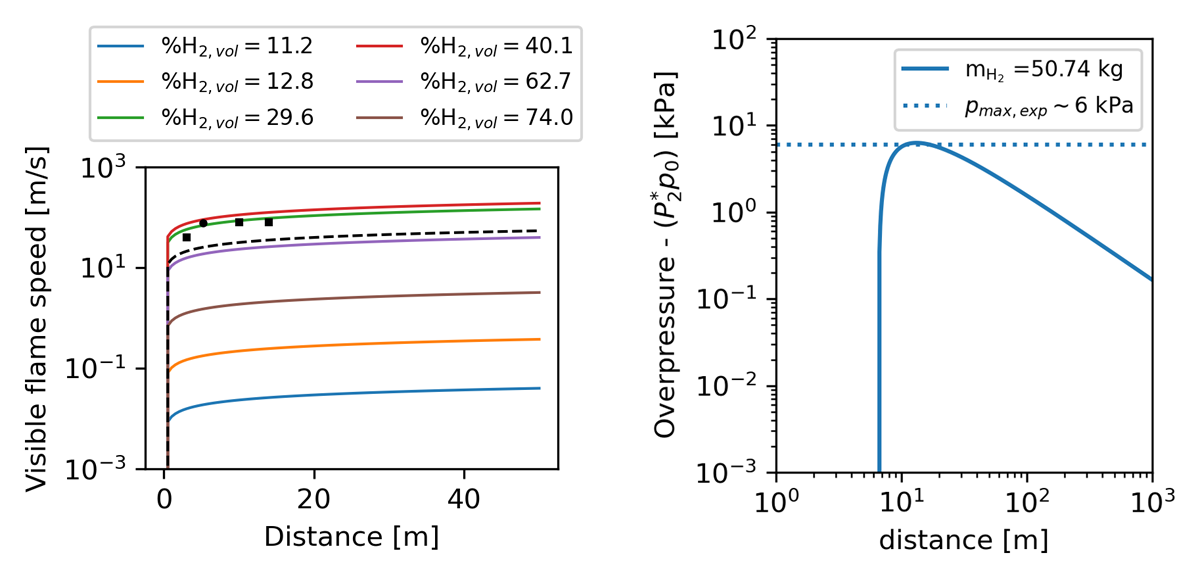
Figure 2
Left: Visible flame speed Vf versus distance computed with Equation 2 for varying H2 content in air. Initial conditions: p0 = 100 kPa and T0 = 300 K. Dashed line shows the results for the arithmetic average of FCP for %H2,vol ≥ 29.6. Square and circular markers are experimental data points for a hemisphere filled with 29.6 %H2,vol taken from Pförtner and Schneider (1983) and computed using data from Groethe et al. (2007), respectively. Right: Predicted (Equation 1) and maximum measured overpressure for experimental configuration in Pförtner and Schneider (1983).
2.3. Overpressure: Unconfined detonation case
The following correlation can be used for estimating the far-field relative maximum overpressure of a blast wave created by a vapor cloud detonation in open space (Dorofeev, 2007, 1995).
The Sachs variables defined in the previous section remain valid.
While an unconfined detonation defines an upper bound of the overpressure effect, the direct initiation of detonations is not a very probable event in industrial accidents, as energy deposition typical of high explosives is required. Detonations may plausibly occur as a result of the accidental ignition of a flammable cloud, the formation of a flame, and its subsequent acceleration and transition to detonation within the cloud. For uncongested and unconfined releases, two flame acceleration mechanisms come to mind. The first is intrinsic flame instabilities due to the expansion of burnt gases (Darrieus–Landau instability) and heat and mass diffusion taking place at different rates across the flame surface (thermo-diffusive); the latter is quite prominent in lean H2 mixtures. The second factor is the interaction of the flame with the background turbulence generated by the release. These mechanisms, however, are not as effective as congestion in leading to a substantial increase in flame surface area and burning rate, and therefore to strong flame acceleration within the cloud, such that Vf values on the order of a few hundred m/s can be attained.
To validate the correlation above, the experiments of Groethe et al. (2007) are used, in which 300, 37, and 5.2 m3 of quiescent premixed stoichiometric H2-air contained in a hemispherical plastic tent that was cut prior to ignition were detonated using a high explosive. In these idealized configurations, the mass of H2 present in the cloud is known, approximately 7.3, 0.9, and 0.13 kg H2, respectively. The total combustion energy released, E, is therefore a key input to the model. The results are shown in Figure 3. The agreement with the measured data is satisfactory.
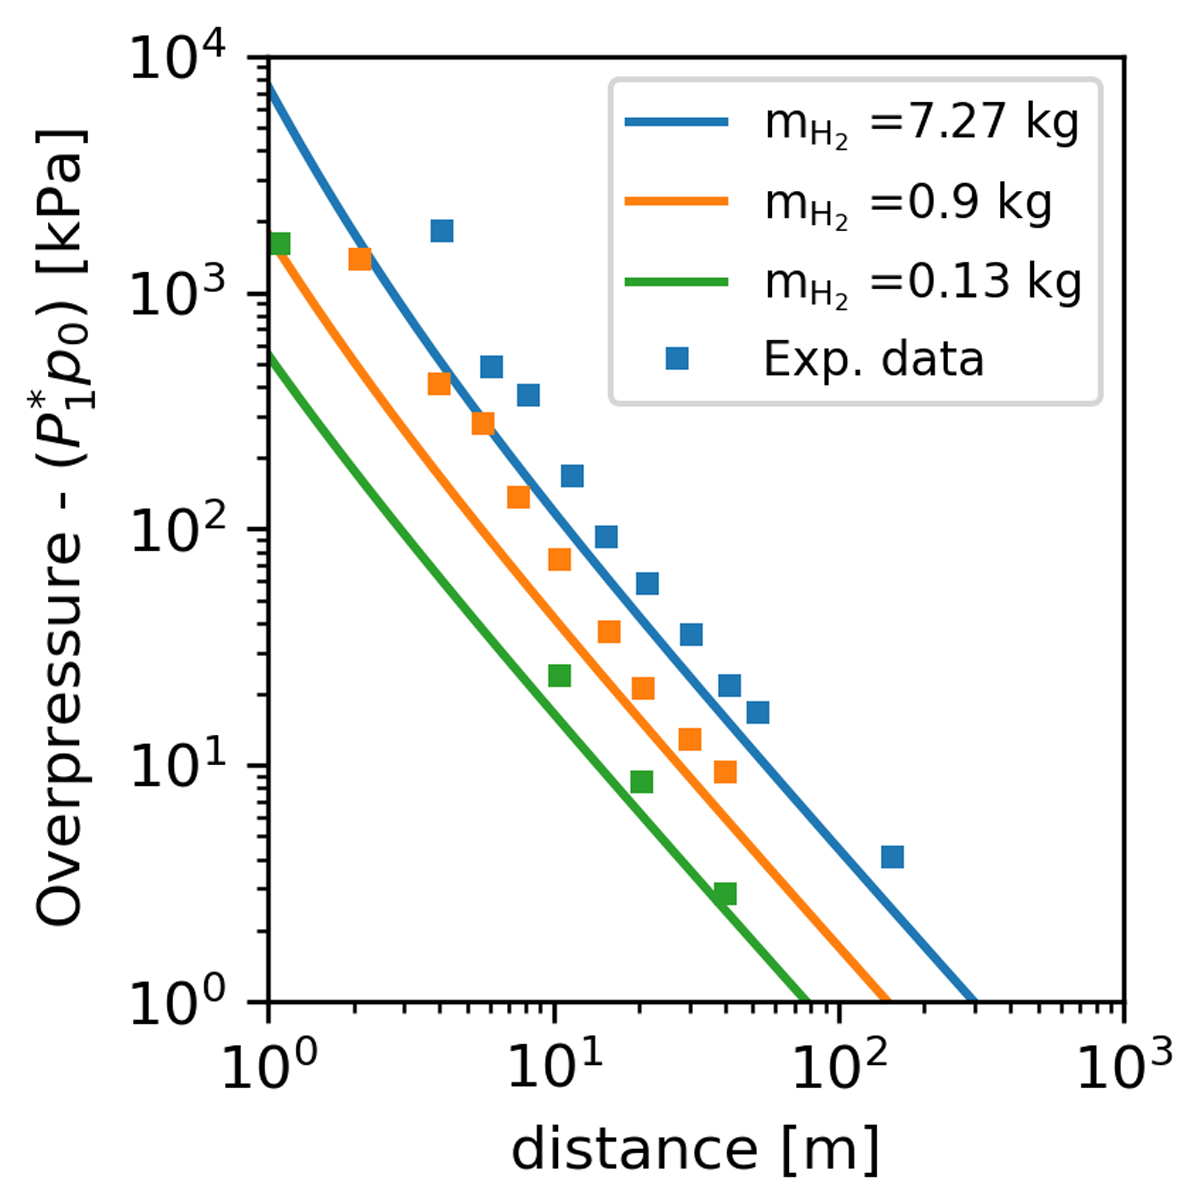
Figure 3
Predicted (Equation 3) and measured overpressure as a function of distance R. Square markers are experimental data points for a 300 m3 hemisphere filled with a stoichiometric H2-air mixture (∼30 %H2,vol) taken from Groethe et al. (2007). Initial conditions: p0 = 100 kPa and T0 = 300 K.
For the nonuniform clouds typical of realistic releases, the accurate determination of E is not so straightforward since the amount of fuel present in the cloud that contributes to the blast load needs to be estimated. Here, for simplicity, it will be assumed that H2-air mixtures at ambient conditions (100 kPa and 273 K) are detonable in the range of 12–74%H2,vol (Stamps et al., 1991). The choice is motivated by the sharp increase in cell sizes measured in tubes between 14 %H2,vol and 13 %H2,vol signaling the presence of a limit around these values (Kaneshige and Shepherd, 1997); the cell size is an intrinsic length scale in detonations used to characterize them. However, it is important to note that detonability limits are not fixed values of mixture composition but depend on the ratio of a length scale dictated by the geometry of the system to the cell size. For a more complete discussion on detonability limits for nonuniform clouds and the concept of a limiting cell size gradient, see the work of Bauwens, and Dorofeev (2020). In the parametric study, the mass of H2 used for computing unconfined detonation blast loads will be that given by a dispersion calculation between the 12 and74 %H2,vol contours, whereas for the deflagration case, the mass of H2 present in the entire flammable range will be used. Furthermore, it will be assumed that the entire mass of H2 contributes to the blast load.
3. Results and Discussion
3.1. Vent conditions and external environment
The venting of pure H2 through headers of diameter d = 0.3–0.6 m and vent pressures of p = 1.3–2 bara at a height of 15 m are considered. Temperature is assumed to be 313 K (40oC). A total of 64 simulations are run covering this parametric space. The ambient pressure, temperature, and relative humidity are set to 101.325 kPa (1 bara), 288 K (15oC), and 70%, respectively, with a wind speed of 5 m/s. The meteorological conditions defining the Pasquill stability class correspond to slight daytime insolation and overcast nighttime conditions (i.e., D-Neutral).
3.2. Dispersion results
Figure 4 shows heat maps of relevant selected metrics from steady-state dispersion calculations carried out in FRED: namely, the vent mass flow rate (kg/s), mass of H2 between LFL and UFL (kg), and the mass of H2 between 12 %H2,vol and UFL (kg). These are crucial parameters to compute the total combustion energy release, E. The solid lines represent the combination of vent pressure p and diameter d that results in a constant value of the metric of interest.
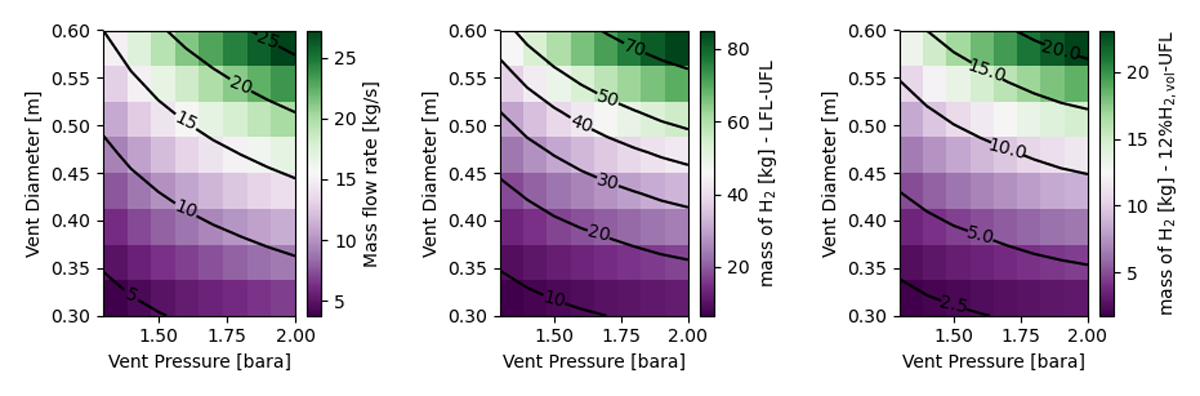
Figure 4
Dispersion results: heat maps showing relevant metrics that serve as inputs to the deflagration and detonation correlations.
These maps provide an efficient way to visualize the results and can serve as a guide for vent design/consequence assessments where, given a set of constraints, one can provide the vent p – d pair that would comply with this requirement. For example, the conditions that would limit the mass flow rate to be below 10 kg/s are vent diameters between 0.35 and 0.5 m, for decreasing vent source pressure of 2–1.3 bara.
3.3. Overpressure results
3.3.1. Unconfined uncongested deflagration
Quantities that can be computed based on the dispersion results such as the equivalent cloud radius, Rcloud, and the visible flame speed, Vf, that in turn enable to estimate the unconfined deflagration overpressure using Equation 1 are shown in Figure 5. Clouds of ∼ 8–18 m in radius are expected with associated values of Vf between 30 and 38 m/s. The overpressure is a decreasing function of distance; however, for ease of visualization and subsequent comparison with the detonation results, the latter is shown at a distance equal to the height of the vent (15 m) location that denotes the minimum distance to personnel or infrastructure in the process facility for which the venting scenarios are being investigated.
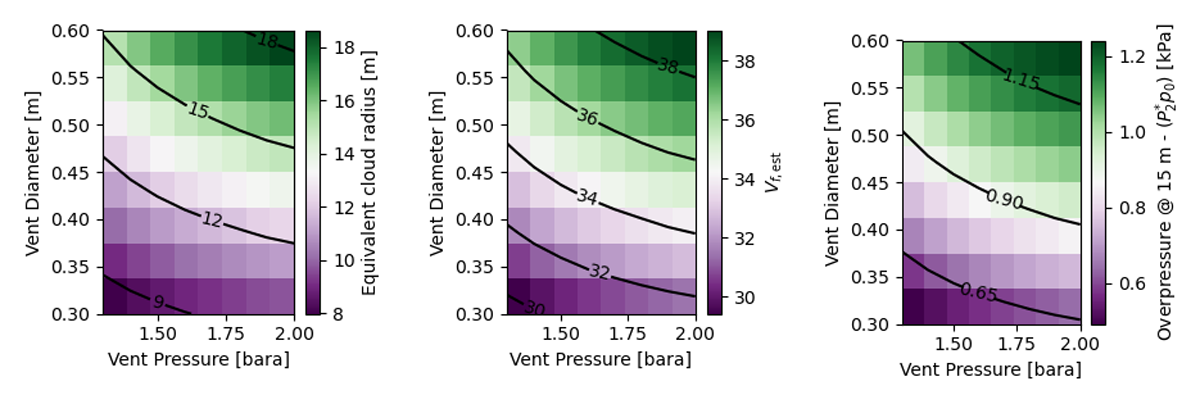
Figure 5
Heat maps of equivalent cloud radius, Rcloud = (3Vcloud/2π)1/3 of a hemisphere containing the same volume as the entire release, estimated visible flame velocity, Vf, and estimated overpressure at 15 m computed using the unconfined uncongested deflagration correlation (Equation 1).
Higher overpressures are achieved for higher values of Vf since ∝ (Vf/a0)2; Vf is in turn proportional to R1/3 which is satisfied for larger clouds as seen in Figure 5. The overpressures estimated for the conditions considered lie in the range of 0.49–1.24 kPa. Comparing these values against conditions for which experimental data exists—i.e., mostly horizontal releases at higher pressures, p = 24–400 bar, and smaller diameters, d = 6–52.5 mm (Daubech et al., 2015, 2025; Groethe et al., 2007; Takeno et al., 2007; Blanchetière et al., 2025)—suggests that the unconfined and uncongested deflagration correlation, as is, may be underestimating the overpressure values by at least an order of magnitude. Out of the 10 experimentally reported values, 5 lie below 10 kPa, and the remaining 5 data points are in the range of 20 and–57 kPa.
3.3.2. Unconfined uncongested detonation
Figure 6 shows the overpressure estimates for unconfined detonations at 15 m using Equation 3 for which the only input required from the dispersion calculations is the mass of H2 between 12 %H2,vol and UFL (or an alternative reasonable criterion to estimate the mass of H2 that contributes to the blast loads). Again, the direct initiation of a detonation is unlikely in unconfined and uncongested nonuniform clouds; however, it is still useful to keep these estimates as an upper limit to the overpressure. The minimum and maximum values predicted for the range of conditions considered are 32.56 and 115 kPa, respectively.
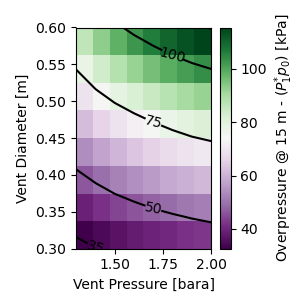
Figure 6
Heat map of estimated overpressure at 15 m computed using the unconfined uncongested detonation correlation (Equation 3).
Note the stark difference in overpressure estimates between the unconfined uncongested deflagrations and detonations correlations. There is clear room for improvement for the deflagration correlation to yield more realistic estimates, particularly given how sensitive the peak overpressure is to the visible flame velocity Vf, and the challenges in providing a sensible estimate for it from first principles in nonuniform, nonquiescent flammable clouds.
3.4. Discussion
While the conditions for which overpressure experimental data exists seem to lie mostly outside the parametric range considered herein, a way of verifying whether this is indeed the case is by computing the vent Reynolds number Re = ρUd/µ where ρ and U are the gas density and velocity at the vent exit plane, respectively, and µ is the dynamic viscosity of the gas. The range of Re is 2.63 < Re × 10–6 < 9.56 as seen in the heat map in Figure 7. The Re computed from the vent source pressure and diameter reported in Groethe et al. (2007), Daubech et al. (2015, 2025), Takeno et al. (2007), and Blanchetière et al. (2025) are Re × 10–6 = 1.87, 2.06, 3.74, 7.93, 9.63, 20.6, and 24.2. The conditions in Daubech et al. (2015, 2025) (p = 40 bar; d = 12 mm) yield Re × 10–6 = 3.74 with overpressures in the range of 6–20 kPa at 2 m. Groethe et al. (2007) (p = 24 bar; d = 42 mm) yield Re × 10–6 = 7.93 with overpressures in the range of 4 kPa at 7 m. The differences in the reported values stem from the mass of H2 released before the cloud was ignited.
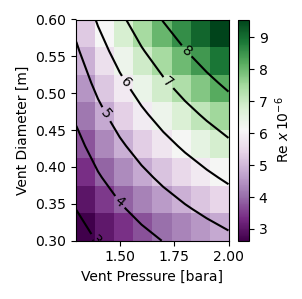
Figure 7
Reynolds number for the parametric space considered.
As mentioned above, one of the challenges in applying the methodology to realistic vent releases lies in the nonuniform, nonquiescent nature of the resulting flammable clouds. In the case of venting, the most plausible outcome upon delayed ignition of the release is for a flame to be initiated that subsequently accelerates consuming the cloud. The acceleration of the flame is responsible for the pressure buildup; hence, the visible flame velocity Vf is a crucial input to the deflagration correlation but difficult to estimate reliably. Note that Equation 2 is derived and validated for homogeneous quiescent clouds. Vf values are seldom reported in experimental campaigns; the work of Blanchetière et al. (2025), Daubech et al. (2015, 2025), Groethe et al. (2007), and Takeno et al. (2007) are exceptions to this rule.
Figure 8 (left) shows the Vf data plotted as a function of Re. A few extra points are added to the plot. Those reported by: (1) Pförtner and Schneider (1983) for quiescent hemispherical uniform clouds of size R = 10–14 m (stoichiometric H2-air; Re = 0) to anchor Vf at no-flow to sensible values; (2) Miller, Eastwood, and Thomas (2015) for horizontal jets at p = 60 bar issuing from tubes of d = 20.9 and 52.5 mm. Overpressures were reported at two different locations per condition (with values ranging between 3.9 and 43 kPa) and sufficient information was provided to estimate the amount of H2 released. The range of Vf that matched the experimentally reported values was iteratively computed using Equation 1. This allowed to increase the range of Vf = f(Re) and observe whether a reasonable trend emerged in combination with the experimental data.
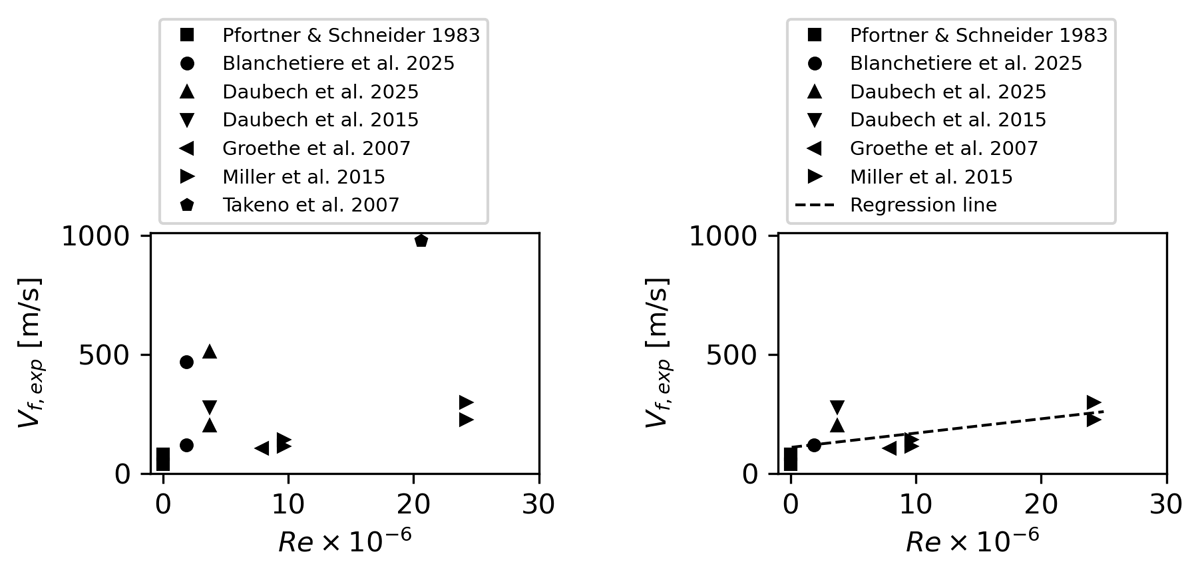
Figure 8
Measured visible flame velocity, Vf as a function of vent Reynolds number, Re. Left: complete dataset. Right: curated dataset. Dashed line is a least-squares regression line to the data points given by Vf = 6.0061Re + 110.0135.
In Figure 8 (right), a curated dataset is shown. Three points were considered as outliers: (1) that of Takeno et al. (2007) (p = 400 bar; d = 10 mm) who report an unusually high Vf (978 m/s) that is more in line with the expected vent exit velocities for the given conditions (1098 m/s); (2) the reported maximum from Daubech et al. (2025) (510 m/s) since it differs from the maximum value reported by the same lead author in 2015 (280 m/s) for the same release conditions (p = 40 bar; d = 12 mm); (3) the reported maximum by Blanchetière et al. (2025). A least-squares regression line is fitted to the remaining data points given by Vf = 6.0061Re + 110.0135. With this, an improved Vf estimate for H2 releases can be obtained.
Using the expression Vf = f(Re), unconfined and uncongested deflagration overpressures are recomputed (see Figure 9). The overpressures at 15 m now range between 10 and 22 kPa for the parametric space considered. The values are significantly higher than the initial predictions shown in Figure 5 using Equation 2 to estimate Vf, but much lower than the unconfined uncongested detonation predictions, and more in line with the magnitudes of the experimental values reported in literature.
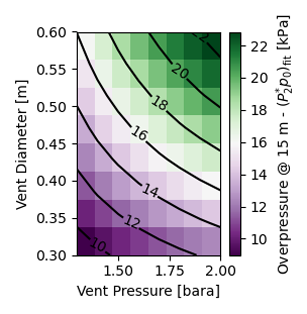
Figure 9
Unconfined uncongested deflagration results recomputed using the Vf = f(Re) correlation derived from the experimental data.
4. Conclusion
A methodology for evaluating overpressures from unconfined and uncongested H2 releases was developed, building on the approach introduced in Melguizo-Gavilanes, Pekalski, and Crerand (2024), and revisiting the work of Dorofeev (2007). The study proposed a straightforward method for estimating the amount of H2 in flammable clouds that contributes to blast loads, using dispersion calculations performed with standard consequence modeling tools such as FRED and PHAST. A comparison of predicted overpressures with published experimental data revealed significant discrepancies: the unconfined and uncongested deflagration correlation tends to underpredict overpressures, whereas the detonation correlation overpredicts them. Since unconfined and uncongested, nonuniform, flammable clouds are unlikely to detonate directly, the focus was on refining the deflagration correlation to better align with experimental observations. The analysis highlighted that overpressure predictions were highly sensitive to the visible flame speed (Vf) used in the calculations—more so than to the mass of H2 at a fixed Vf. However, estimating Vf from first principles is challenging due to the complex flow conditions typical of vent releases, such as nonuniform concentrations and background turbulence. A potential scaling relationship was identified in the data, showing that Vf could be expressed as a function of the vent Reynolds number (Vf = f(Re)). Incorporating this scaling into the deflagration correlation significantly improved the alignment of overpressure predictions with the values reported in the literature.
This work represents a step forward in developing a phenomenologically accurate and reliable correlation for vent overpressure predictions. However, several areas merit further exploration to advance and validate this research: (1) conducting additional large-scale experiments that incorporate vertical releases and account for actual or planned vent designs; (2) evaluating the updated methodology using data from the recent experimental campaigns conducted by Air Products in collaboration with BakerRisk, which focused on vertical releases (presented at GCPS by Shen et al. in April 2025); and (3) exploring the potential to unify low- and high-pressure release scenarios by analyzing overpressure data in vent Reynolds number and mass of H2 space.
Notes
Acknowledgements
The authors would like to acknowledge the Erasmus HySET consortium (Project Reference: 101082651) for funding and support of the MSc project that is partially presented in this article.
Competing Interests
The authors have no competing interests to declare.