
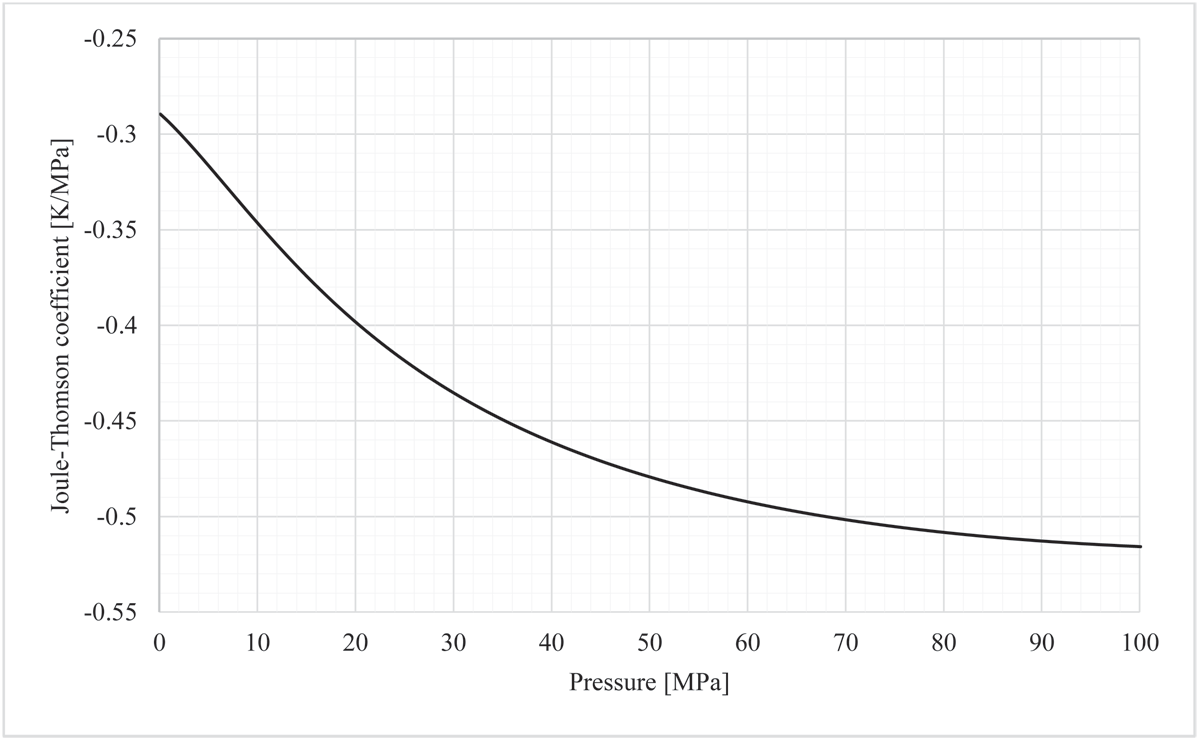
Figure 1
The JT coefficient for hydrogen as a function of pressure at temperature 20°C (Lemmon et al., 2018).
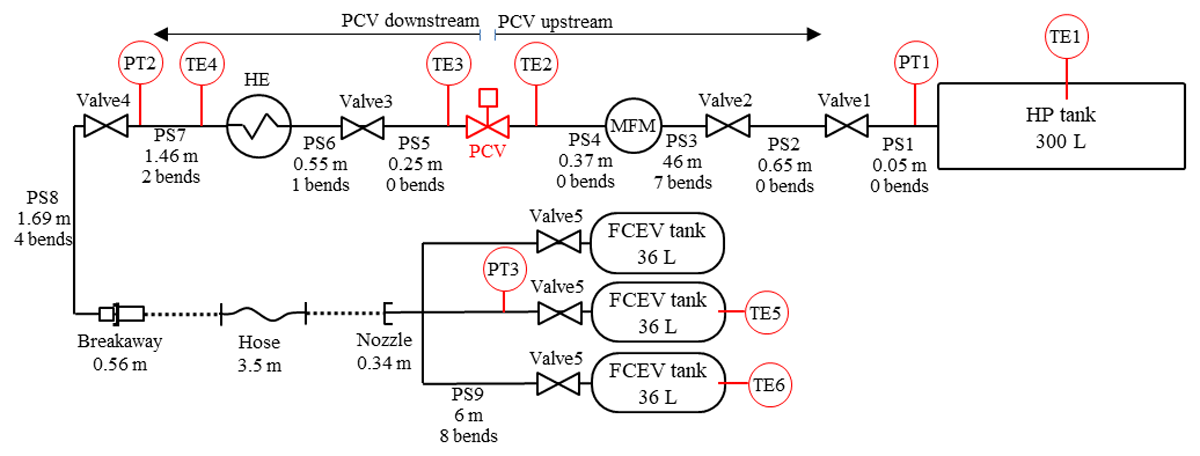
Figure 2
The PID diagram of the NREL experimental HRS.
Table 1
Initial experimental conditions of NREL Test No. 1 (Kuroki et al., 2021).
| INITIAL (EXCEPT P TANK) AND AMBIENT TEMPERATURE | HP TANK INITIAL TEMPERATURE | PCV UPSTREAMINITIAL PRESSURE | PCV DOWNSTREAM INITIAL PRESSURE | APRR |
|---|---|---|---|---|
| 296 K | 290.5 K | 88 MPa | 6 MPa | 19.8 MPa/min |
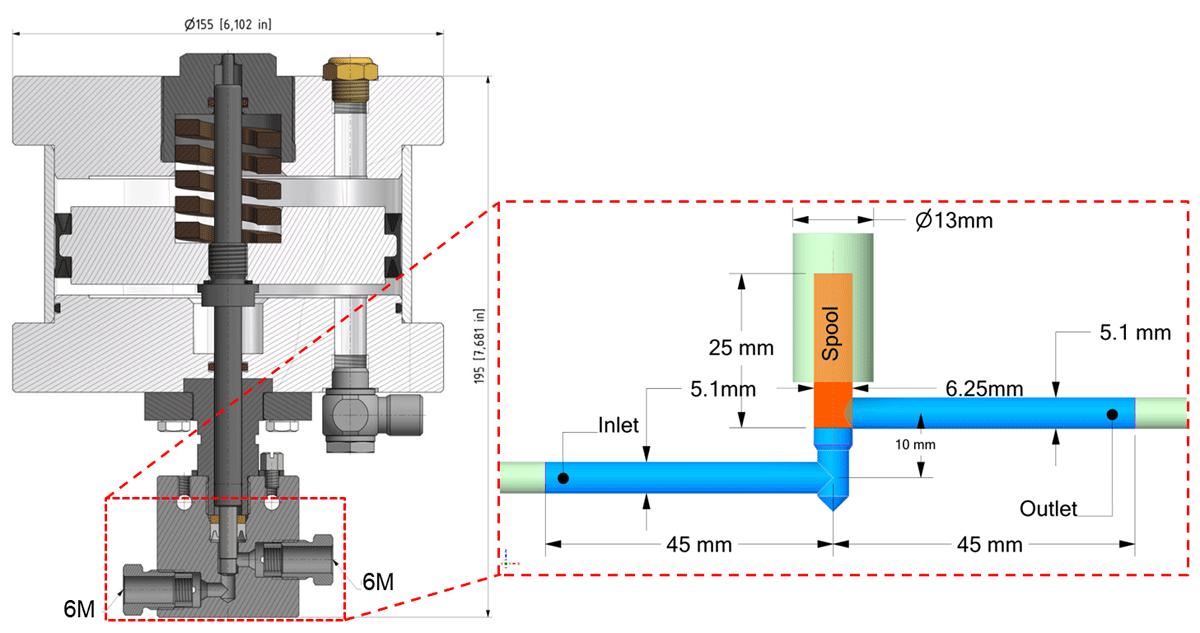
Figure 3
The cross-section of the air-actuated hydrogen valve (Maximator Gmbh, 2023) (left) and the enlarged computational model of the valve’s internal geometry (right).
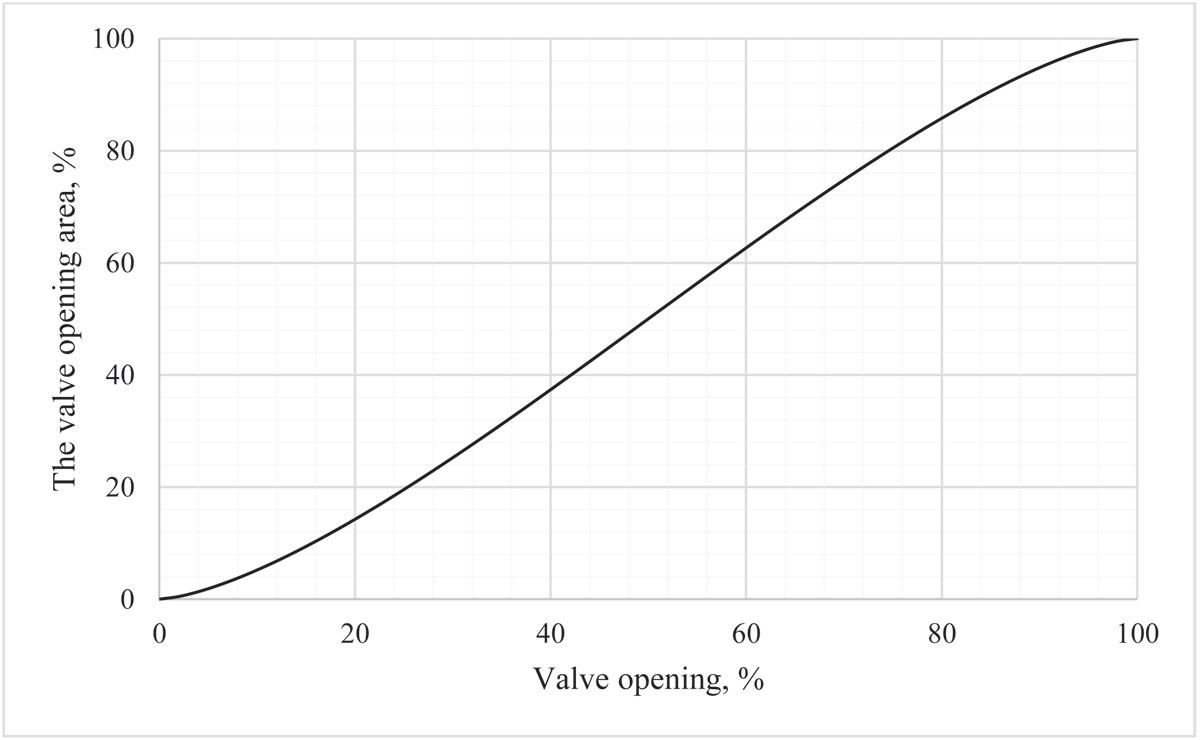
Figure 4
Flow area versus valve opening percentage for the PCV.
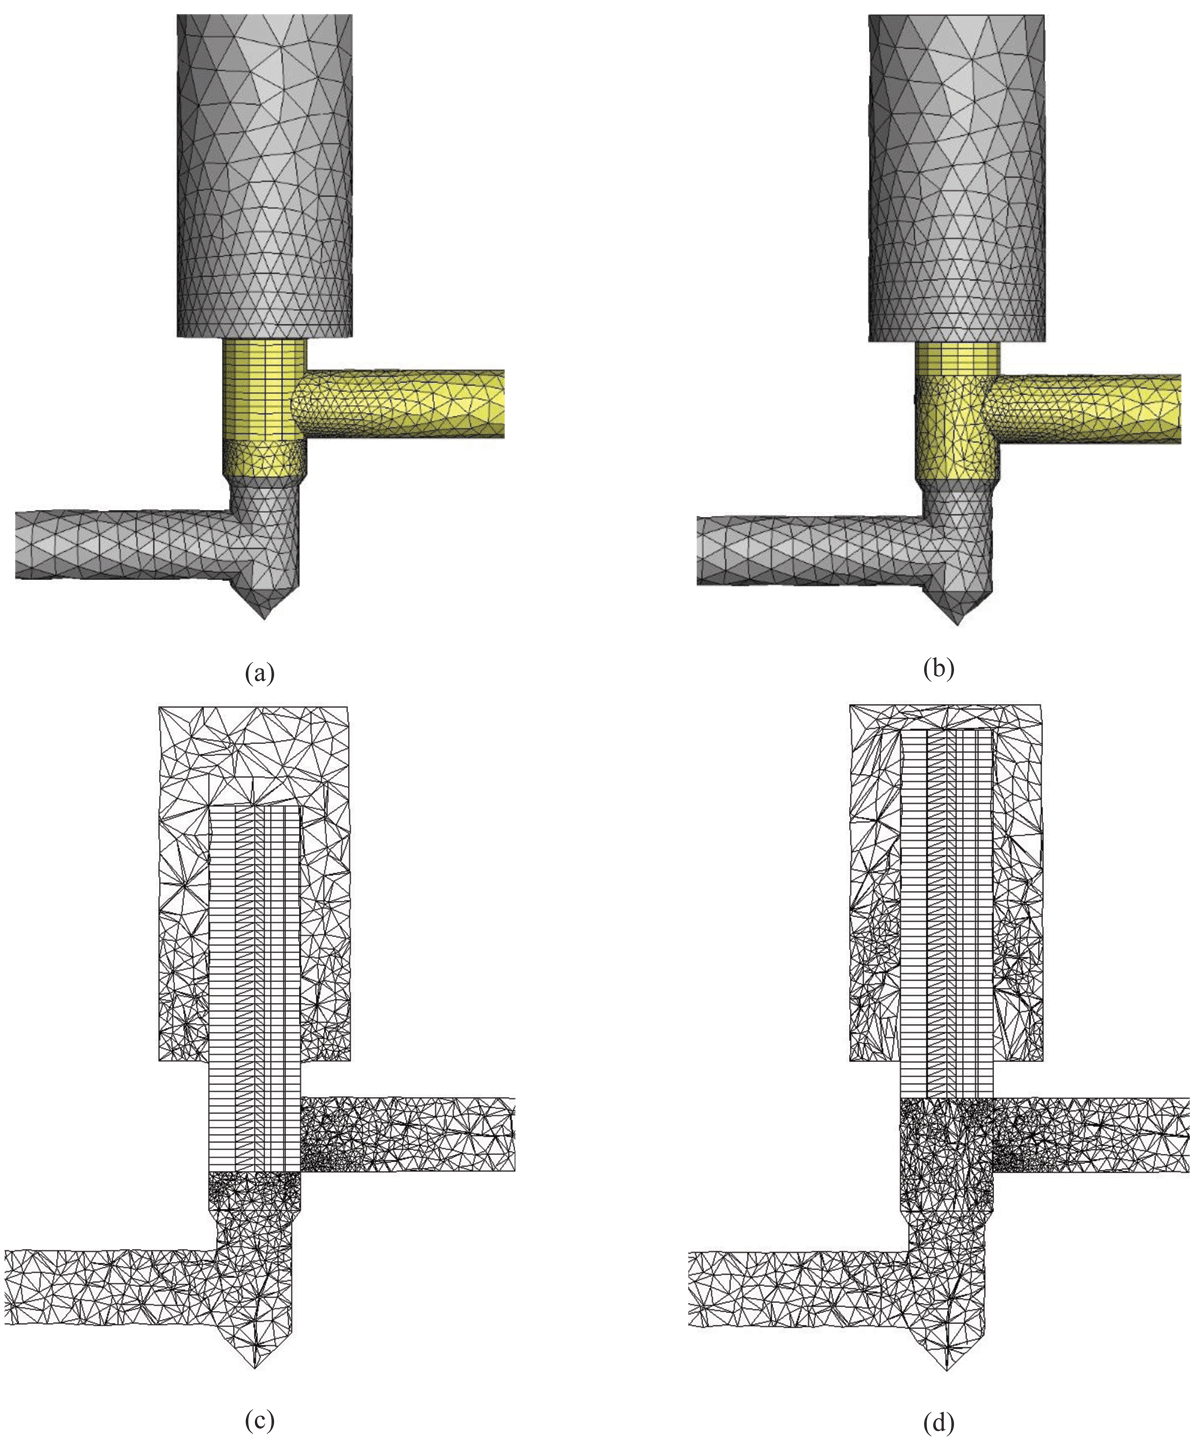
Figure 5
The PCV boundary mesh in the fully closed (a) and fully open (b) states, and the PCV cross-section mesh in the fully closed (c) and fully open (d) states.
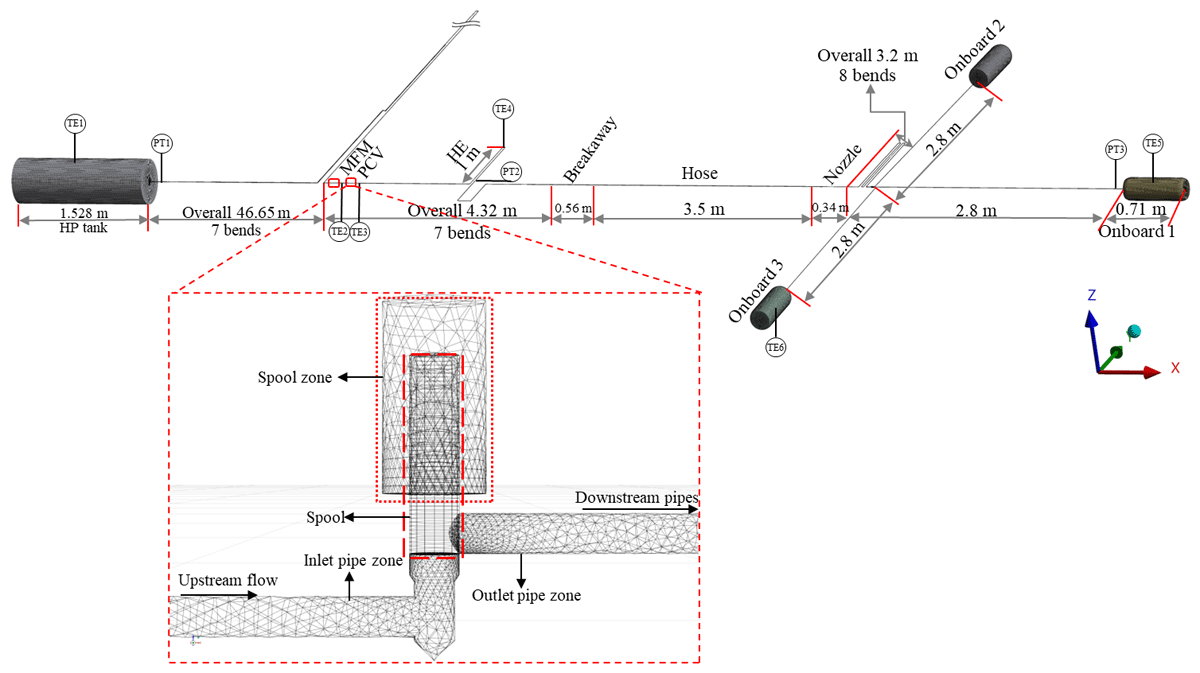
Figure 6
Computational domain comprising the PCV and the other HRS components in the NREL refuelling facility (top), and the three-dimensional zoomed-in area of the PCV with moving spool (bottom).
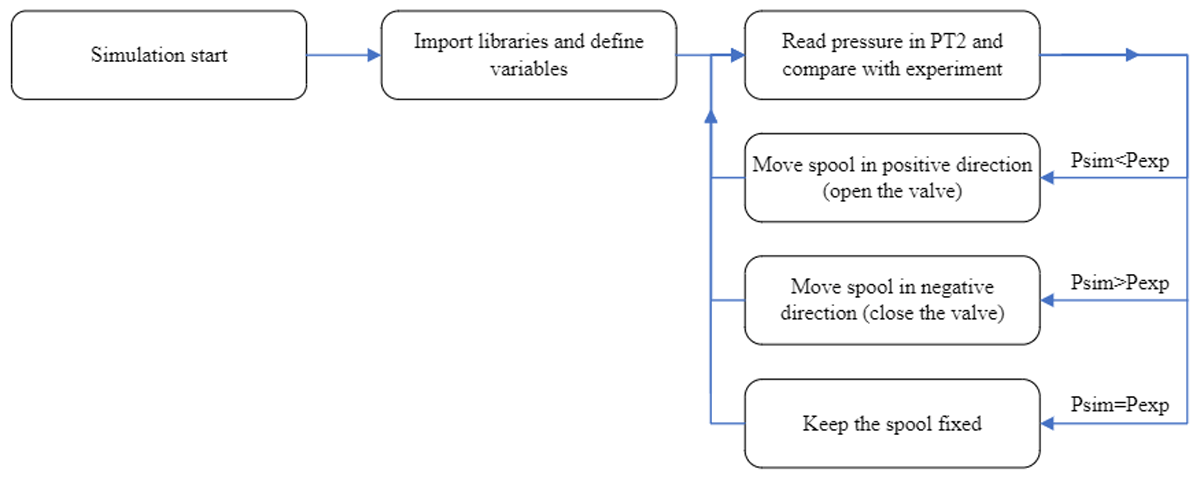
Figure 7
The block scheme of the UDF code to control the spool movement.
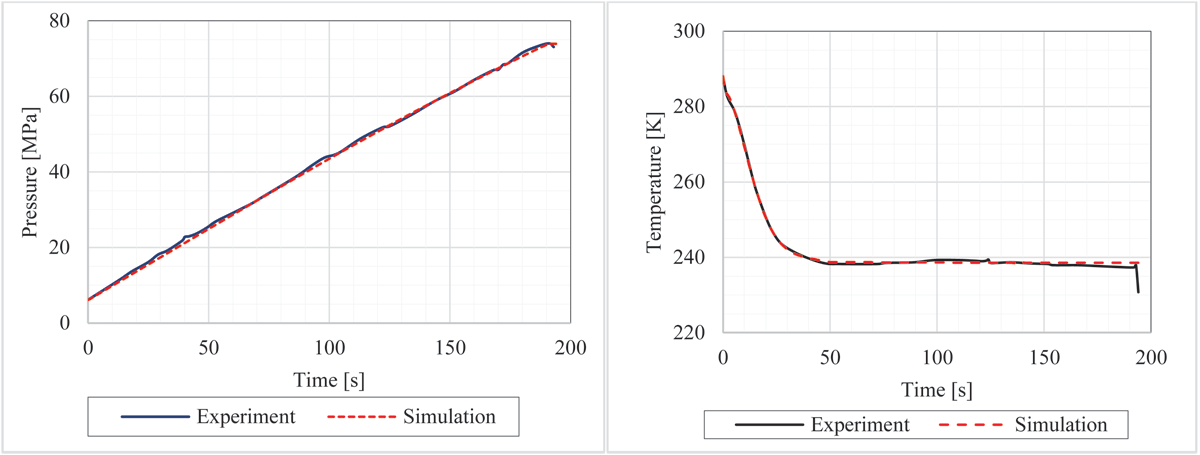
Figure 8
Pressure in PT2 located 2.5 m after the PCV (left); hydrogen temperature at the HE exit (right).
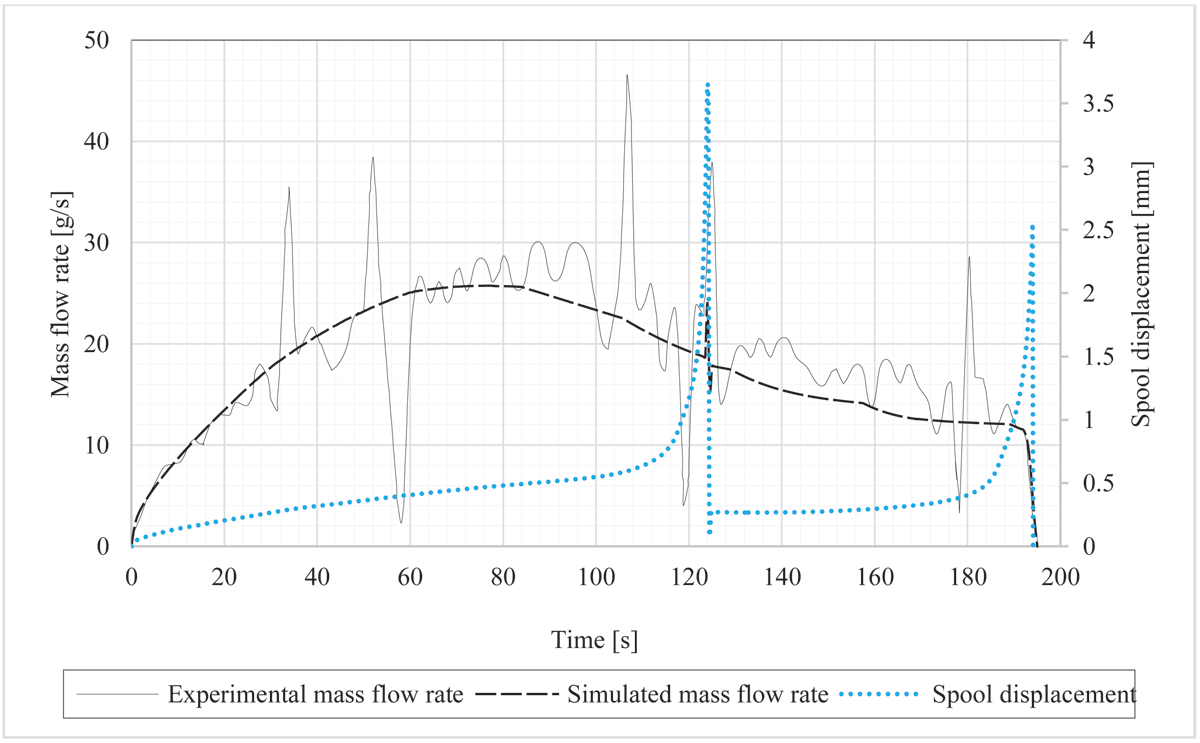
Figure 9
Experimentally measured and simulated mass flow rate along with the PCV spool displacement.
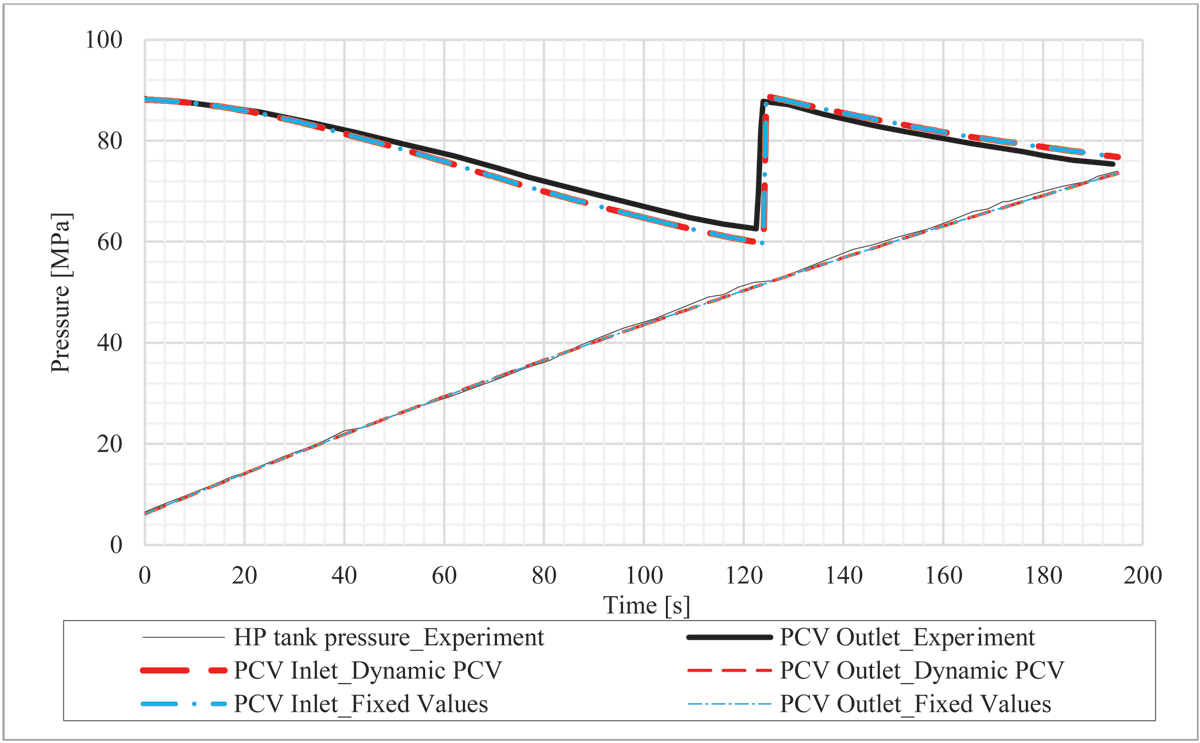
Figure 10
Experimental and simulated (dynamic mesh and fixed values methods) pressure dynamics upstream and downstream of the PCV. Note: experimental pressure upstream is measured at the HP tank exit (47 m from the PCV).
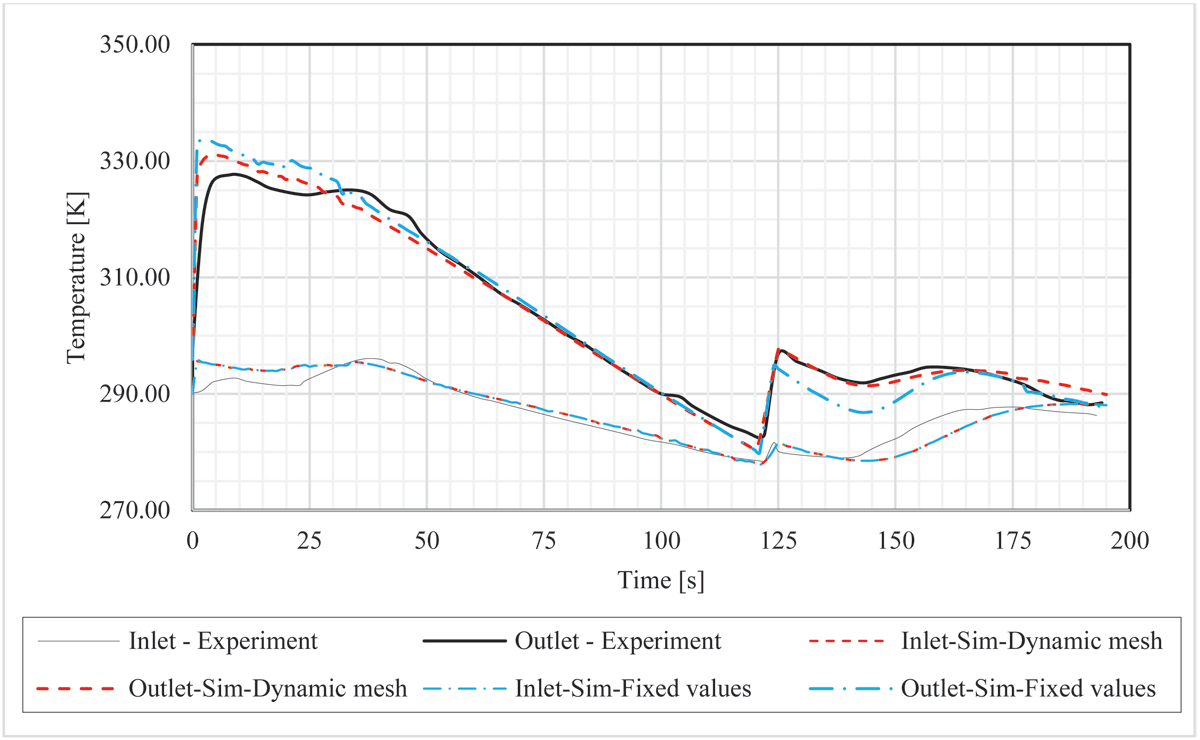
Figure 11
Experimental and simulated (dynamic mesh and fixed values methods) temperature dynamics at the inlet (TE2) and outlet (TE3) of the PCV.
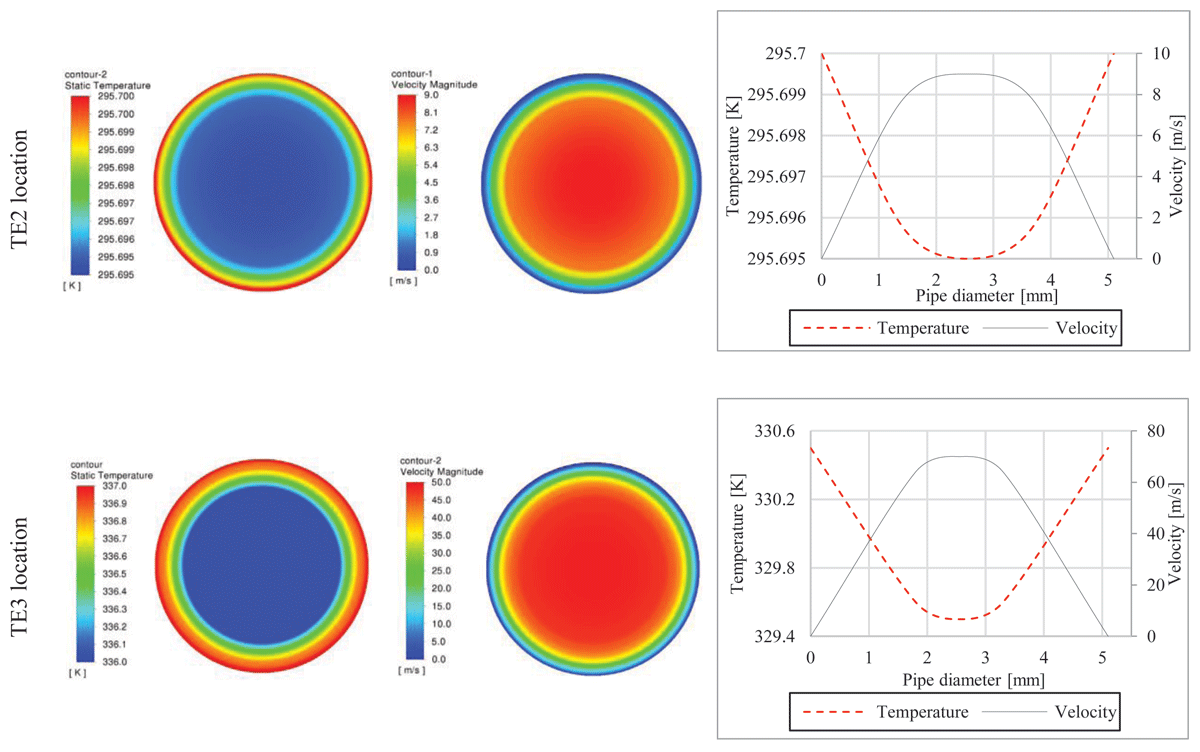
Figure 12
Temperature (top, left), velocity distribution (top, centre) across the pipe cross-section, temperature and velocity profiles across the pipe cross-section at the PCV inlet (TE2 location) (top, right); temperature (bottom, left), velocity distribution (bottom, centre) across the pipe cross-section, and temperature and velocity profiles across the pipe cross-section at the PCV outlet (TE3 location) (bottom, right).
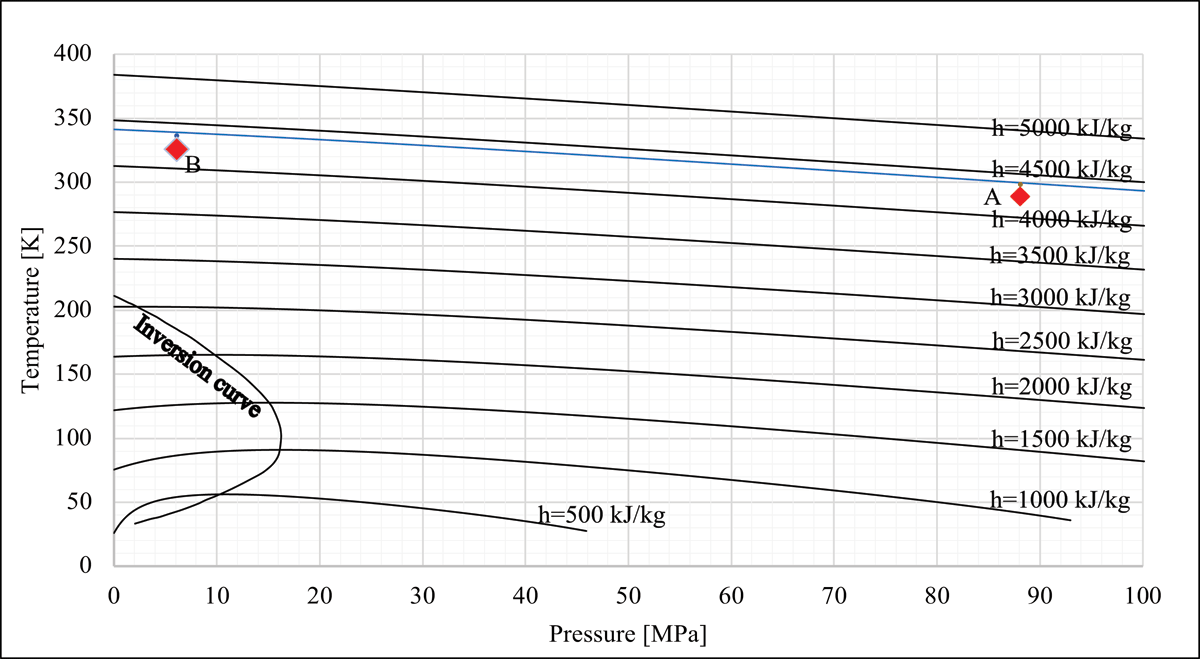
Figure 13
Isenthalpic curves (solid lines) with their corresponding enthalpies (h) and inversion curve (dashed line) for hydrogen.
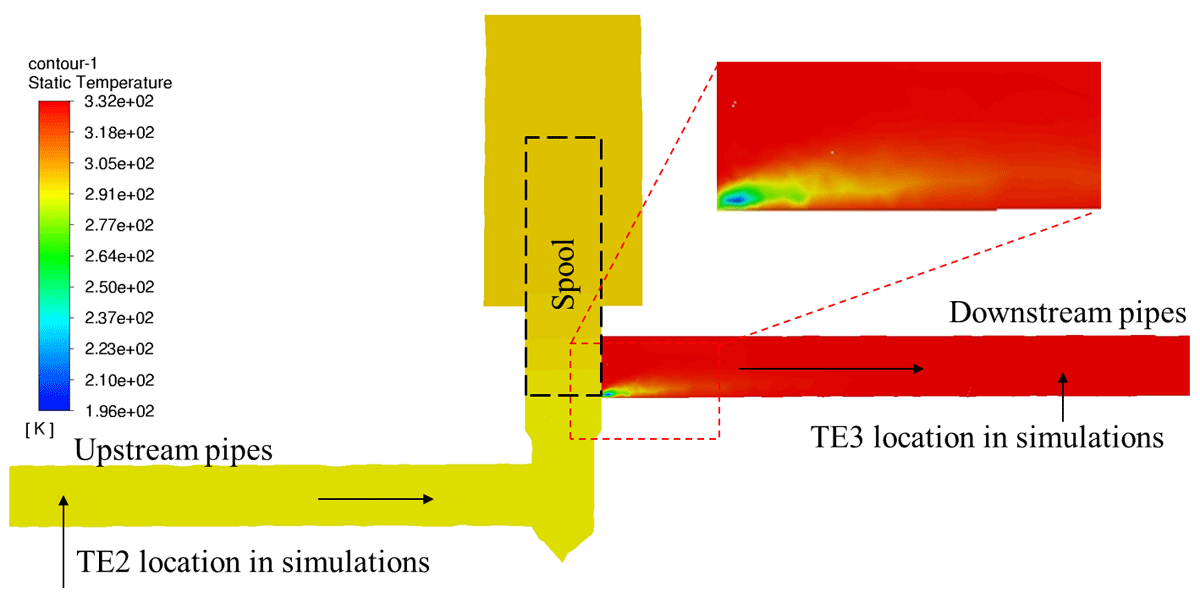
Figure 14
Hydrogen temperature in the PCV cross-section at the initial stage of the fuelling process at t = 6 s.
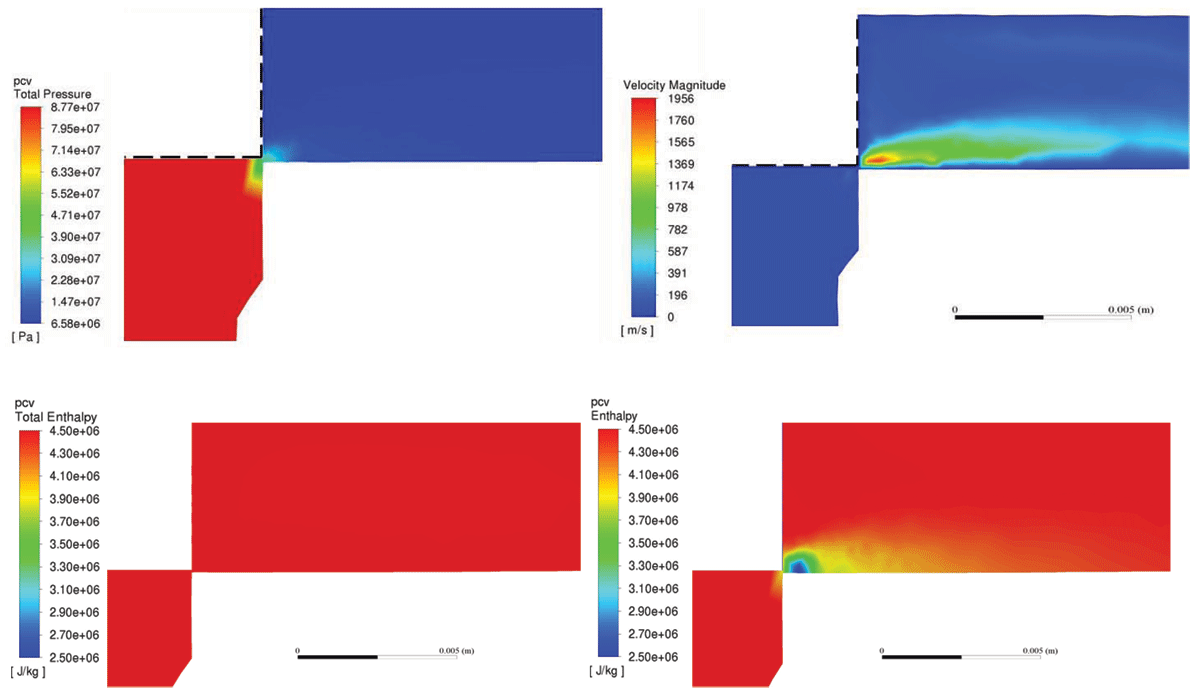
Figure 15
Pressure distribution (top, left), velocity field (top, right), total enthalpy H (bottom, left) and enthalpy h (bottom, right) distribution in the PCV cross-section at t = 6 s.
Table 2
Comparison of total enthalpy at t = 6 seconds at the inlet and outlet of PCV (TE2 and TE3 location).
| CASE | TOTAL ENTHALPY AT THE INLET (TE2) [J/kg] | TOTAL ENTHALPY AT THE OUTLET (TE3) [J/kg] | DIFFERENCE (%) | TEMPERATURE AT TE3 [K] |
|---|---|---|---|---|
| Ideal case, Isenthalpic expansion (using NIST data) | 4,473,342 | 4,473,342 | 0% | 330.5 |
| Slip wall conditions, No heat transfer | 4,473,342 | 4,471,888 | –0.033% | 330.9 |
| Non-slip conditions, No heat transfer | 4,473,342 | 4,471,654 | –0.038% | 331.1 |
| Non-slip conditions, With heat transfer | 4,473,342 | 4,449,820 | –0.525% | 329.5 |
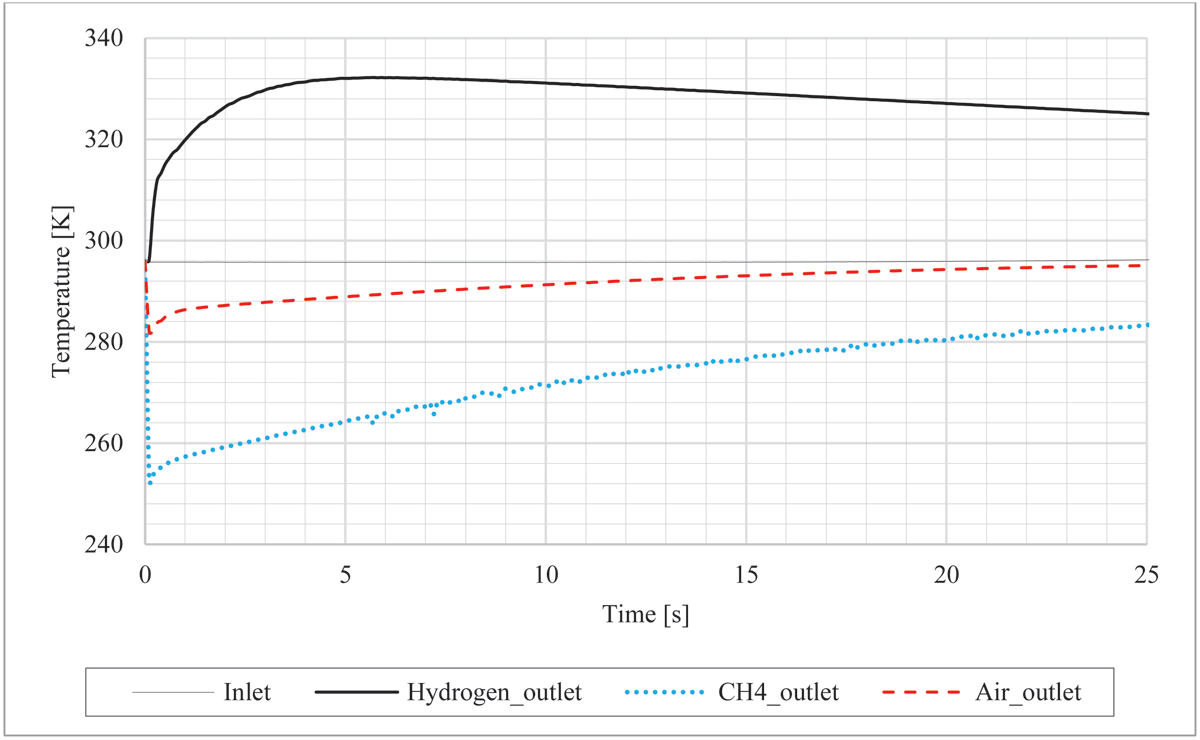
Figure 16
The joint effect of the heat transfer and the JT phenomenon on the PCV outlet temperature for the same HRS and initial conditions for three gases: hydrogen, air and methane.
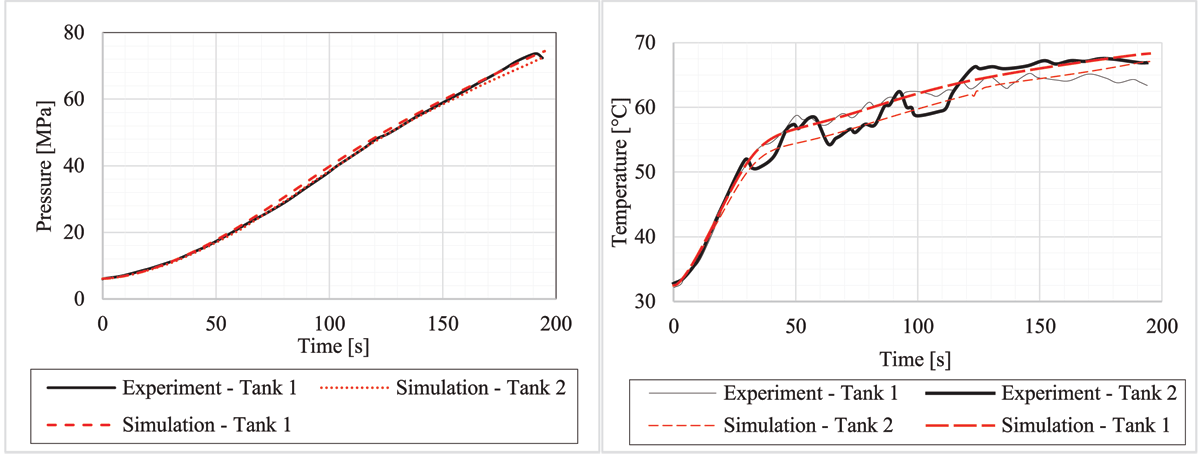
Figure 17
Experimental and simulated temperatures (left) and pressures (right) in two of three onboard tanks.