
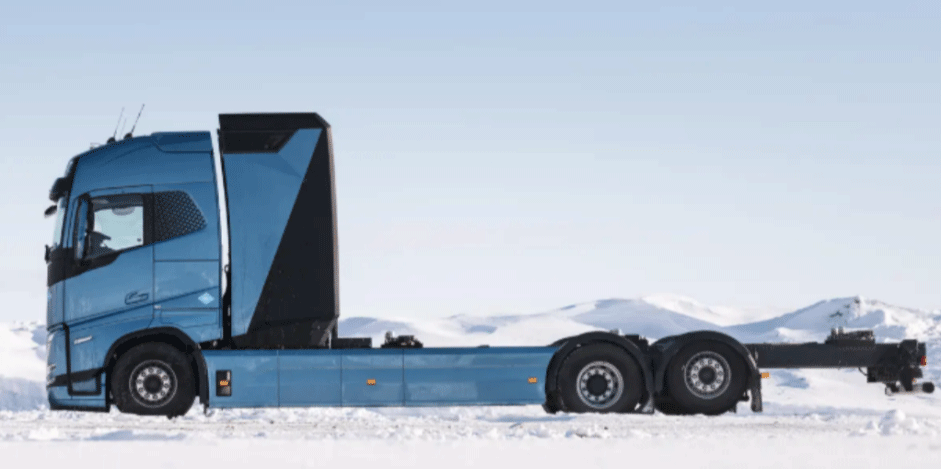
Figure 1
Current design of the fuel cell truck being developed by Volvo Trucks AB.
Photo. Volvo Trucks AB.
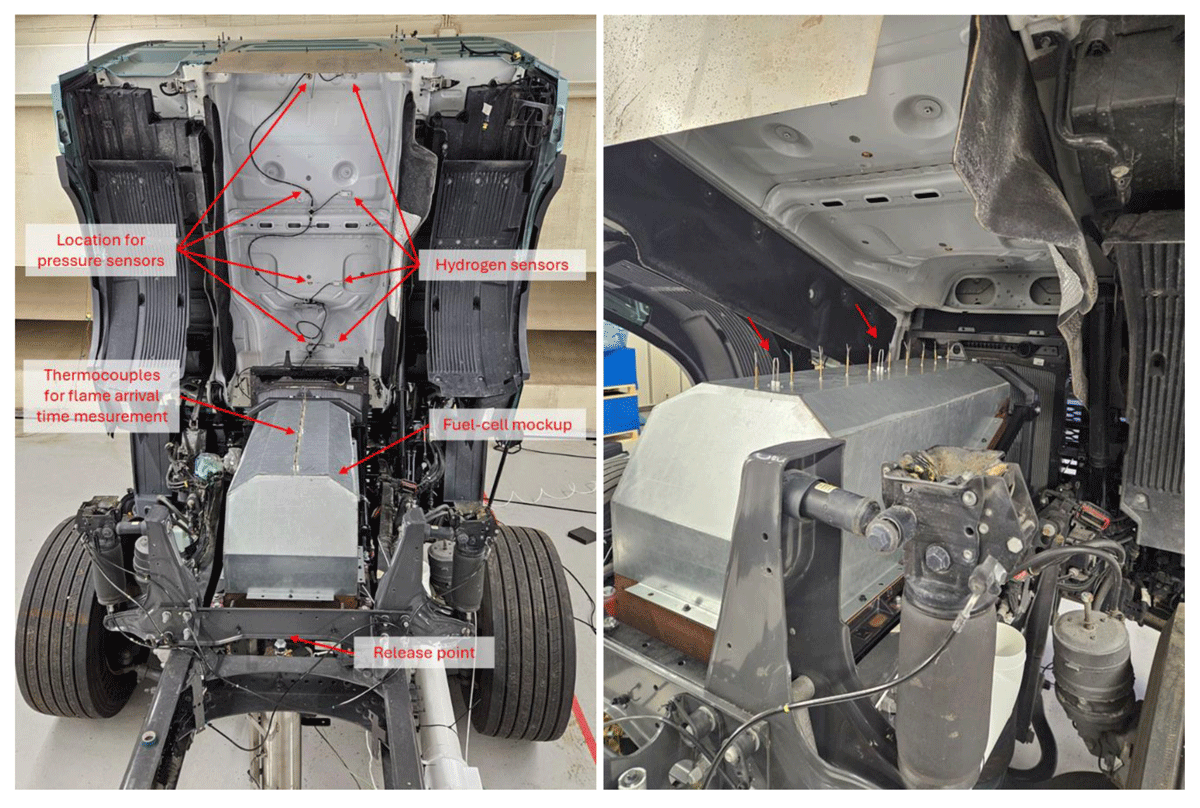
Figure 2
Picture of the experimental setup with the cab fully or partly open.
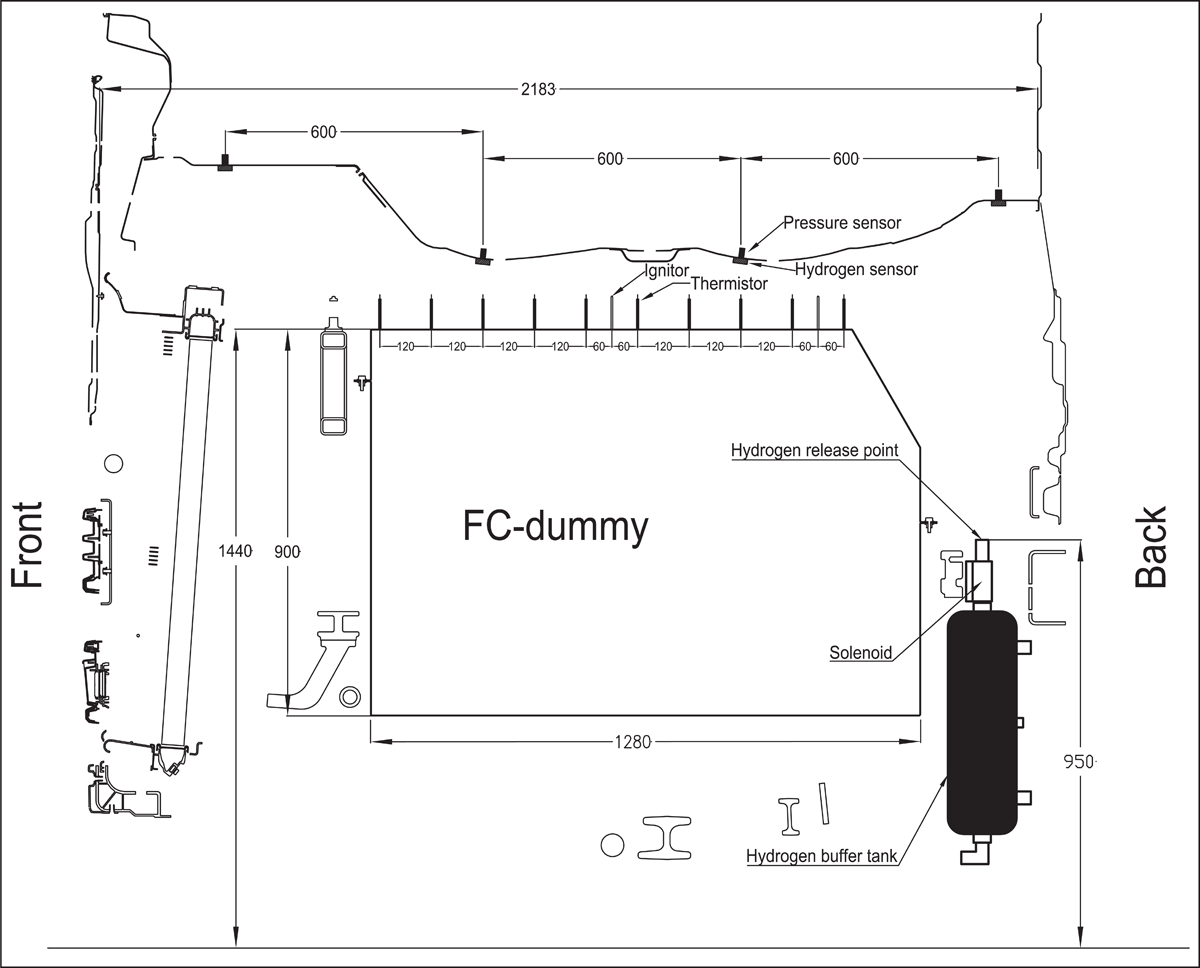
Figure 3
Section along the center of the FC-compartment.
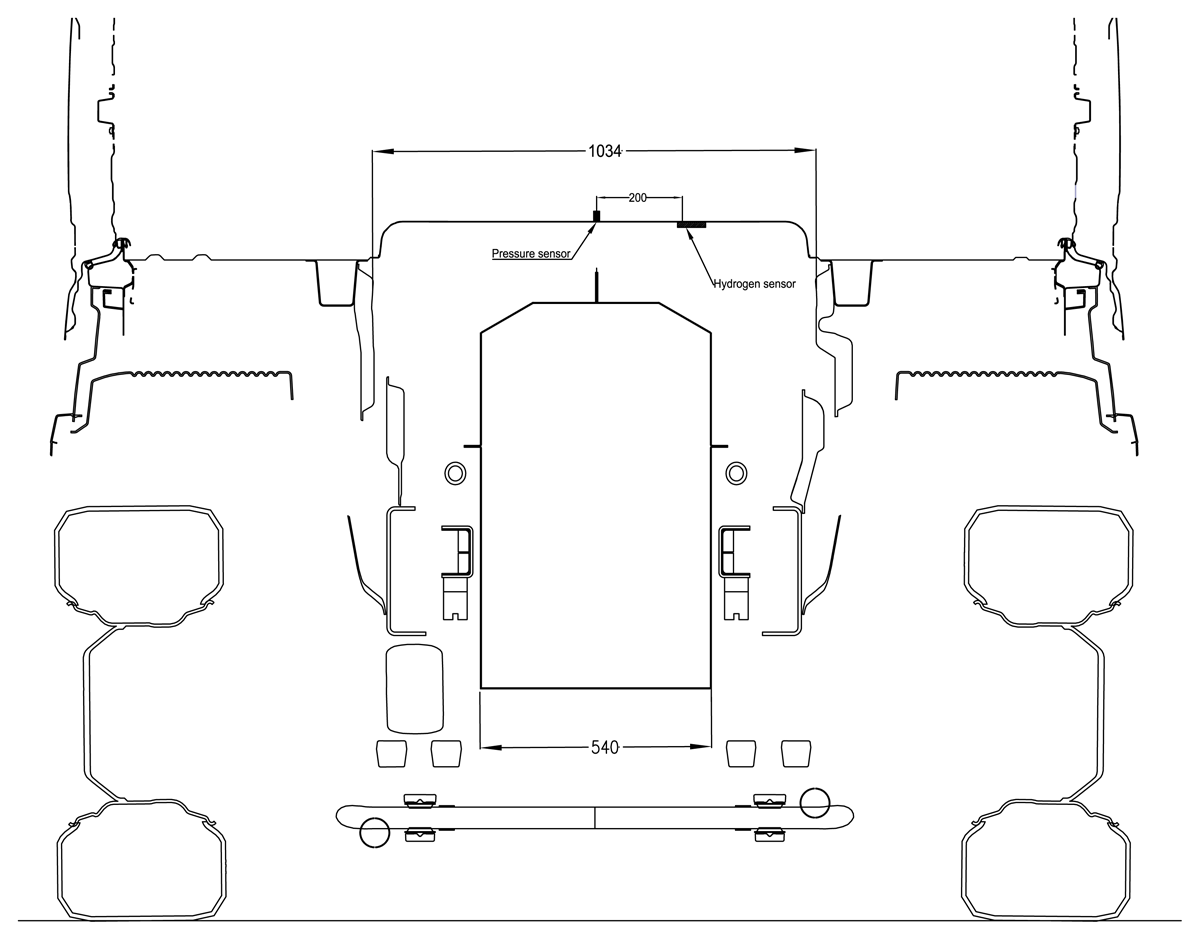
Figure 4
Section across the center of the FC-compartment.
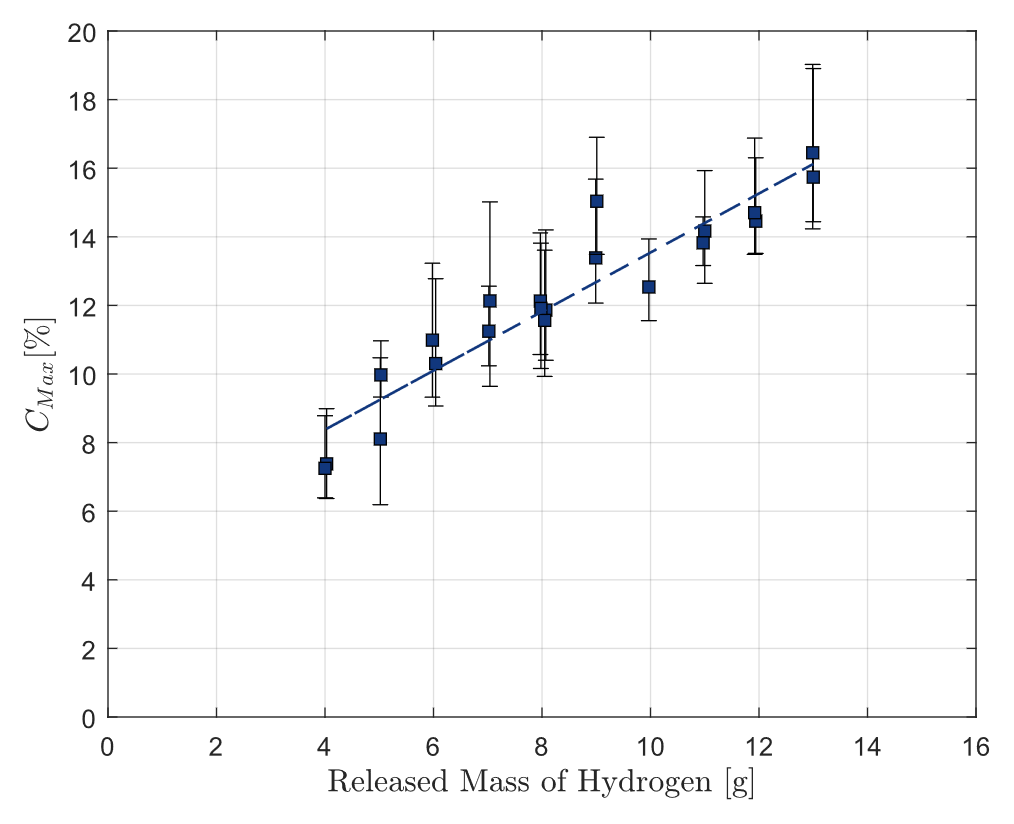
Figure 5
Maximum average concentration (Cmax) in the engine compartment vs mass of released hydrogen. The bars indicate the minimum and maximum hydrogen concentration among the sensors when the average value reached its peak value.
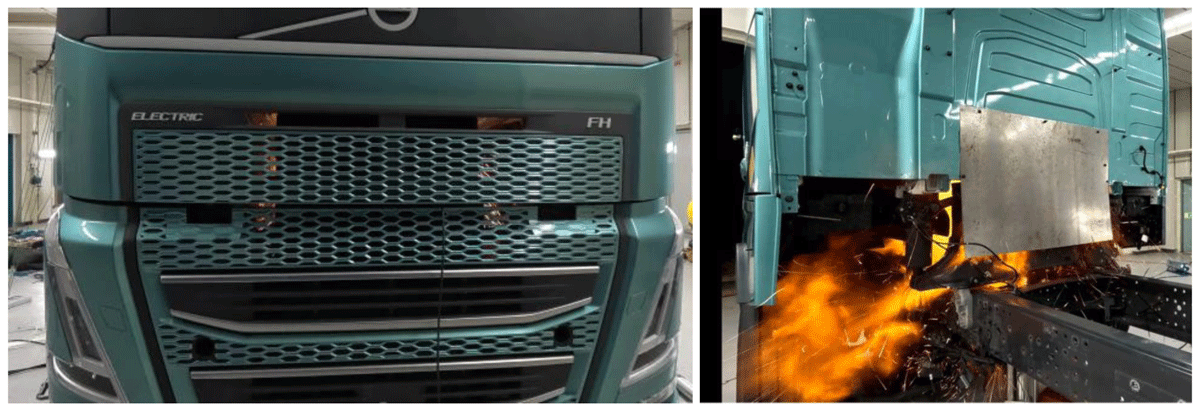
Figure 6
Frames with explosion extracted from film with 13 g released H2.

Figure 7
Unfiltered pressure-time-history for a release of 11.0 g H2.
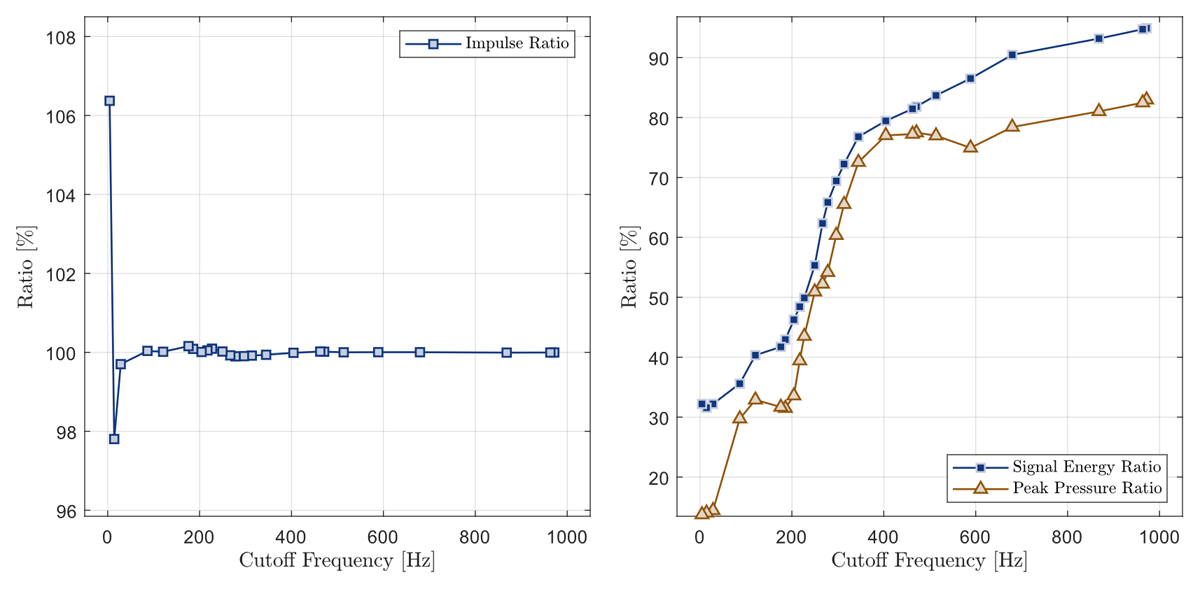
Figure 8
Dependence of impulse, peak pressure and signal energy to low-pass filter cutoff value for a release of 11.0 g H2.
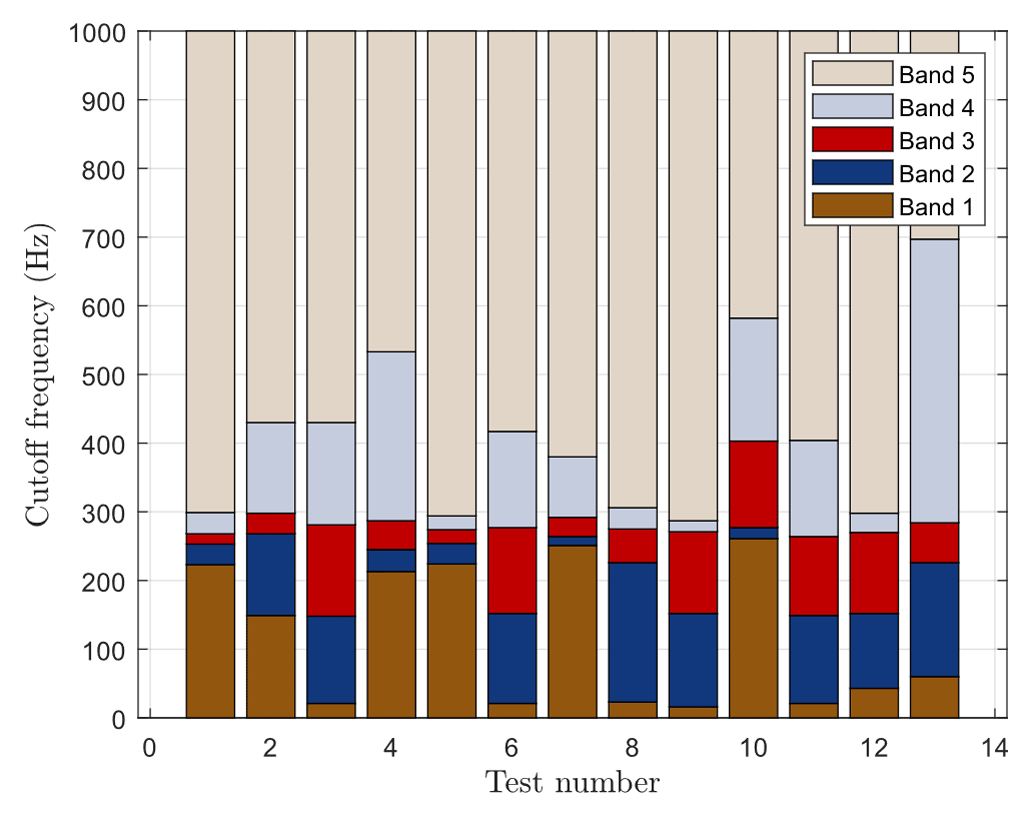
Figure 9
Bar chart indicating the division of the signal into five distinct frequency bands using the Empirical Wavelet Transform method. The figure is cut at 1000 Hz.
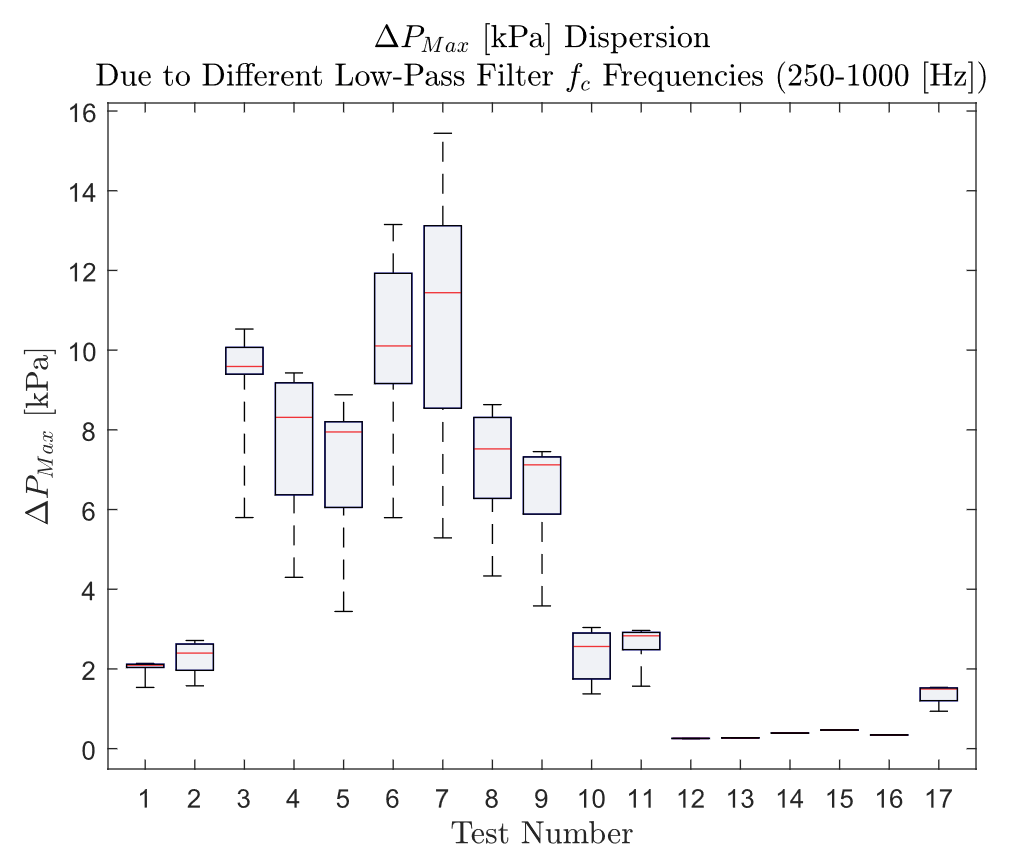
Figure 10
Measured peak-pressure during the experiments depending on the cutoff frequency of the low-pass filter.
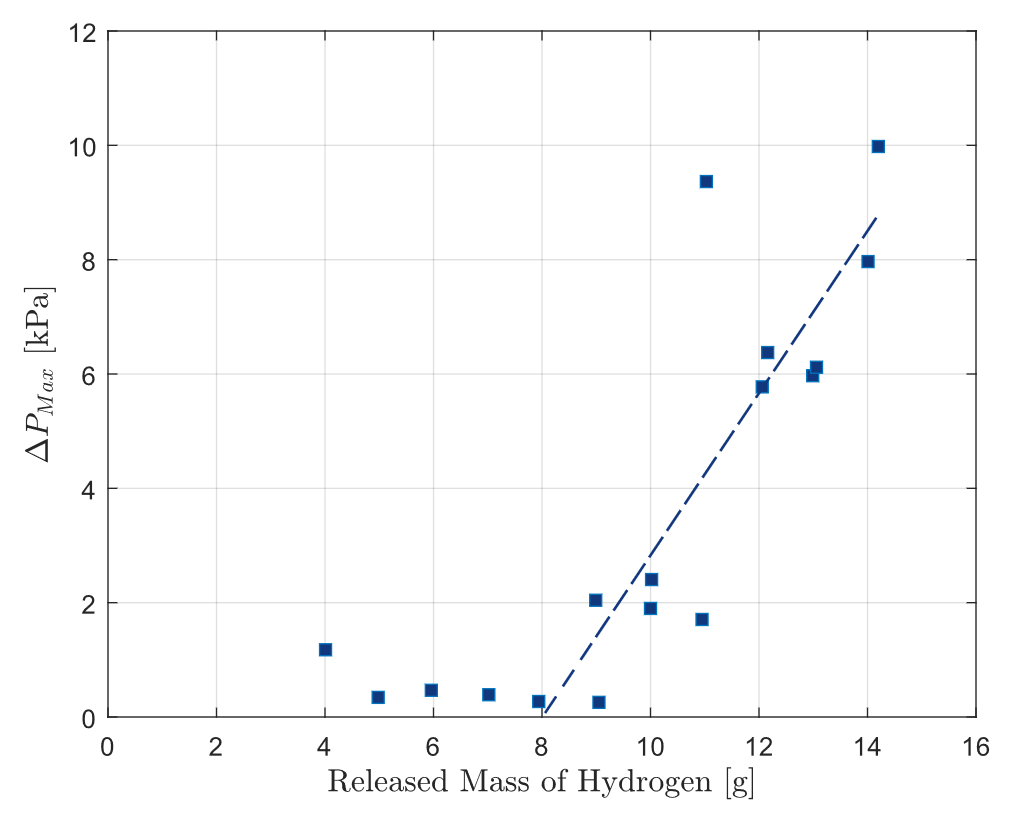
Figure 11
Peak filtered overpressure as a function of released mass of hydrogen. Linear regression performed for released mass above 8 g.
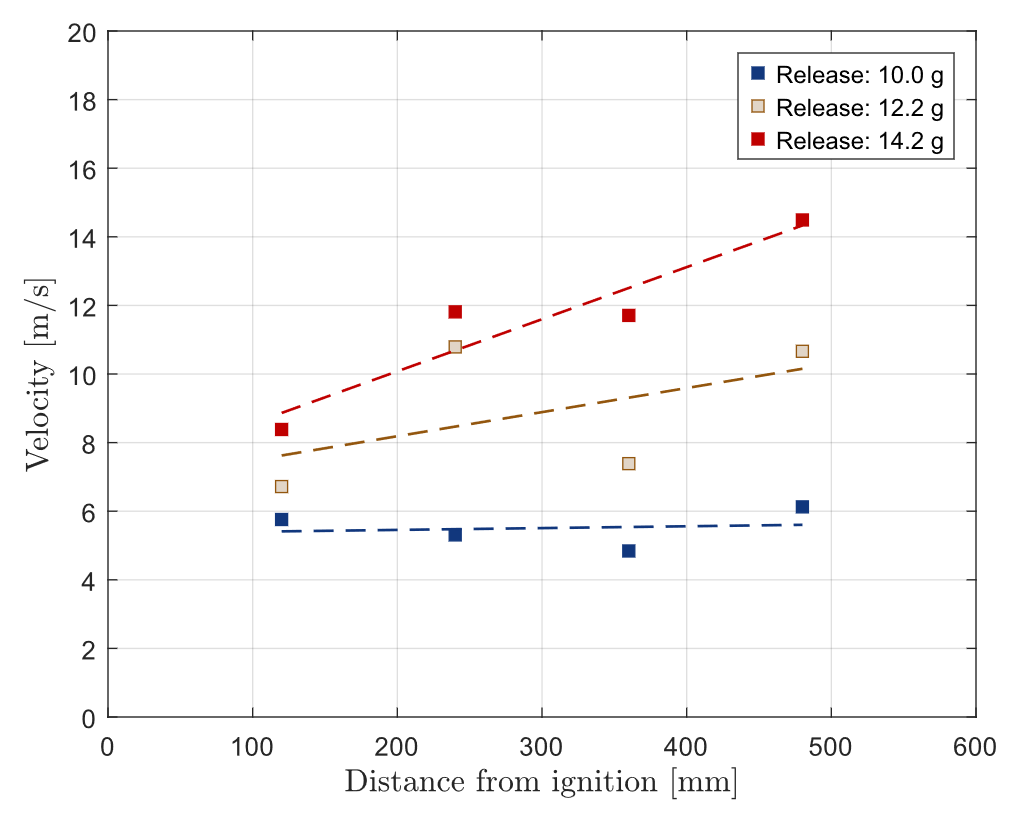
Figure 12
Flame speed as a function of distance from ignition point and released mass.