
1. Introduction
Due to the high energy need for long-haul heavy transport, battery electrification is challenging since the weight of batteries scales essentially linearly with energy content making the trucks too heavy for many roads (or permitting too little load to be carried). Therefore, hydrogen-based solutions are seen as a potential path toward decarbonization of trucks based on either fuel cells (FCEV) or internal combustion engines (ICE). Because of this, Volvo Trucks AB and others are currently actively developing hydrogen-based solutions for their trucks. Figure 1 shows the current proposed design of a FCEV-truck from Volvo.
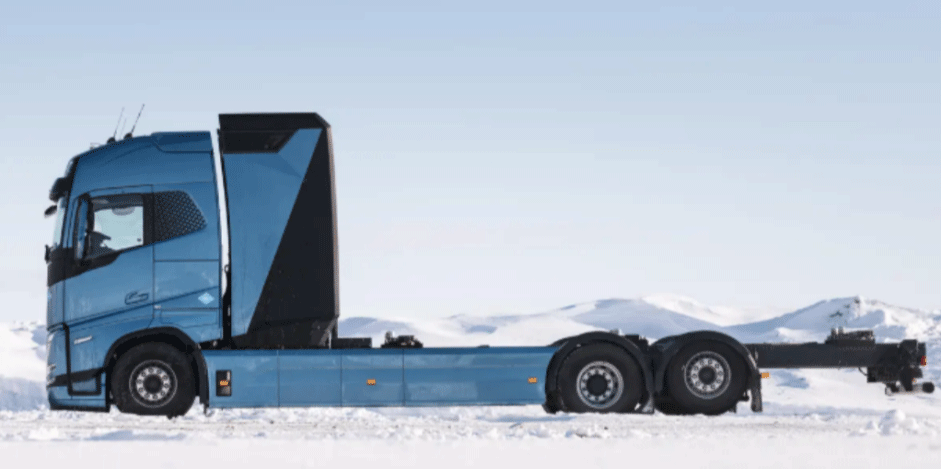
Figure 1
Current design of the fuel cell truck being developed by Volvo Trucks AB.
Photo. Volvo Trucks AB.
As the proportion of hydrogen-powered trucks in the fleet increases, the likelihood of these vehicles being involved in traffic accidents also rises. In the safety assessment for such scenario, conducted by Volvo Trucks AB, a series of crash simulations were performed based on predefined crash scenarios. The results indicated that, in certain scenarios, the hydrogen supply and recirculation pipework could be damaged, inducing leaks in the systems. Although the hydrogen supply from the tanks is rapidly shut off by airbag sensors and quick-closing valves in accordance with UN/ECE R134, the hydrogen remaining in the pipework and recirculation can still leak into the semi-enclosed space where the fuel cell is situated. Given the potential presence of ignition sources in a crash scenario, the risk of ignition of the released hydrogen cannot be ruled out.
Few experimental studies on similar setups were found in the literature. Maeda et al. (2007) performed experiments on release and ignition in the engine compartment of a passenger car. The releases were continuous (600 s) and the peak concentration was around 18% for 1000 NL/min release. The ignition of this release caused damage to the engine hood. No overpressure was measured in the engine compartment and the measurements performed at 1 m distance from the car gave only marginal (~1 kPa) readings.
In the scenario presented in this paper, the actual expected released mass is only a few grams of hydrogen, but, following the high safety standards of Volvo, it was decided to perform a series of experiments relevant for this situation. The tests were performed on a modern truck provided by Volvo fitted with a mockup representing the fuel cell located in the engine compartment. The expected release from calculations by Volvo was evaluated and complemented with other similar releases (4–14 g) to investigate the sensitivity of the results on the released mass.
The results of those tests are presented in this paper consisting of both hydrogen concentrations, overpressures and flame speeds.
2. Method
In this section, the experimental setup is first presented, followed by model specifications of equipment and the experimental matrix.
2.1 Experimental setup
The setup consisted of an actual modern truck (Volvo FH 4 × 2) provided by Volvo Trucks AB. Instead of the normal engine, a mockup representing a fuel cell was built and fitted with instrumentation for flame arrival measurements and two ignition points. A steel plate was also mounted on the back of the cab to simulate a probable sealing in this area in the final design (e.g. a noise damper).
The hydrogen was released just behind the fuel cell since this was found to be one of the most significant leak positions from the crash simulations. The simulations indicated a very short release duration (well below 100 ms), and to mimic this as closely as possible, a quick opening valve (60 ms) and one or two release points (each with 22 mm diameter) were chosen. One release point was used for tests up to 8 g of released hydrogen while two release points were employed above that value. To also maintain a relevant pressure range for a fuel cell, the volume varied (9.2 l for tests up to 8 g and 14.7 l for the tests above). The release point(s) were centered across the truck and positioned 950 mm above ground.
The setup with the cab fully or partially open is shown in Figure 2. When the cab was closed, the air gap created between the simulated fuel cell and the top of the engine compartment was 160–190 mm. On the sides of the engine compartment, sound dampers extending 450 mm from the top of the compartment are found and, in the front, the release was hindered by the front grill of the truck. Downwards, the compartment is fully open around the fuel cell. The engine compartment is approximately 2.2 meters long and 1.0 meters wide. Further details on the compartment, with relevant measurements, can be found in Figures 3 and 4.
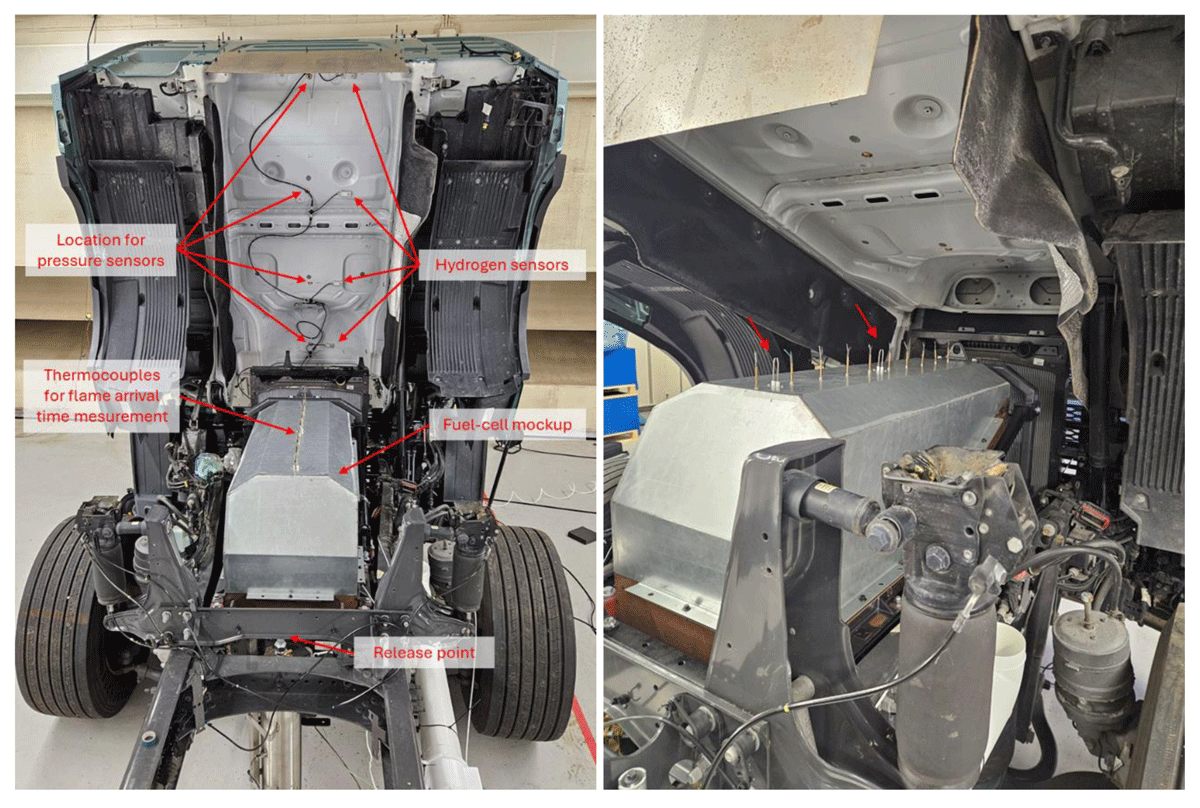
Figure 2
Picture of the experimental setup with the cab fully or partly open.
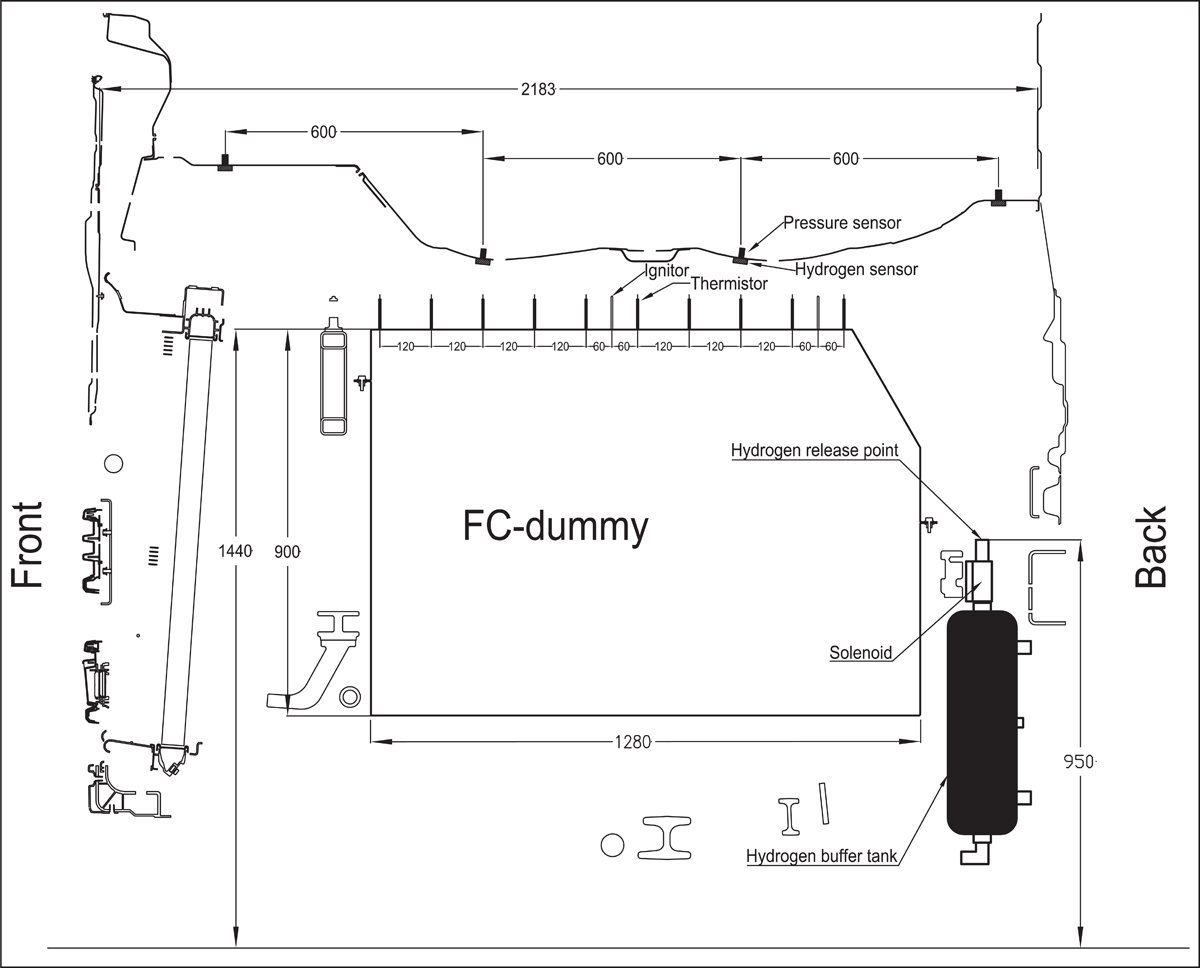
Figure 3
Section along the center of the FC-compartment.
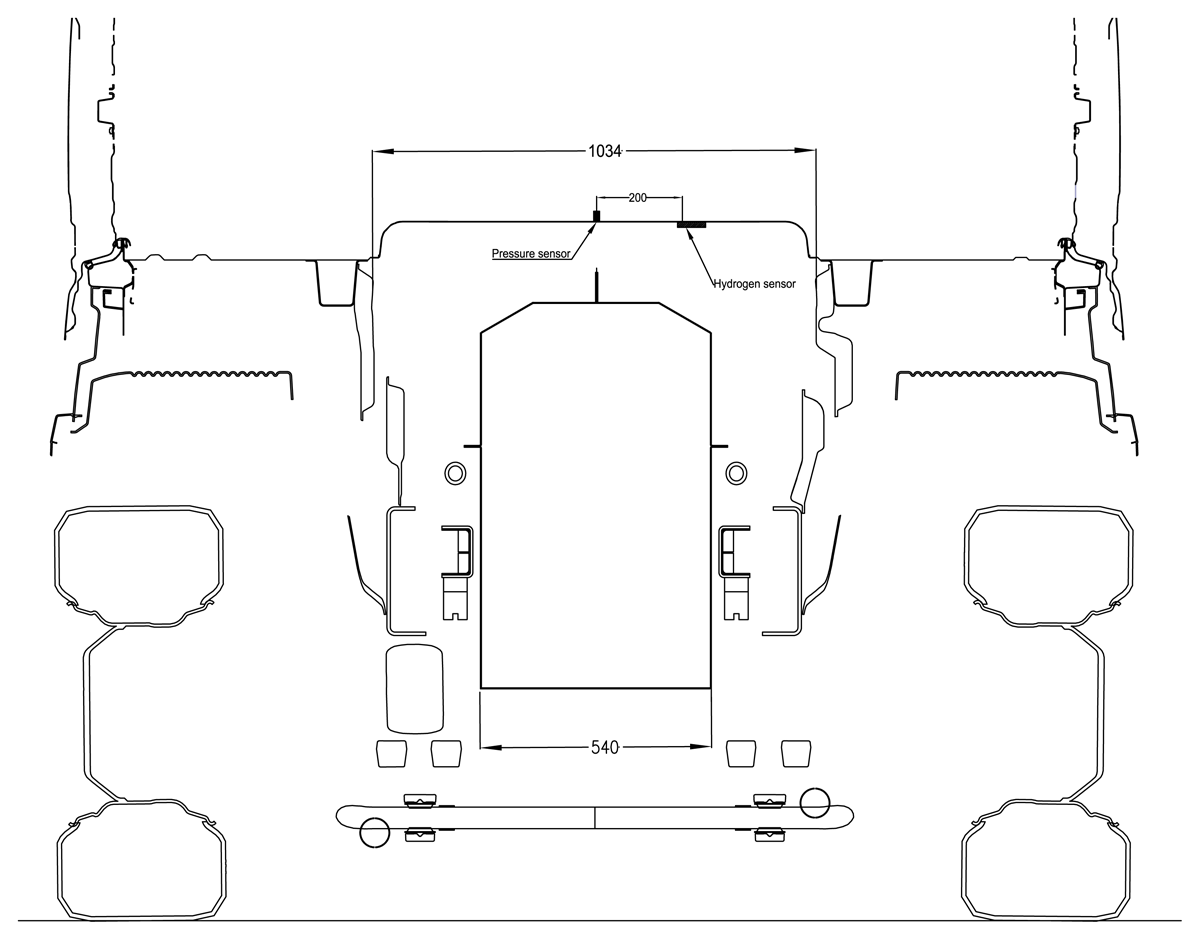
Figure 4
Section across the center of the FC-compartment.
The simulated fuel cell was 1280 × 540 × 900 mm (L × W × H) and constructed of 2 mm steel plate. On the top, an array of 10 rods were fitted and equipped with thermistors to measure the flame arrival time. The distance between the thermistors was 120 mm, and the height was 80 mm from the top of the fuel cell. In the centre of the mock-up, and 80 mm from the back, piezoelectric spark generators were mounted.
2.2 Equipment
The measuring chain for overpressure utilized quartz-based sensors from Kistler (Model 7061B), with a sensitivity of ~80 pC/bar and natural frequency of 45 kHz. The sensors were calibrated at 250 kPa and protected from thermal shock by 1 mm RTV-silicone as recommended by Krause et al. (2021). The signal from the pressure sensors was routed through a Kistler 5080A amplifier equipped with 5067A cards. The measurement uncertainty is 2% FSO for signals up to 10 pC, and 0.6% FSO in the range 10–100 pC. The amplifier has a bandwidth of 200 kHz and was connected to a TraNet FE 204 logger operating at a sample rate of 1 MS/s.
Thermistors used for flame arrival time measurements were EPCOS G540 series, ∅0.8 mm, 100 kΩ, NTC type, glass-encapsulated, short response time sensors connected to a PicoLog 1012 logger operating at 1 kS/s.
The hydrogen sensors were RS XEN-5320-ALU-CAN which are based on thermal conductivity of the fluid. The inaccuracy of the sensor is 1% FS for hydrogen.
The release of hydrogen was controlled by a DN25 solenoid valve of type Bürkert 6407 with an opening time of 60 ms mounted directly on the outlet of a stainless FESTO CRVZS reservoir with a nominal volume of 10 l and 5 l, providing 9.2 and 5.5 l in effective volume respectively. The opening of the valve was controlled by a relay operated by an Arduino UNO R4.
2.3 Experimental matrix
The first set of experiments (D1–D4) aimed to assess if there were significant variations in concentration along the smaller dimension of the engine compartment. Four hydrogen sensors were placed at 200 mm spacing across the engine compartment in a band located in the middle above the simulated fuel cell. The released mass was 2.7 g, 2.7 g, 3.6 g, and 4.6 g of hydrogen.
The second set (D5–D25) was to assess the impact of released mass on hydrogen concentration in the engine compartment. Releases were performed for each full gram (±0.1 g) between 4 g and 14 g with one repeat for each case. For releases above 8 g, two release points were used instead of one to reduce the release time and keep the pressure in a desired range (≤1 MPa). To verify that this did not influence the peak concentration, two additional tests were performed at 8 g to compare one and two release points.
The third set of experiments (E1–E17) was to assess the potential consequences of an ignition of the released hydrogen. For those tests, the released mass was also for each even gram (±0.1 g) between 4 and 13 g, but only releases at 9 g and above were repeated since lower releases gave no significant pressure rise. To assess which of the two ignition positions (center and back) should be used, the overpressure for a released mass of 13 g was compared for the two positions. The conclusion was that center ignition produced higher pressure and, therefore, this position was used for all experiments. Similarly, the worst-case ignition delay was assessed at 0.4, 0.6, 0.8, 1, and 1.2 s, with a delay of 0.6 s yielding the most severe scenario.
3. Results
In this section, results for measured hydrogen concentrations are first presented, followed by those for overpressure (divided into observations, post-processing, and peak overpressure). Finally, the flame speed measurements are presented.
3.1 Hydrogen concentration
Hydrogen concentration was measured at the same positions along the truck as overpressure but displaced 200 mm to the side. To investigate if one sensor was enough to represent the concentrations in the cross section of the engine compartment, four releases (D1–D4) were performed from 2.7–4.6 g in released mass. In those experiments, the concentration difference among the four sensors spaced across the engine compartment with 200 mm distance was only ±0.7%, which is within the uncertainty of the sensors. Therefore, a single sensor was used to represent the concentrations in proximity to each pressure sensor.
For the remaining 21 experiments (D5–D25), hydrogen between 4.0 and 13.0 g was released, and the peak average concentration (Cmax) across the different sensors was investigated and plotted in Figure 5. To illustrate the spread between the sensor with highest and lowest concentration at the time of maximum average value for the sensors, bars were added to the figure. Note the small spread among the four points at 8 g of released mass showing that the number of release points did not influence the maximum average concentration.
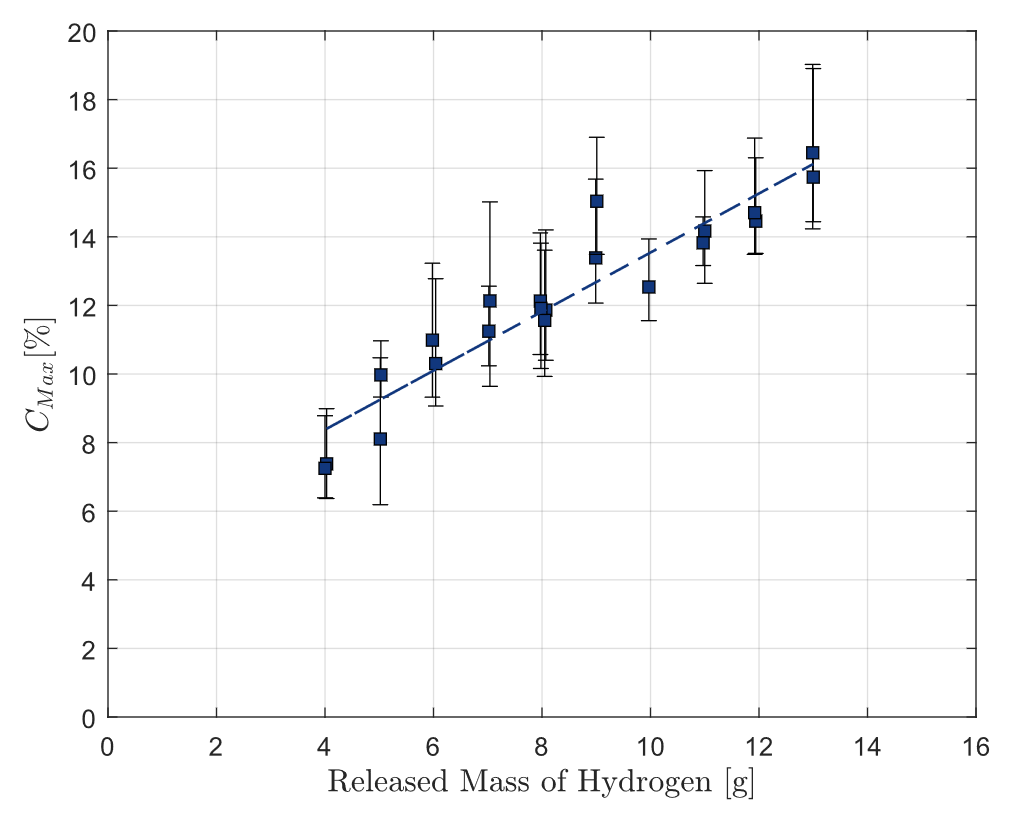
Figure 5
Maximum average concentration (Cmax) in the engine compartment vs mass of released hydrogen. The bars indicate the minimum and maximum hydrogen concentration among the sensors when the average value reached its peak value.
3.2 Overpressure – Observations
As the released mass of hydrogen increased, the effect of the gas explosion became more apparent. Despite the gates in front of the truck being kept open during the experiments, the pressure rise could be felt in both the control room and neighboring labs. No damage was, however, observed on the truck during the experiments except for a light scorching of the sound dampers in the engine compartment. The cab was also seen wobbling due to the force exerted in the engine compartment, and flames could also be observed, particularly in the back of the truck, as seen in Figure 6.
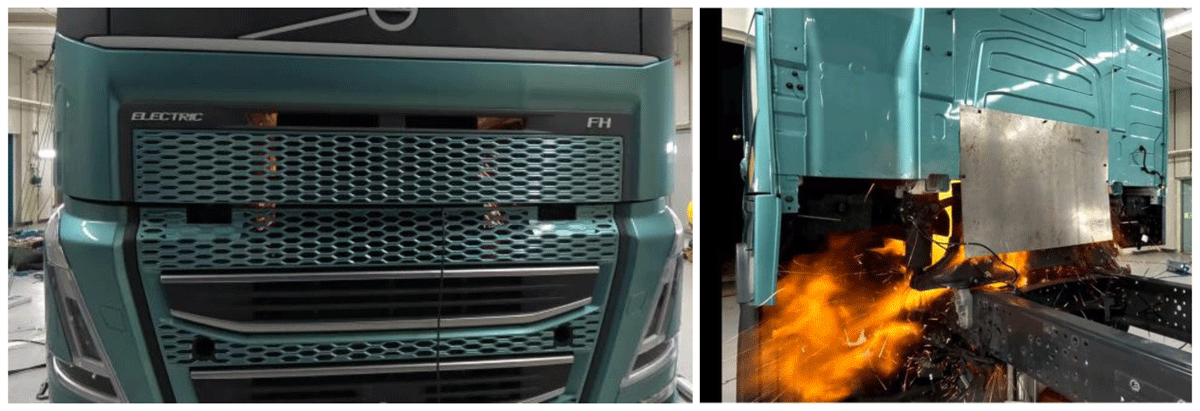
Figure 6
Frames with explosion extracted from film with 13 g released H2.
3.3 Overpressure – Data post-processing
The pressure-time-history during the tests showed very low absolute values (maximum ~10 kPa) and did not have a clear peak structure even at higher released mass. This was expected due to the openness of the setup. Instead of a peak structure, the structure noted is similar to what Cooper et al. (1986) described as the acoustic region. In this region, acoustic waves in the enclosures interfere with the flame and cause flame instabilities and a cell-like structure. A sample pressure-time-history is provided in Figure 7. This phenomenon has previously been studied in lean hydrogen flames and found to be specifically prominent in downward propagating flames such as in the current set-up (Veiga-López et al., 2020).

Figure 7
Unfiltered pressure-time-history for a release of 11.0 g H2.
The lack of distinguishable peak structure makes filtering of noise very challenging. Several different filter designs were attempted, but ultimately a simple low-pass filter was selected. Then, for each case, the impact of the cutoff frequency on the impulse, peak pressure and signal energy was evaluated. A sample curve for 11.0 g H2 released is provided in Figure 8.
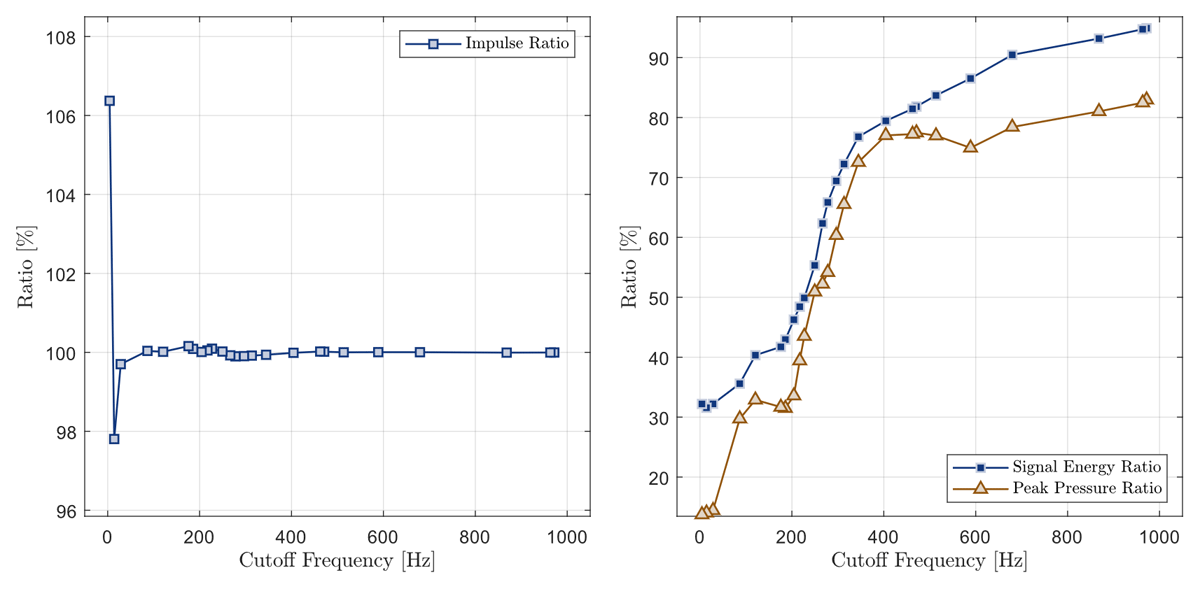
Figure 8
Dependence of impulse, peak pressure and signal energy to low-pass filter cutoff value for a release of 11.0 g H2.
The figure to the right indicates that the peak pressure levels off at around 400 Hz cutoff frequency while the impulse becomes insensitive of the cutoff frequency around 100 Hz. It can also be noted that the filter becomes unstable for very low cutoff frequencies at the selected (minimum) filter order (which was 16).
To further investigate the frequency content of the signals, they were decomposed using the Empirical Wavelet Transform method (Giles, 2013). With a maximum of five bands, the decomposed frequency ranges can be found in Figure 9.
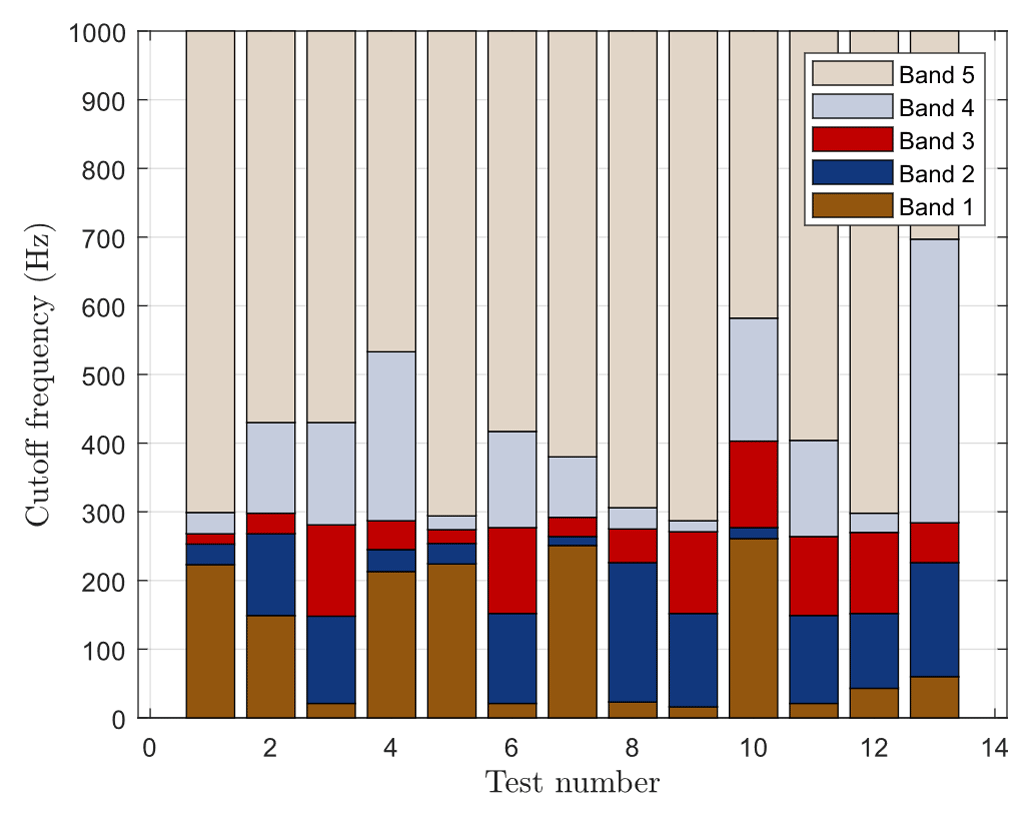
Figure 9
Bar chart indicating the division of the signal into five distinct frequency bands using the Empirical Wavelet Transform method. The figure is cut at 1000 Hz.
As can be seen in the figure, the frequency content differs between the different tests, which further highlights the difficulties in defining an appropriate cutoff frequency for the low-pass filter. Due to this, a cutoff frequency of 400 Hz was selected, which provides a mild filtering of the signal. It is acknowledged that this selection introduces significant uncertainty into the results. To investigate this uncertainty, a boxplot with peak pressures depending on the selection of cutoff frequency between 250 and 1000 Hz is presented in Figure 10.
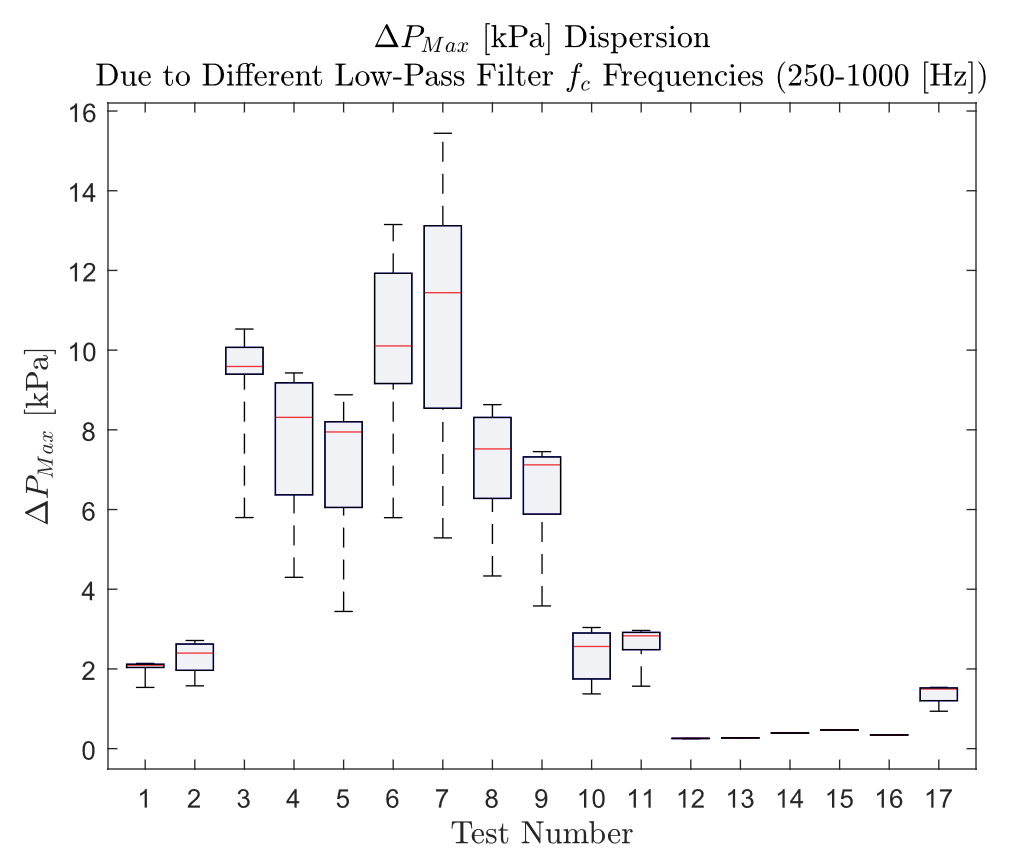
Figure 10
Measured peak-pressure during the experiments depending on the cutoff frequency of the low-pass filter.
3.4 Overpressure – Peak pressure
After the data was filtered according to section 3.3 (low-pass filter with 400 Hz cutoff), the peak pressure was derived as a function of released mass of hydrogen between 4 g and 14 g. The result is presented in Figure 11. Note that the values are highly uncertain and should only be seen as order-of-magnitude approximations (see section 4.1).
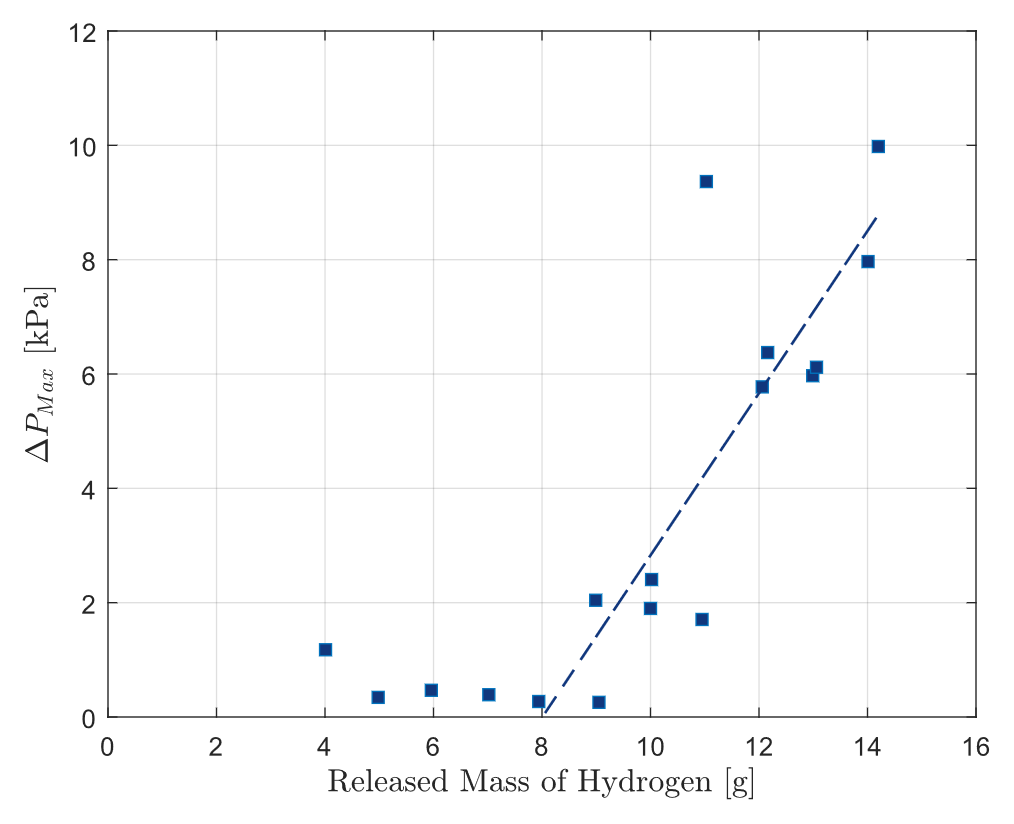
Figure 11
Peak filtered overpressure as a function of released mass of hydrogen. Linear regression performed for released mass above 8 g.
3.5 Flame speed
To complement the overpressure measurements, the flame speed was also measured using the flame arrival time to the thermistors on the mockup fuel cell, and the results from three of the tests are presented in Figure 12. Velocities were calculated using the raw thermistor data, while the arrival times of the flame front to each sensor were determined using a set point at 50% of the baseline resistance (i.e. at ambient temperature). In most test cases, the ignition point was in the center of the mock fuel cell (refer to Figure 2), which meant that the flame front traveled in two directions. Velocities presented here were taken from measurements performed on the back side of the ignitor, as these were more stable due to the less-obscured pathway for the reacting gas out the front grill of the truck.
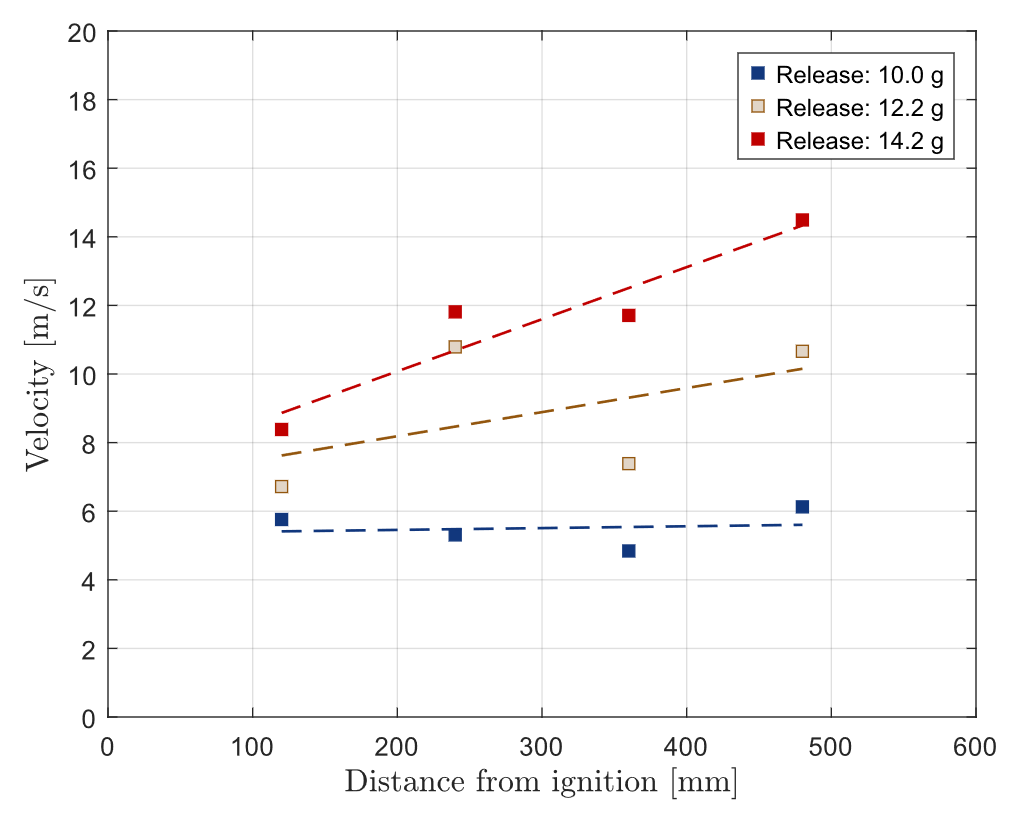
Figure 12
Flame speed as a function of distance from ignition point and released mass.
4. Discussion
In this section, the uncertainty in the measurements is discussed, followed by a brief discussion of the results.
4.1 Uncertainty
Overpressure is very difficult to measure accurately in gas explosions since the sources of uncertainty are abundant and not always easy to quantify. The pressure sensors used are of one of the most sensitive types on the market (~80 pC/bar), but when measuring the very low pressures often relevant for deflagrations, this will induce just a few pC in charge, making the measurement sensitive to small amounts of moisture in connections and triboelectric effects from movement in cables (the latter was also observed in the present experiments). In the pressure histories, indications of thermal shock were also observed in some tests despite the sensors being protected by 1 mm of RTV-silicone as recommended in the literature (Krause et al., 2021). Besides the sensor, each component in the measuring chain contributes to a total uncertainty that sometimes can grow to very large numbers. Refer to Camacho et al. (2025) for a more detailed discussion.
Besides the significant inherent uncertainty described above, an unnecessarily high pressure range (200 kPa) was selected in the amplifier instead of a more appropriate level (e.g. 20 or 50 kPa). This inflates the uncertainty in the readings. Also the selection of cutoff frequency will have a large impact, as illustrated in Figure 10, and all this together implies that the absolute values presented in Figure 11 can only be seen as indicative order-of-magnitude approximations, but since the conclusions are not sensitive to exact values, the measurement is still relevant for the purpose of the paper.
4.2 Discussion of results
Acknowledging the uncertainties presented in section 4.1, it can still be concluded that the expected overpressure will be negligible in this scenario up to released mass in the order of 8–10 g of hydrogen. At higher released mass, the maximum overpressure steadily increases but remains below the order of 10 kPa up to the highest released mass (14.2 g H2). This pressure is only expected to result in minor damage to structures (Merx, 1992) which is also in line with the fact that no damage was observed on the truck during the experiments. No significant thermal effects on the enclosure were observed either.
In contrast to the threshold dependence for overpressure, the maximum concentration grows essentially linearly with released mass of hydrogen from around 5% for 4 g release to 16% for 14 g release. Comparing the concentration with the threshold for overpressure (~10 g) it can be found that this scenario is related to a hydrogen concentration in the engine compartment in the order of 13%.
Finally, it can be found that the flame speed increases with increasing released mass (or concentration), but the effect of concentration on flame acceleration appears to be even more significant. The flame speed close to the release (~120 mm) was between around 6–8 m/s for all releases, but, for the largest release (14.2 g), the flame accelerated significantly and reached a velocity above 14 m/s at 480 mm from the ignition point while for small releases (10.0 g) the velocity was essentially constant.
5. Conclusions
The very low pressures experienced caused significant uncertainty in the results, but the following conclusions can be drawn based on the experiments conducted:
In the defined scenario, hydrogen releases in the fuel-cell compartment up to 14 g will result in no or very limited overpressure.
In the tested range, between 4 g and 13 g of released hydrogen, the concentration increases essentially linearly from 5% to 16% and corresponds to around 13% where the overpressure starts to rise.
The flame speed close to the release (~120 mm) was similar for releases in the range 10–14 g, but for the larger releases, the flame accelerates to almost twice the initial value while remaining essentially constant for smaller releases.
The motivation for this study was primarily to evaluate potential consequences of a hydrogen leak in the engine compartment in case of a crash as identified in the risk analysis by Volvo Trucks AB. Even though the exact value of the potential leak is not public information due to IP reasons, the value from the preliminary design is within the tested range showing that this will not cause a significant escalation of the scenario. This conclusion also holds for variations in the current design as long as the released mass is below 14 g. In case of larger potential releases, further tests could be considered.
Even though the tests are based on a pressure range relevant for FCEV drivetrains, it is expected to be relevant also for the ICE drivetrain operating at much higher pressures (up to several hundred bars) as long as the released mass is in the same range as the one in the current paper. This extrapolation, however, introduces additional uncertainty, so if the released mass approaches the upper range of the tested values, additional tests could be considered.
Data Accessibility Statement
The data is available on request.
Competing Interests
The financial support for this project comes from Volvo Trucks AB who is also the employer of two of the authors, Stig Boman and Staffan Lundgren.
Marcus Runefors is a member of the editorial board for Hydrogen Safety but had no involvement in any editorial processes related to the handling of this submission.
Author Contributions
Marcus Runefors: Conceptualization, Methodology, Formal analysis, Investigation, Resources, Writing – Original Draft, Project administration, Funding acquisition, Konrad Wilkens: Methodology, Investigation, Writing – Review & Editing, Javier Camacho: Formal analysis, Data Curation, Writing – Review & Editing, Stig Boman: Conceptualization, Methodology, Resources, Writing – Review & Editing, Staffan Lundgren: Conceptualization, Resources, Writing – Review & Editing.