
Table 1
Platforms included in the sample for searches.
| ‘TRADITIONAL’ DATABASES | ‘GENAI’ TOOLS |
|---|---|
| Academic Search Ultimate | Consensus |
| ERIC | Elicit |
| Google Scholar | Research Rabbit |
| Scopus | Scopus AI |
| Web of Science | Semantic Scholar |
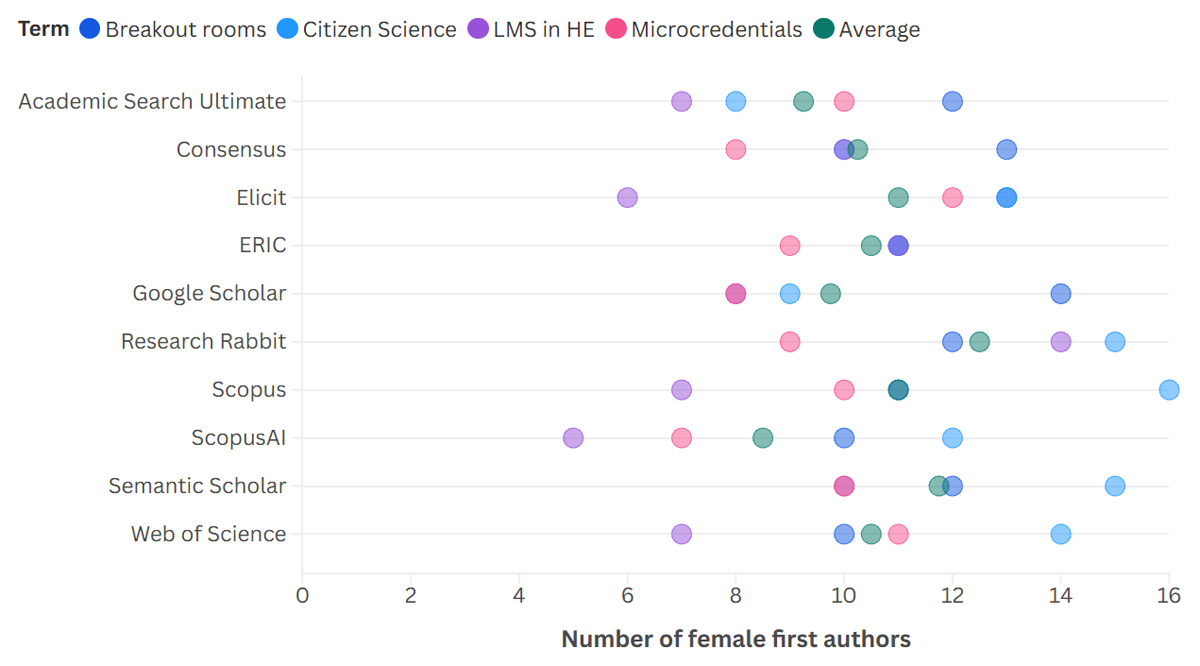
Figure 1
Number of female first authors in the first 20 papers returned from each platform included in the sample. Colour of dots denotes the search term, and green dots show the mean average for each platform. Note that in instances where fewer than five data points are shown, this is due to overlapped data points of the same value – please refer to the colour coding.
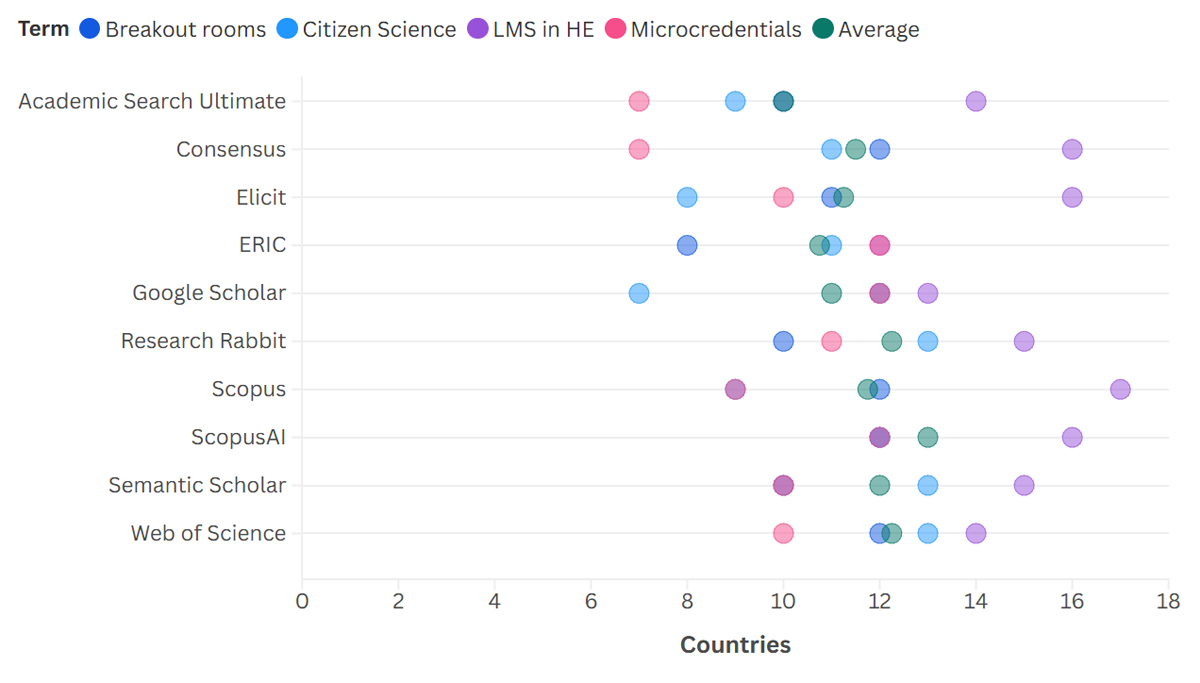
Figure 2
Number of countries represented by first authors in the first 20 papers returned from each platform included in the sample. Colour of dots denotes the search term, and green dots show the mean average for each platform. Note that in instances where fewer than five data points are shown, this is due to overlapped data points of the same value – please refer to the colour coding.
Table 2
Number of papers in the first 20 results per query, per platform, with first authors based in Global Majority countries.
| PLATFORM | BREAKOUT ROOMS | MICROCREDENTIALS | LEARNING MANAGEMENT SYSTEMS IN HIGHER EDUCATION | CITIZEN SCIENCE | TOTAL |
|---|---|---|---|---|---|
| Academic Search Ultimate | 4 | 1 | 12 | 2 | 28 |
| ERIC | 4 | 4 | 17 | 3 | 27 |
| Google Scholar | 9 | 3 | 15 | 0 | 23 |
| Scopus | 6 | 1 | 13 | 3 | 18 |
| Web of Science | 5 | 0 | 12 | 1 | 19 |
| Total | 115 | ||||
| Consensus | 9 | 0 | 11 | 1 | 21 |
| Elicit | 6 | 4 | 14 | 0 | 24 |
| Research Rabbit | 9 | 2 | 13 | 1 | 25 |
| Scopus AI | 6 | 5 | 13 | 3 | 27 |
| Semantic Scholar | 9 | 3 | 16 | 1 | 29 |
| Total | 126 |
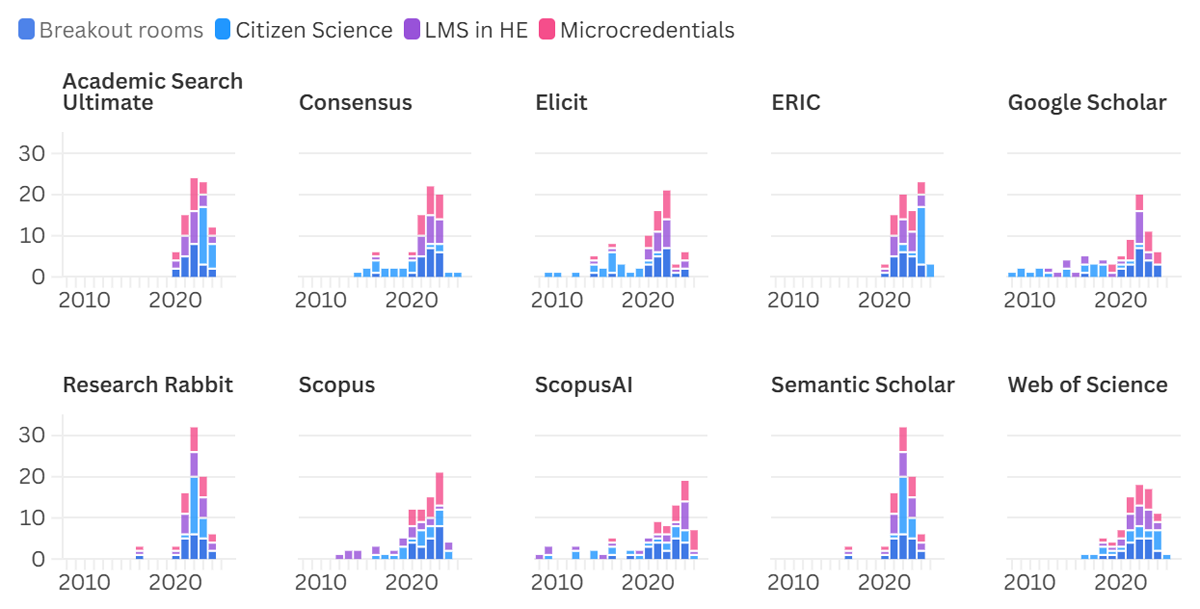
Figure 3
Distribution of publication date (year) for the first 20 papers returned from each platform included in the sample, colour coded according to search topic.
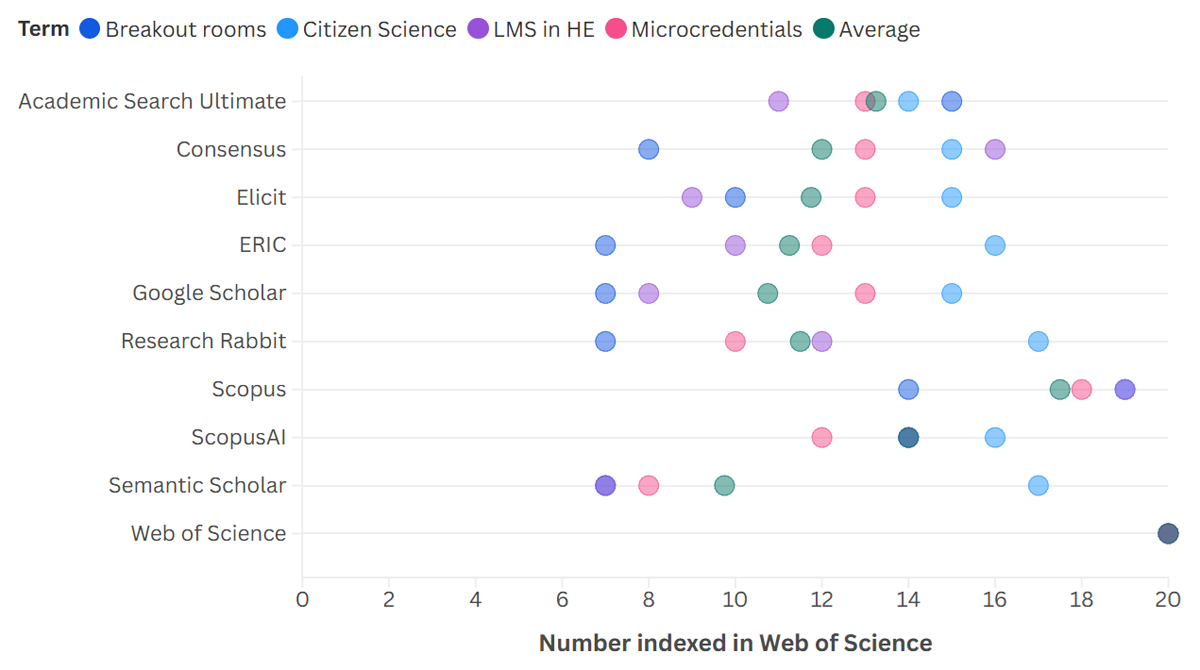
Figure 4
Number of papers in the first 20 papers returned from each platform included in the sample which are published in journals indexed by Web of Science. Colour of dots denotes the search term, and green dots show the mean average for each platform. Note that in instances where fewer than five data points are shown, this is due to overlapped data points of the same value – please refer to the colour coding.
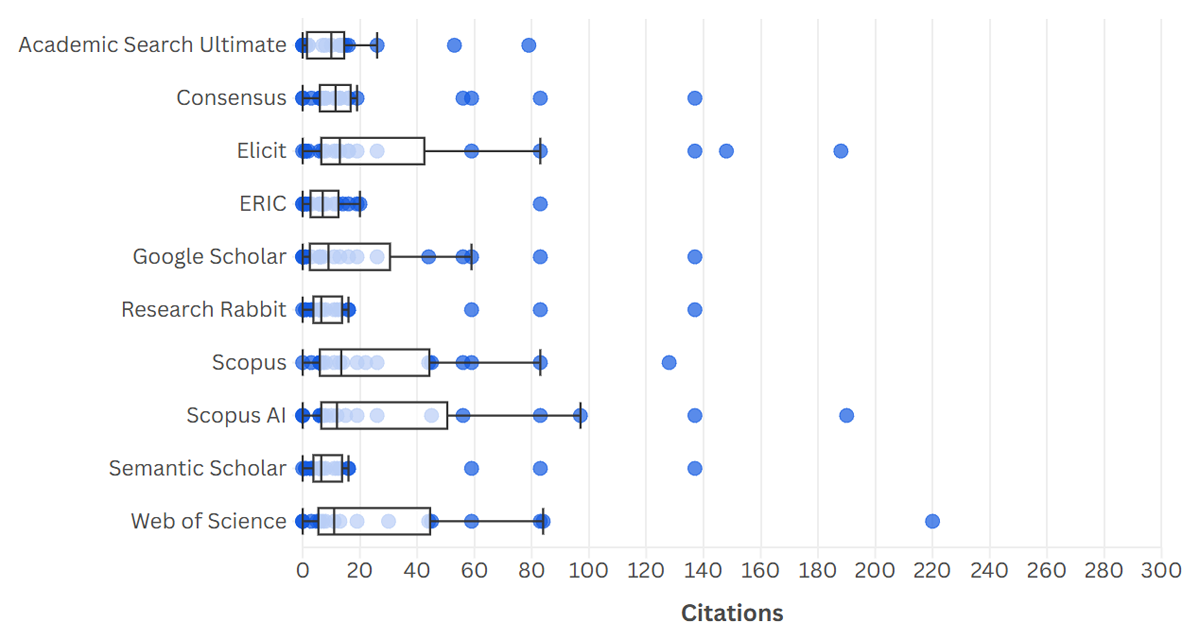
Figure 5
Citation counts according to Google Scholar for the first 20 papers returned from each platform included in the sample on the topic of breakout rooms. Three outliers – articles with citations >300 – are not shown (one each from Academic Search Ultimate, Elicit, and Scopus AI).
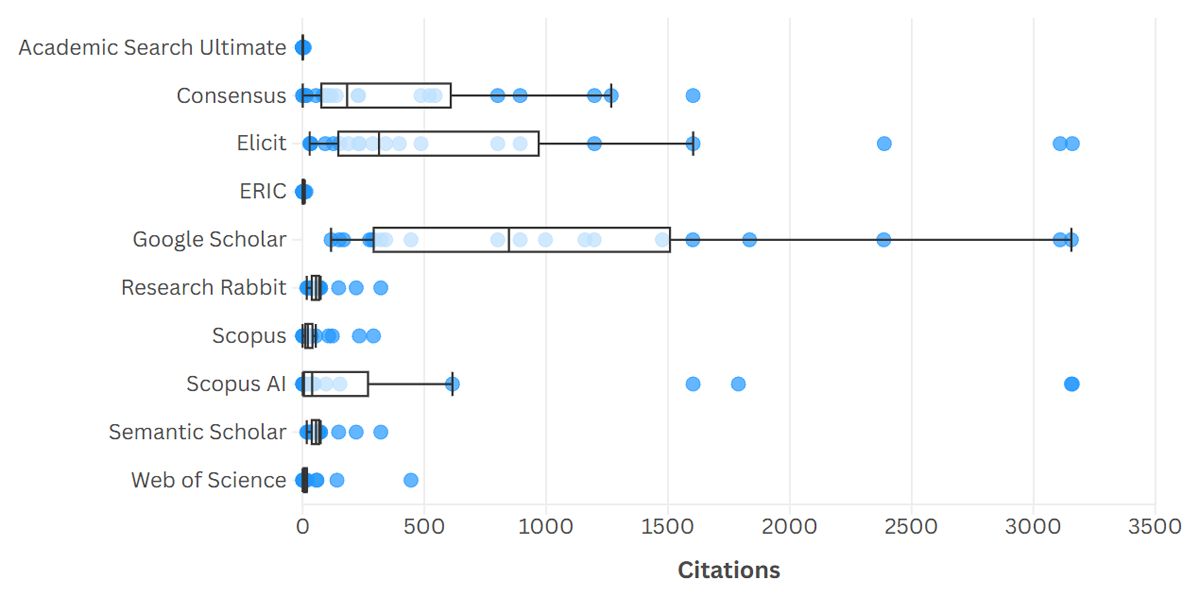
Figure 6
Citation counts according to Google Scholar for the first 20 papers returned from each platform included in the sample on the topic of citizen science.
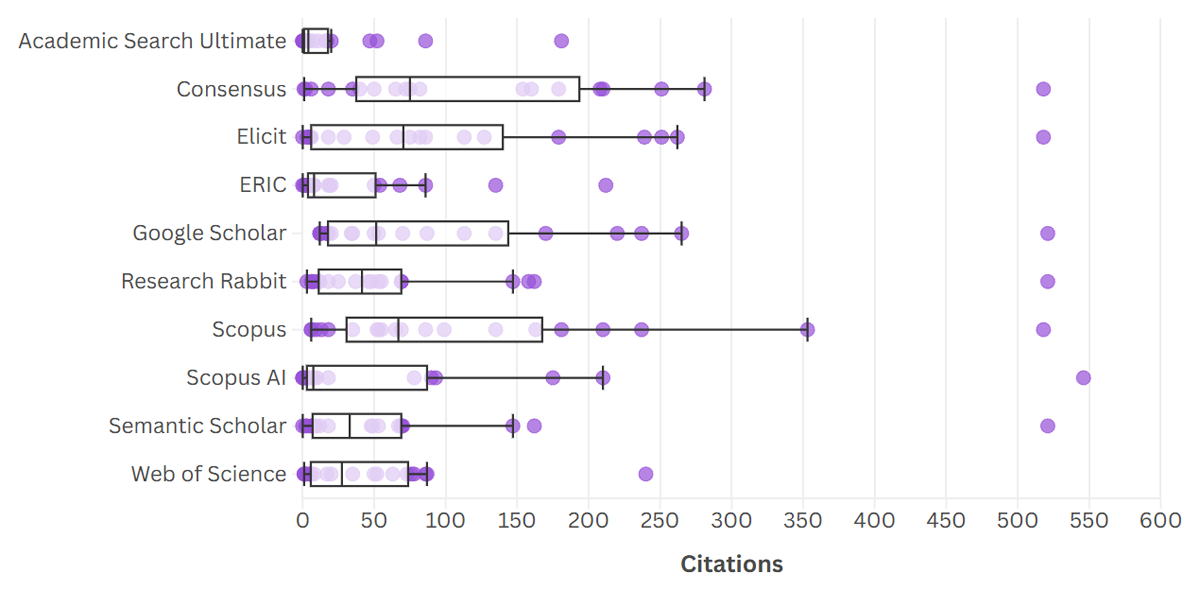
Figure 7
Citation counts according to Google Scholar for the first 20 papers returned from each platform included in the sample on the topic of learning management systems in higher education. Three outliers – articles with citations >600 – are not shown (one from Consensus, and two from Scopus AI).
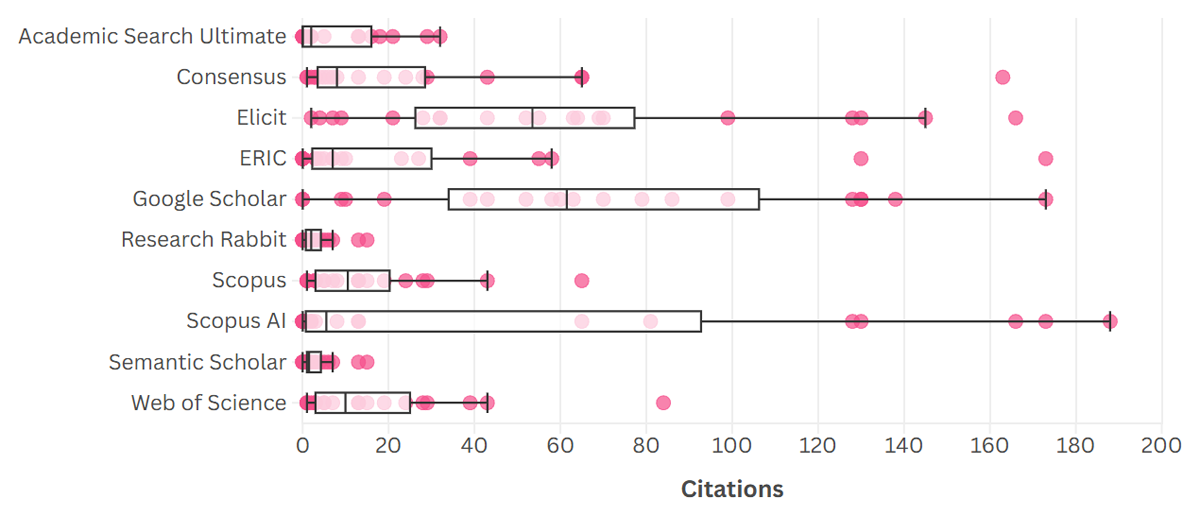
Figure 8
Citation counts according to Google Scholar for the first 20 papers returned from each platform included in the sample on the topic of microcredentials.
Table 3
Ranking by median number of citations for the sampled papers per query.
| PLATFORM | BREAKOUT ROOMS | MICROCREDENTIALS | LEARNING MANAGEMENT SYSTEMS IN HIGHER EDUCATION | CITIZEN SCIENCE | TOTAL |
|---|---|---|---|---|---|
| Academic Search Ultimate | 5 | 8.5 | 10 | 10 | 33.5 |
| ERIC | 8 | 6 | 8 | 9 | 31 |
| Google Scholar | 7 | 1 | 4 | 1 | 13 |
| Scopus | 1 | 3 | 3 | 7 | 14 |
| Web of Science | 6 | 4 | 7 | 8 | 25 |
| Consensus | 4 | 5 | 1 | 3 | 13 |
| Elicit | 2 | 2 | 2 | 2 | 8 |
| Research Rabbit | 9.5 | 8.5 | 5 | 4.5 | 27.5 |
| Scopus AI | 3 | 7 | 9 | 6 | 25 |
| Semantic Scholar | 9.5 | 10 | 6 | 4.5 | 30 |
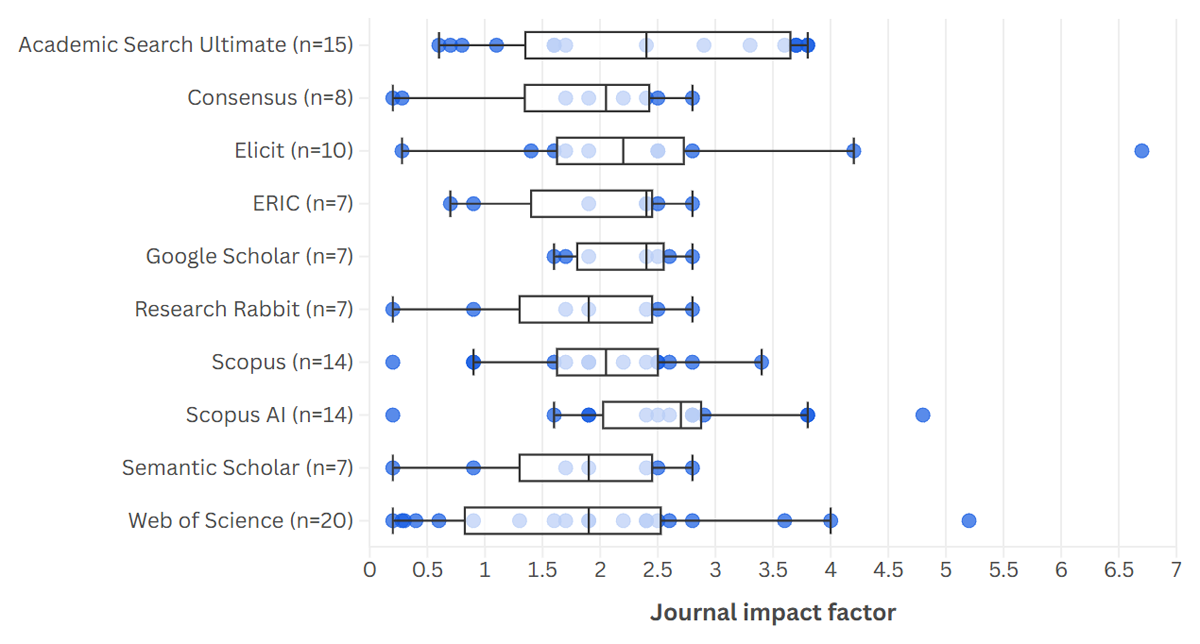
Figure 9
Journal impact factors, for papers published in journals which have them (note differing ‘n‘), within the first 20 papers returned from each platform included in the sample on the topic of breakout rooms.
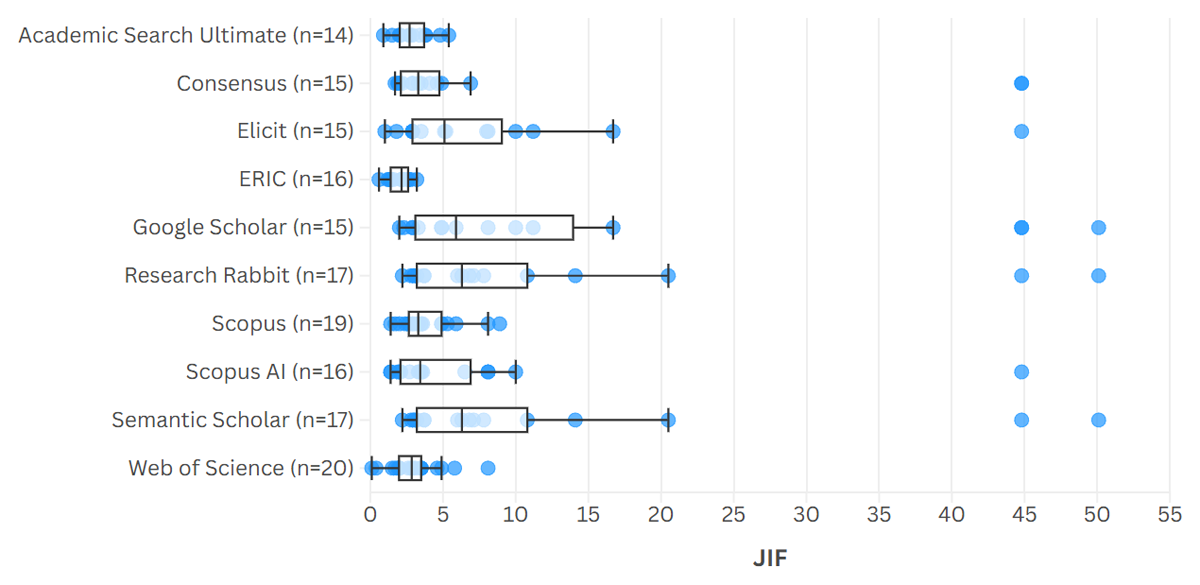
Figure 10
Journal impact factors, for papers published in journals which have them (note differing ‘n‘), within the first 20 papers returned from each platform included in the sample on the topic of citizen science.
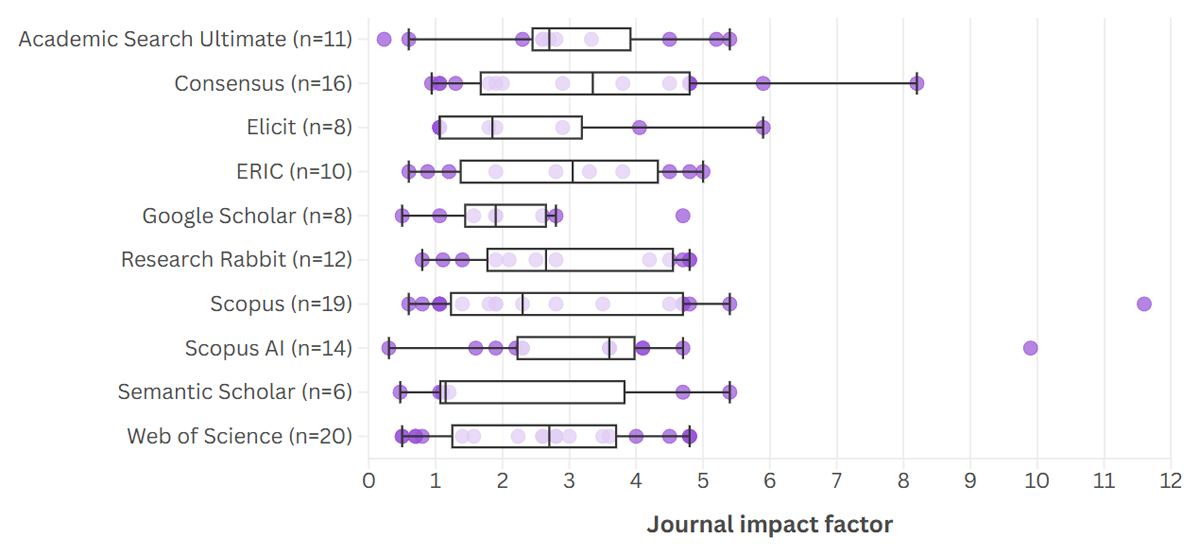
Figure 11
Journal impact factors, for papers published in journals which have them (note differing ‘n‘), within the first 20 papers returned from each platform included in the sample on the topic of learning management systems in higher education.
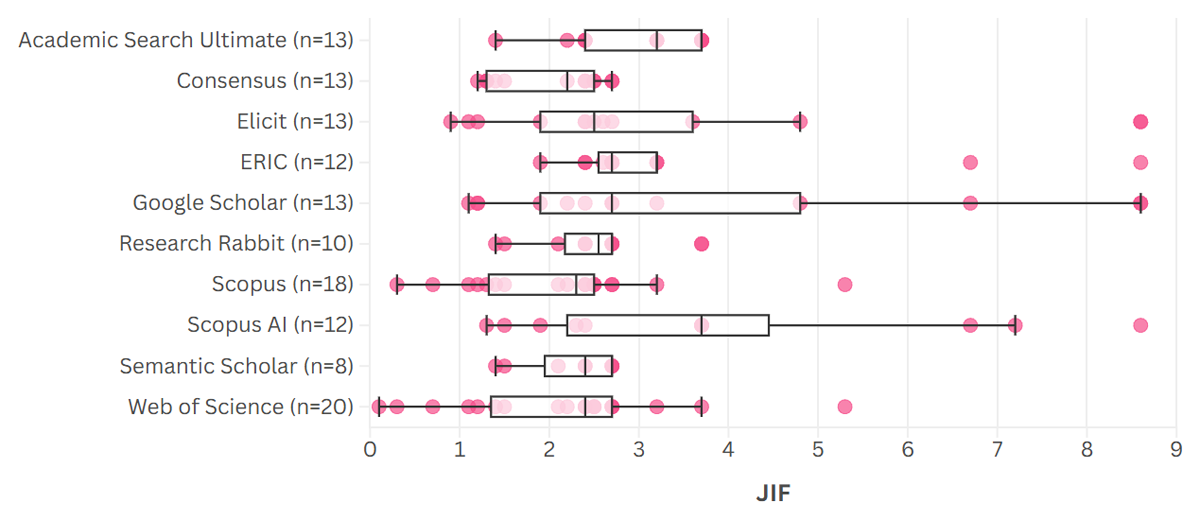
Figure 12
Journal impact factors, for papers published in journals which have them (note differing ‘n’), within the first 20 papers returned from each platform included in the sample on the topic of microcredentials.
Table 4
Ranking by median JIF for the sampled papers per query.
| PLATFORM | BREAKOUT ROOMS | MICROCREDENTIALS | LEARNING MANAGEMENT SYSTEMS IN HIGHER EDUCATION | CITIZEN SCIENCE | TOTAL |
|---|---|---|---|---|---|
| Academic Search Ultimate | 2 | 2 | 4.5 | 9 | 17.5 |
| ERIC | 2 | 3.5 | 3 | 10 | 18.5 |
| Google Scholar | 2 | 3.5 | 8 | 3 | 16.4 |
| Scopus | 5.5 | 9 | 7 | 7 | 28.5 |
| Web of Science | 9 | 7.5 | 4.5 | 8 | 29 |
| Consensus | 5.5 | 10 | 2 | 6 | 23.5 |
| Elicit | 4 | 6 | 9 | 4 | 23 |
| Research Rabbit | 9 | 5 | 6 | 1.5 | 21.5 |
| Scopus AI | 1 | 1 | 1 | 5 | 8 |
| Semantic Scholar | 9 | 7.5 | 10 | 1.5 | 28 |