
Table 1
Domains of the Teachers’ Perceptions Scale.
| DOMAIN | DESCRIPTION |
|---|---|
| Relevance and Content Quality | Perceived relevance and quality of MOOC content for professional growth. |
| Flexibility and Accessibility | Ability of MOOCs to fit into teachers’ schedules and contexts. |
| Interaction and Engagement | Opportunities for peer interaction and active learning in MOOCs. |
| Practical Application | Relevance of MOOC content to teaching practices. |
| Time and Commitment | Balancing teaching workload and MOOC participation. |
| Assessment and Feedback | Quality of evaluation and feedback mechanisms within MOOCs. |
| Cost and Resource Considerations | Perceived affordability and sufficiency of MOOC resources. |
| Technical Support and Platform Experience | Usability and reliability of MOOC platforms. |
| Integration into Teaching Practice | Extent to which MOOCs inform and enrich teaching practices. |
Table 2
Domains of the Teachers’ Attitudes Scale.
| DOMAIN | DESCRIPTION |
|---|---|
| Perceived Benefits | Anticipated professional benefits of engaging in MOOCs. |
| Barriers and Concerns | Challenges or reservations about MOOCs. |
| Perceived Support and Resources | Availability of institutional and technical support for MOOC use. |
| Future Engagement | Willingness to continue or recommend MOOCs in the future. |
Table 3
Demographic Characteristics of Participants (N = 76).
| CHARACTERISTIC | FREQUENCY | PERCENTAGE |
|---|---|---|
| Gender | ||
| Female | 49 | 64.5 |
| Male | 27 | 35.5 |
| Academic Designation | ||
| Assistant Professor | 61 | 80.3 |
| Associate Professor | 12 | 15.8 |
| Professor | 3 | 3.9 |
| Teaching Experience | ||
| 0–5 Years | 20 | 26.3 |
| 5–10 Years | 19 | 25.0 |
| 10–15 Years | 13 | 17.1 |
| 15–20 Years | 11 | 14.5 |
| 20–25 Years | 10 | 13.2 |
| Greater Than 25 Years | 3 | 3.9 |
| Institutional Affiliation | ||
| College | 71 | 93.4 |
| University | 5 | 6.6 |
| Annual MOOC Enrolment | ||
| 0–5 MOOCs | 64 | 84.2 |
| 5–10 MOOCs | 10 | 13.2 |
| More than 15 MOOCs | 2 | 2.6 |
| Total MOOCs Completed | ||
| 0–10 MOOCs | 65 | 85.5 |
| 10–20 MOOCs | 3 | 3.9 |
| 20–30 MOOCs | 3 | 3.9 |
| More Than 30 MOOCs | 5 | 6.6 |
Table 4
Exploratory Factor Analysis Results for Teachers’ Perceptions Scale.
| FACTOR | EIGENVALUE | % VARIANCE | CUMULATIVE % | ITEMS LOADING |
|---|---|---|---|---|
| 1 | 26.759 | 59.465 | 59.465 | 9 |
| 2 | 1.992 | 4.426 | 63.891 | 8 |
| 3 | 1.814 | 4.031 | 67.921 | 7 |
| 4 | 1.580 | 3.511 | 71.432 | 6 |
| 5 | 1.344 | 2.987 | 74.419 | 8 |
| 6 | 1.058 | 2.352 | 76.771 | 7 |
| Total | 76.771 | 45 |
[i] Note. Extraction method: Principal Component Analysis with Varimax rotation. KMO = .861, Bartlett’s χ² = 4114.578, df = 990, p < .001.
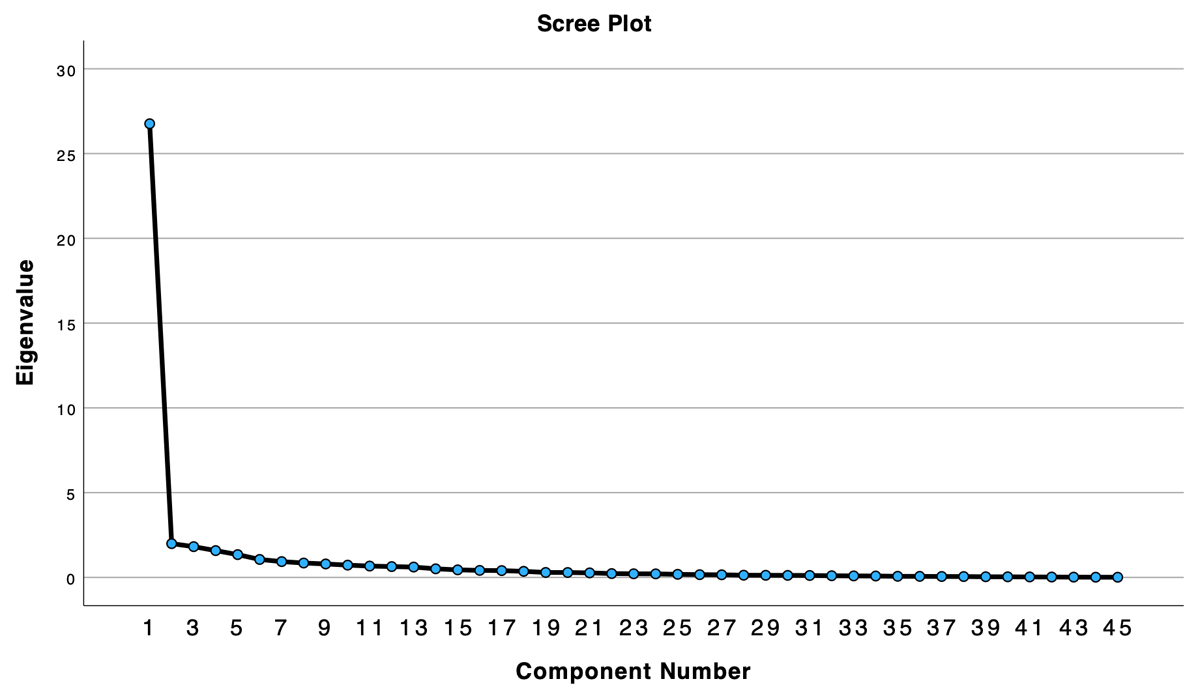
Figure 1
Scree Plot for Teachers’ Perceptions Scale Factor Analysis.
Table 5
Exploratory Factor Analysis Results for Teachers’ Attitudes Scale.
| FACTOR | EIGENVALUE | % VARIANCE | CUMULATIVE % | ITEMS LOADING |
|---|---|---|---|---|
| 1 | 10.228 | 51.139 | 51.139 | 8 |
| 2 | 2.619 | 13.097 | 64.236 | 7 |
| 3 | 1.365 | 6.823 | 71.058 | 5 |
| Total | 71.058 | 20 |
[i] Note. Extraction method: Principal Component Analysis with Varimax rotation. KMO = .899, Bartlett’s χ² = 1267.672, df = 190, p < .001.
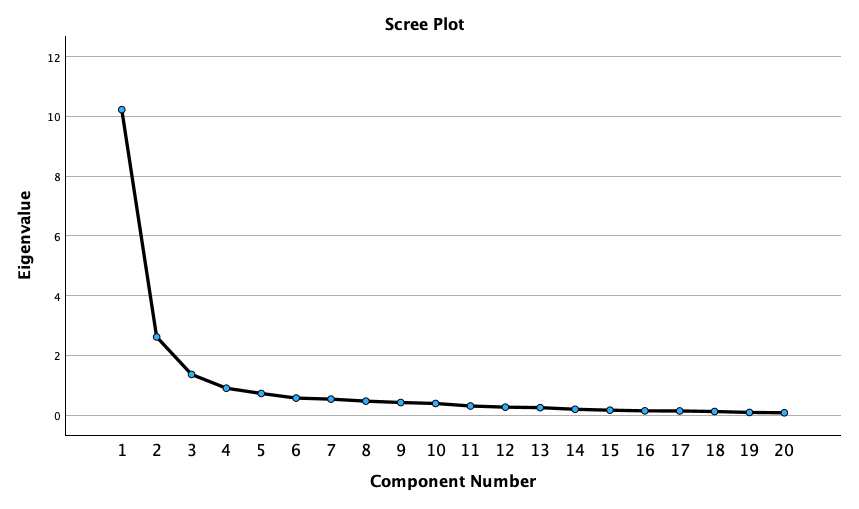
Figure 2
Scree Plot for Teachers’ Attitudes Scale Factor Analysis.
Table 6
Internal Consistency Reliability for Teachers’ Perceptions Scale.
| DOMAIN | ITEMS | CRONBACH’S α |
|---|---|---|
| Relevance and Content Quality | 5 | .892 |
| Flexibility and Accessibility | 5 | .914 |
| Interaction and Engagement | 5 | .904 |
| Practical Application | 5 | .918 |
| Time and Commitment | 5 | .908 |
| Assessment and Feedback | 5 | .921 |
| Cost and Resource Considerations | 5 | .854 |
| Technical Support and Platform Experience | 5 | .908 |
| Integration into Teaching Practice | 5 | .939 |
| Overall Perceptions Scale | 45 | .984 |
Table 7
Internal Consistency Reliability for Teachers’ Attitudes Scale.
| DOMAIN | ITEMS | CRONBACH’S α |
|---|---|---|
| Perceived Benefits of MOOCs | 5 | .931 |
| Barriers and Concerns | 5 | .849 |
| Perceived Support and Resources | 5 | .876 |
| Future Engagement with MOOCs | 5 | .923 |
| Overall Attitudes Scale | 20 | .942 |
Table 8
Descriptive Statistics for Teachers’ Perceptions Scale Domains (N = 76).
| DOMAIN | MEAN | SD | MIN | MAX |
|---|---|---|---|---|
| Flexibility and Accessibility | 4.00 | 0.83 | 1.00 | 5.00 |
| Relevance and Content Quality | 3.91 | 0.84 | 1.00 | 5.00 |
| Interaction and Engagement | 3.91 | 0.83 | 1.00 | 5.00 |
| Practical Application | 3.89 | 0.79 | 1.20 | 5.00 |
| Technical Support and Platform Experience | 3.84 | 0.82 | 1.20 | 5.00 |
| Assessment and Feedback | 3.82 | 0.85 | 1.40 | 5.00 |
| Time and Commitment | 3.78 | 0.89 | 1.20 | 5.00 |
| Cost and Resource Considerations | 3.73 | 0.78 | 1.20 | 5.00 |
| Integration into Teaching Practice | 3.72 | 0.87 | 1.00 | 5.00 |
[i] Note. Responses measured on a 5-point Likert scale: 1 = Strongly Disagree, 5 = Strongly Agree.
Table 9
Descriptive Statistics for Teachers’ Attitudes Scale Domains (N = 76).
| DOMAIN | MEAN | SD | MIN | MAX |
|---|---|---|---|---|
| Future Engagement with MOOCs | 3.91 | 0.85 | 1.00 | 5.00 |
| Perceived Benefits of MOOCs | 3.84 | 0.86 | 1.00 | 5.00 |
| Perceived Support and Resources | 3.75 | 0.80 | 1.20 | 5.00 |
| Barriers and Concerns | 3.32 | 0.91 | 1.20 | 5.00 |
[i] Note. Responses measured on a 5-point Likert scale: 1 = Strongly Disagree, 5 = Strongly Agree.
Table 10
Correlations Between Teachers’ Attitudes and Perceptions of MOOCs (N = 76).
| PERCEPTION DOMAIN | PERCEIVED BENEFITS | BARRIERS & CONCERNS | SUPPORT & RESOURCES | FUTURE ENGAGEMENT |
|---|---|---|---|---|
| Relevance and Content Quality | 0.88** | 0.39** | 0.74** | 0.78** |
| Flexibility and Accessibility | 0.76** | 0.33** | 0.59** | 0.73** |
| Interaction and Engagement | 0.75** | 0.45** | 0.62** | 0.69** |
| Practical Application | 0.81** | 0.45** | 0.65** | 0.69** |
| Time and Commitment | 0.84** | 0.45** | 0.74** | 0.76** |
| Assessment and Feedback | 0.83** | 0.35** | 0.62** | 0.71** |
| Cost and Resource Considerations | 0.78** | 0.56** | 0.72** | 0.78** |
| Technical Support and Platform Experience | 0.82** | 0.39** | 0.76** | 0.80** |
| Integration into Teaching Practice | 0.88** | 0.41** | 0.70** | 0.76** |
[i] Note. ** p < 0.001. All correlations are statistically significant.
Table 11
Gender Differences in Perceptions and Attitudes Towards MOOCs.
| DOMAIN | FEMALE (n = 49) | MALE (n = 27) | t | p | d |
|---|---|---|---|---|---|
| M (SD) | M (SD) | ||||
| Perceptions | |||||
| Relevance and Content Quality | 4.02 (0.84) | 3.70 (0.80) | 1.57 | .120 | 0.377 |
| Interaction and Engagement | 4.04 (0.81) | 3.69 (0.84) | 1.76 | .082 | 0.423 |
| Integration into Teaching Practice | 3.82 (0.85) | 3.55 (0.90) | 1.30 | .199 | 0.311 |
| Attitudes | |||||
| Perceived Benefits of MOOCs | 4.00 (0.80) | 3.56 (0.91) | 2.17 | .033* | 0.520 |
| Future Engagement with MOOCs | 4.00 (0.78) | 3.75 (0.96) | 1.26 | .212 | 0.302 |
[i] Note. Only domains with d ≥ 0.30 shown. *p < .05. Effect size interpretation: small (0.20–0.49), medium (0.50–0.79), large (≥0.80).
Table 12
ANOVA Results for Demographic Differences in Perceptions (N = 76).
| PERCEPTION DOMAIN | DESIGNATION | EXPERIENCE | ANNUAL MOOCs ENROLMENT | TOTAL MOOCs COMPLETED |
|---|---|---|---|---|
| Integration into Teaching Practice | F(2,73) = 1.504, p = .221 | F(5,70) = 1.504, p = .221 | F(2,73) = 1.504, p = .221 | F(3,72) = 1.504, p = .221 |
| Assessment and Feedback | F(2,73) = 1.210, p = .312 | F(5,70) = 1.210, p = .312 | F(2,73) = 1.210, p = .312 | F(3,72) = 1.210, p = .312 |
| Cost and Resource Considerations | F(2,73) = 1.158, p = .332 | F(5,70) = 1.158, p = .332 | F(2,73) = 1.158, p = .332 | F(3,72) = 1.158, p = .332 |
| Technical Support and Platform Experience | F(2,73) = 1.157, p = .332 | F(5,70) = 1.157, p = .332 | F(2,73) = 1.157, p = .332 | F(3,72) = 1.157, p = .332 |
| Practical Application | F(2,73) = 1.025, p = .387 | F(5,70) = 1.025, p = .387 | F(2,73) = 1.025, p = .387 | F(3,72) = 1.025, p = .387 |
| Relevance and Content Quality | F(2,73) = 0.869, p = .461 | F(5,70) = 0.869, p = .461 | F(2,73) = 0.869, p = .461 | F(3,72) = 0.869, p = .461 |
| Time and Commitment | F(2,73) = 0.690, p = .561 | F(5,70) = 0.690, p = .561 | F(2,73) = 0.690, p = .561 | F(3,72) = 0.690, p = .561 |
| Interaction and Engagement | F(2,73) = 0.649, p = .586 | F(5,70) = 0.649, p = .586 | F(2,73) = 0.649, p = .586 | F(3,72) = 0.649, p = .586 |
| Flexibility and Accessibility | F(2,73) = 0.260, p = .854 | F(5,70) = 0.260, p = .854 | F(2,73) = 0.260, p = .854 | F(3,72) = 0.260, p = .854 |
[i] Note. All domains showed p > .05, indicating no significant differences across demographic variables.
Table 13
ANOVA Results for Demographic Differences in Attitudes (N = 76).
| ATTITUDE DOMAIN | DESIGNATION | EXPERIENCE | ANNUAL MOOCs ENROLMENT | TOTAL MOOCs COMPLETED |
|---|---|---|---|---|
| Perceived Benefits of MOOCs | F(2,73) = 0.406, p = .668 | F(5,70) = 1.259, p = .292 | F(2,73) = 0.406, p = .668 | F(3,72) = 0.406, p = .668 |
| Barriers and Concerns | F(2,73) = 0.642, p = .529 | F(5,70) = 1.125, p = .355 | F(2,73) = 0.642, p = .529 | F(3,72) = 0.642, p = .529 |
| Perceived Support and Resources | F(2,73) = 0.072, p = .931 | F(5,70) = 1.596, p = .173 | F(2,73) = 0.072, p = .931 | F(3,72) = 0.072, p = .931 |
| Future Engagement with MOOCs | F(2,73) = 0.048, p = .954 | F(5,70) = 0.724, p = .608 | F(2,73) = 0.048, p = .954 | F(3,72) = 0.048, p = .954 |
[i] Note. All domains showed p > .05, indicating no significant differences across demographic variables.
Table 14
Regression Analysis: Predicting Perceived Benefits of MOOCs.
| PREDICTOR | B | SE B | β | t | p | VIF |
|---|---|---|---|---|---|---|
| Relevance and Content Quality | 0.470 | 0.123 | 0.456 | 3.831 | <.001 | 6.600 |
| Cost and Resource Considerations | 0.194 | 0.091 | 0.176 | 2.146 | .036 | 3.137 |
| Integration into Teaching Practice | 0.351 | 0.123 | 0.353 | 2.842 | .006 | 7.193 |
[i] Note. Only significant predictors shown. Model: R² = 0.858, Adjusted R² = 0.839, F (9, 66) = 44.335, p < .001.
Table 15
Regression Analysis: Predicting Barriers and Concerns.
| PREDICTOR | B | SE B | β | t | p | VIF |
|---|---|---|---|---|---|---|
| Assessment and Feedback | –0.585 | 0.247 | –0.548 | –2.372 | .021 | 5.915 |
| Cost and Resource Considerations | 0.835 | 0.196 | 0.718 | 4.264 | <.001 | 3.137 |
[i] Note. Only significant predictors shown. Model: R² = 0.404, Adjusted R² = 0.323, F (9, 66) = 4.969, p < .001.
Table 16
Regression Analysis: Predicting Perceived Support and Resources.
| PREDICTOR | B | SE B | β | t | p | VIF |
|---|---|---|---|---|---|---|
| Cost and Resource Considerations | 0.400 | 0.125 | 0.390 | 3.201 | .002 | 3.137 |
[i] Note. Only significant predictors shown. Model: R² = 0.687, Adjusted R² = 0.644, F (9, 66) = 16.095, p < .001.
Table 17
Regression Analysis: Predicting Future Engagement with MOOCs.
| PREDICTOR | B | SE B | β | t | p | VIF |
|---|---|---|---|---|---|---|
| Flexibility and Accessibility | 0.241 | 0.106 | 0.235 | 2.273 | .026 | 3.023 |
| Cost and Resource Considerations | 0.442 | 0.115 | 0.405 | 3.842 | <.001 | 3.137 |
[i] Note. Only significant predictors shown. Model: R² = 0.766, Adjusted R² = 0.734, F (9, 66) = 24.046, p < .001.