
Table 1
Demographic characteristics of the students.
| VARIABLE | GROUP | N | % |
|---|---|---|---|
| Gender | Female | 26 | 59.1 |
| Male | 18 | 40.9 | |
| Years of mobile phone use | 1–5 | 13 | 29.6 |
| 6–9 | 25 | 56.9 | |
| 10+ | 6 | 13.6 | |
| Regular use of a mobile phone (Yes/No) | Yes | 44 | 100 |
| No | 0 | 0 | |
| Mobile literacy level | Low | 5 | 11.4 |
| Medium | 35 | 79.5 | |
| High | 4 | 9.1 | |
| Map literacy level | Low | 16 | 36.4 |
| Medium | 23 | 52.3 | |
| High | 5 | 11.4 | |
| Years of Internet use | 0 | 0 | 0 |
| 1–5 | 7 | 15.9 | |
| 6–9 | 21 | 47.8 | |
| 10+ | 16 | 36.3 |
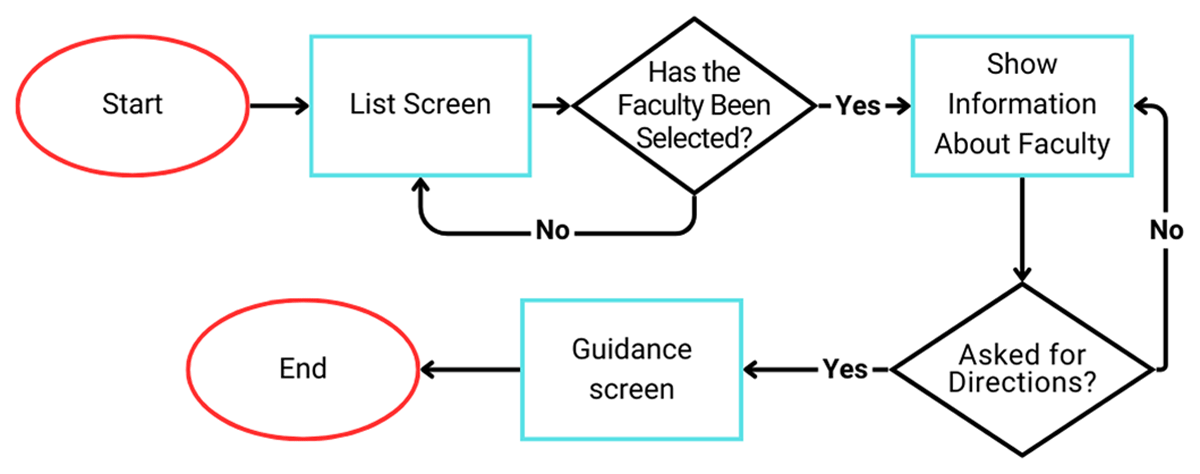
Figure 1
Flow diagram of the proposed LBAR application.
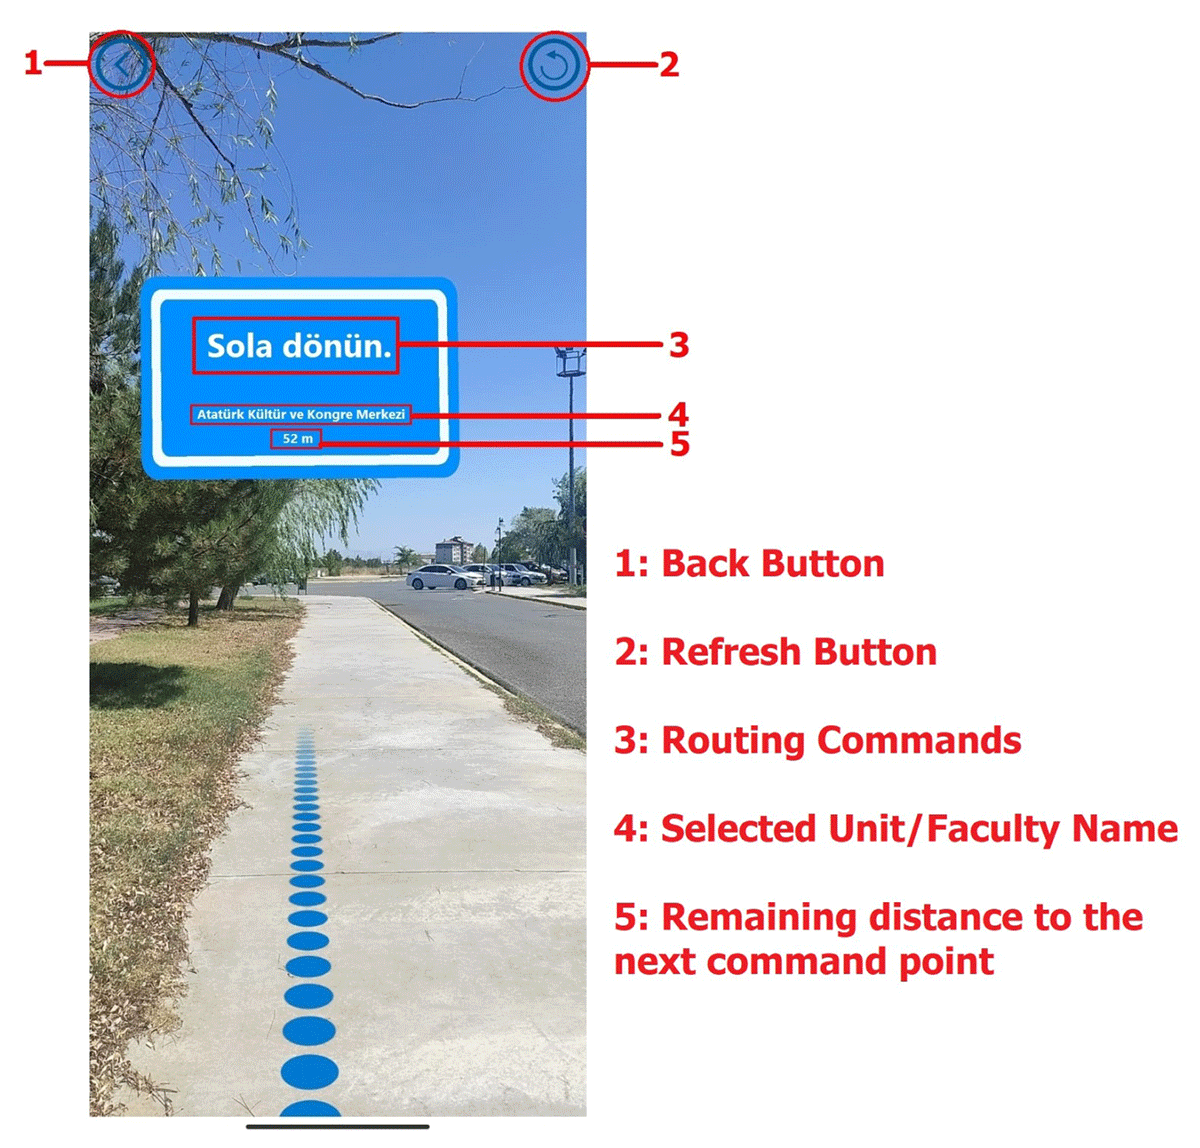
Figure 2
Screenshot of the LBAR application.
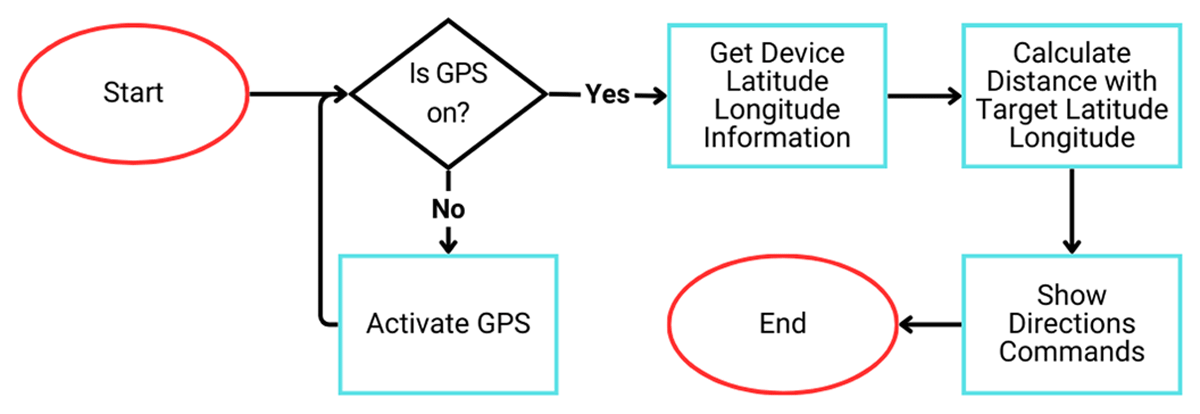
Figure 3
AR + GPS location package flow diagram.
Table 2
Pretest knowledge scores.
| GROUPS | N | PRE TEST | ||||
|---|---|---|---|---|---|---|
| M | S | Sd | t | p | ||
| Experimental | 23 | 5.13 | 2.865 | 42 | 1.949 | .058 |
| Control | 21 | 7.10 | 3.793 | |||
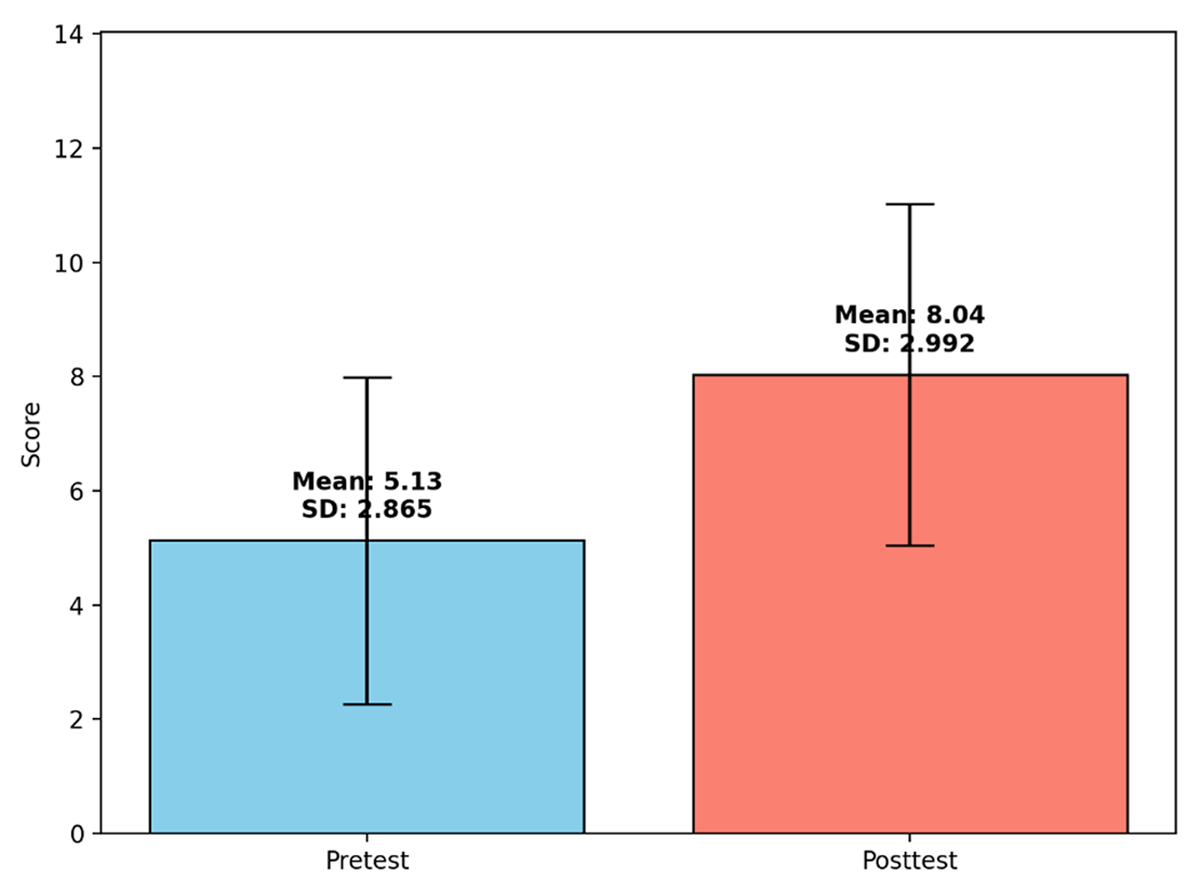
Figure 4
Comparison of the pre- and post-test scores of the knowledge test for the experimental group.
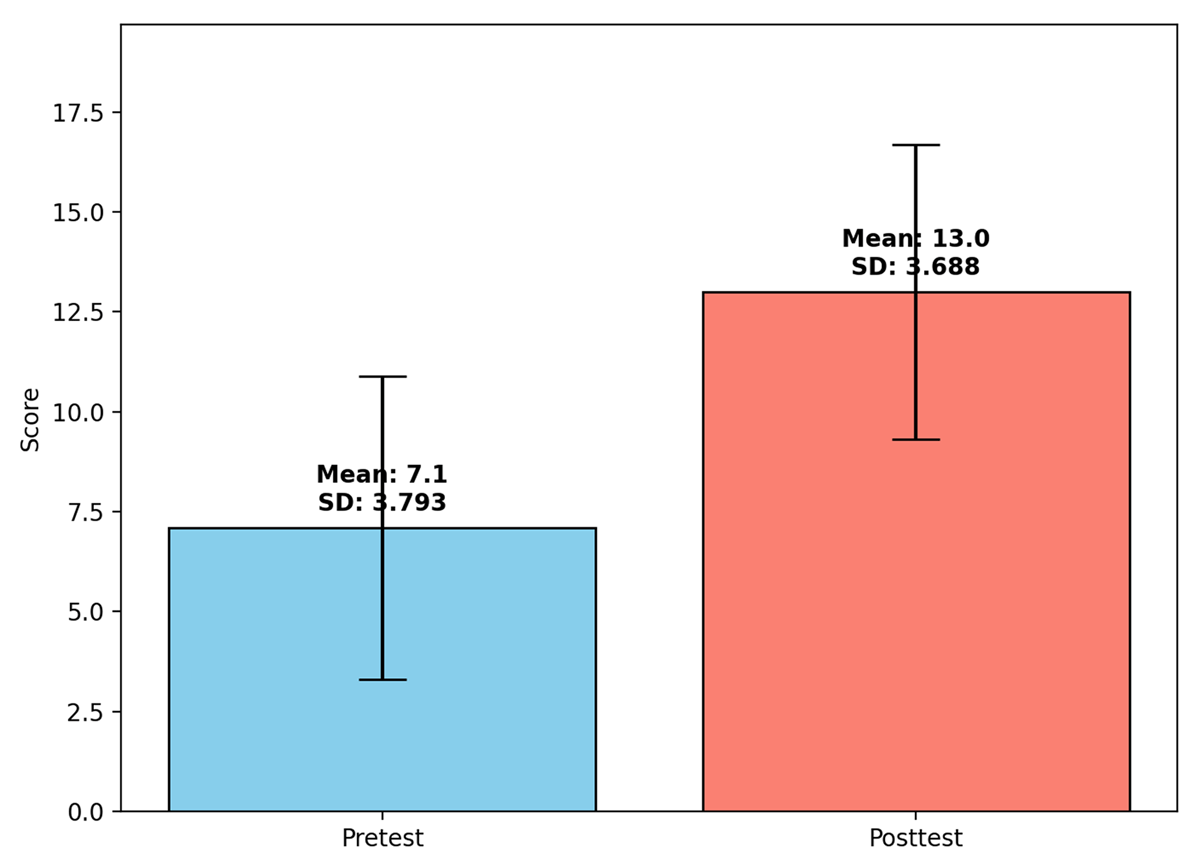
Figure 5
Comparison of the pre- and post-test scores of the knowledge test for the control group.
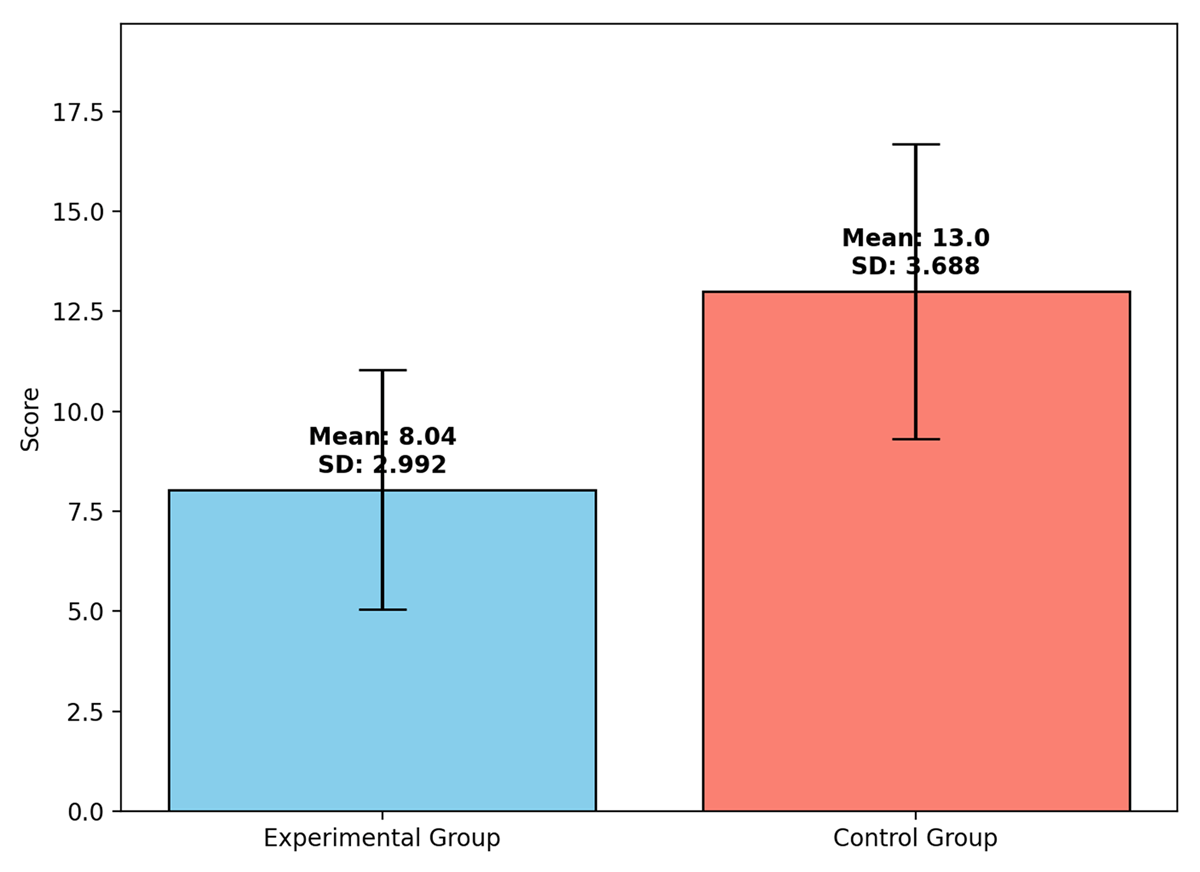
Figure 6
Comparison of the post-test knowledge scores.
Table 3
Student opinions regarding the LBAR-based orientation.
| ITEMS | STRONGLY DISAGREE | DISAGREE | NEUTRAL | AGREE | STRONGLY AGREE | MEAN (sd) |
|---|---|---|---|---|---|---|
| 1. The LBAR-supported orientation made the campus exploration process more interesting. | 8.7% | 4.3% | 34.8% | 43.5% | 8.7% | 3.39 (1.03) |
| 2. I was able to get help with the difficulties I encountered using the LBAR-supported orientation environment. | 4.3% | 13% | 21.7% | 34.8% | 26.1% | 3.65 (1.15) |
| 3. The LBAR-supported orientation was complex, and it was difficult to understand what was happening. | 8.7% | 43.5% | 13% | 26.1% | 8.7% | 2.83 (1.19) |
| 4. LBAR-supported orientation had no effect on my campus-related experiences. | 21.7% | 30.4% | 26.1% | 21.7% | 0% | 2.48 (1.08) |
| 5. The LBAR-supported orientation motivated me to explore topics that I might not have known. | 4.3% | 13% | 8.7% | 52.2% | 21.7% | 3.74 (1.09) |
| 6. The LBAR-supported orientation built a useful bridge between my current novice period and my future student life. | 4.3% | 8.7% | 17.4% | 52.2% | 17.4% | 3.70 (1.02) |
| 7. The LBAR-supported orientation helped me get to know the campus in a shorter time. | 4.3% | 21.7% | 21.7% | 43.5% | 8.7% | 3.30 (1.06) |
| 8. LBAR-supported orientation is an effective way to learn while exploring the university campus. | 4.3% | 13% | 17.4% | 47.8% | 17.4% | 3.61 (1.07) |
| 9. Participating in the LBAR-supported orientation was fun. | 4.3% | 13% | 4.3% | 56.5% | 21.7% | 3.78 (1.08) |
| 10. LBAR-supported orientation was conducted at a time when I needed to get acquainted with the campus. | 4.3% | 8.7% | 17.4% | 43.5% | 26.1% | 3.78 (1.08) |
| 11. Necessary information about LBAR-supported orientation was provided. | 4.3% | 17.4% | 0% | 56.5% | 21.7% | 3.74 (1.13) |
| 12. Learning the LBAR-supported orientation process took a lot of time. | 17.4% | 30.4% | 30.4% | 17.4% | 4.3% | 2.61 (1.11) |
| 13. LBAR-supported orientation significantly improved the quality of my experiences. | 4.3% | 13% | 34.8% | 34.8% | 13% | 3.39 (1.03) |
| 14. Exploring the campus through LBAR-supported orientation is a time-saving method. | 4.3% | 17.4% | 21.7% | 43.5% | 13% | 3.43 (1.08) |
| 15. LBAR-supported orientation allowed me to experience situations that I might encounter in my student life. | 4.3% | 8.7% | 26.1% | 39.1% | 21.7% | 3.65 (1.07) |
| 16. LBAR-supported orientation improved my performance in the campus exploration process. | 8.7% | 8.7% | 17.4% | 52.2% | 13% | 3.52 (1.12) |
| 17. The LBAR-supported orientation generally caught my interest. | 4.3% | 8.7% | 4.3% | 65.2% | 17.4% | 3.83 (0.98) |
| 18. The LBAR-supported orientation was generally very complex. | 21.7% | 17.4% | 39.1% | 17.4% | 4.3% | 2.65 (1.15) |
| 19. LBAR-supported orientation allowed me to better know the campus with less effort. | 4.3% | 17.4% | 30.4% | 34.8% | 13% | 3.35 (1.07) |
| 20. Overall, the LBAR-supported orientation application was helpful in the campus exploration process. | 4.3% | 13% | 21.7% | 52.2% | 8.7% | 3.48 (0.99) |
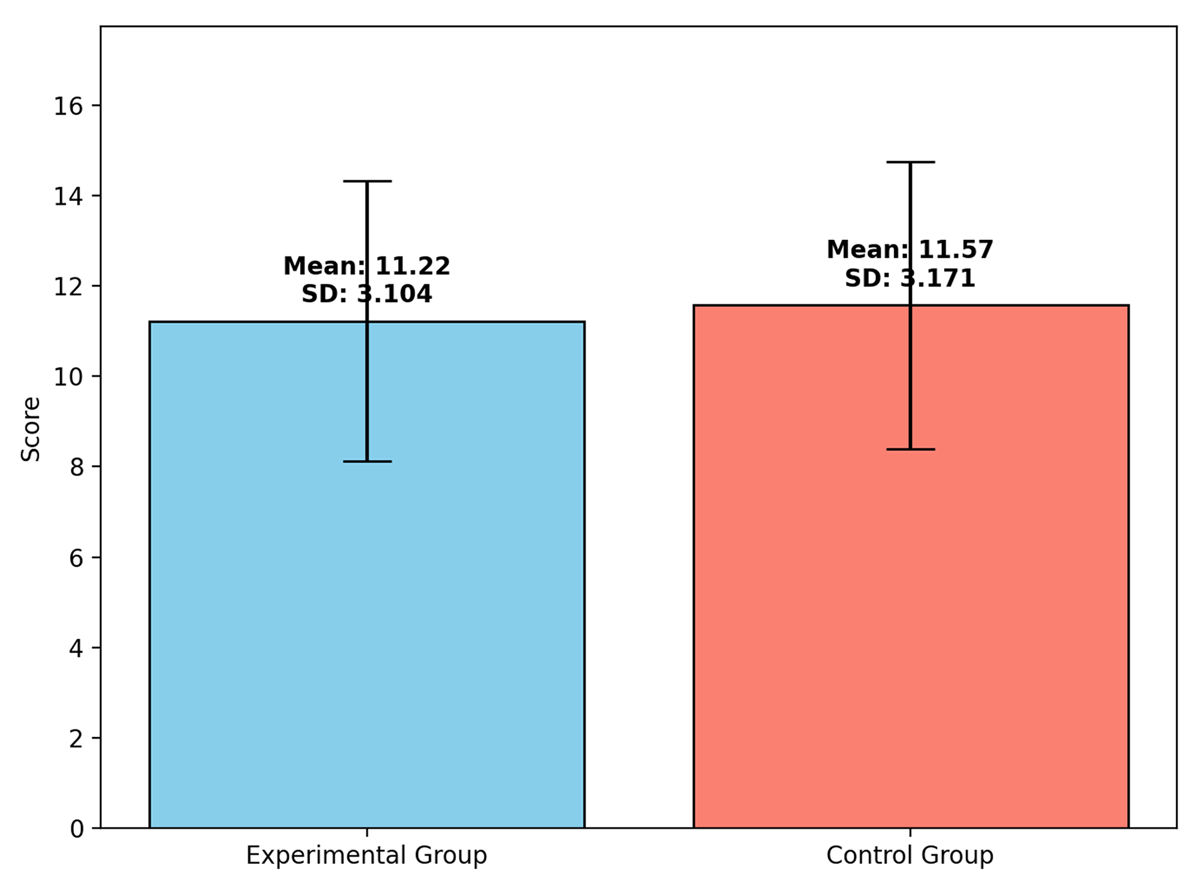
Figure 7
Comparison of spatial knowledge between the groups.