
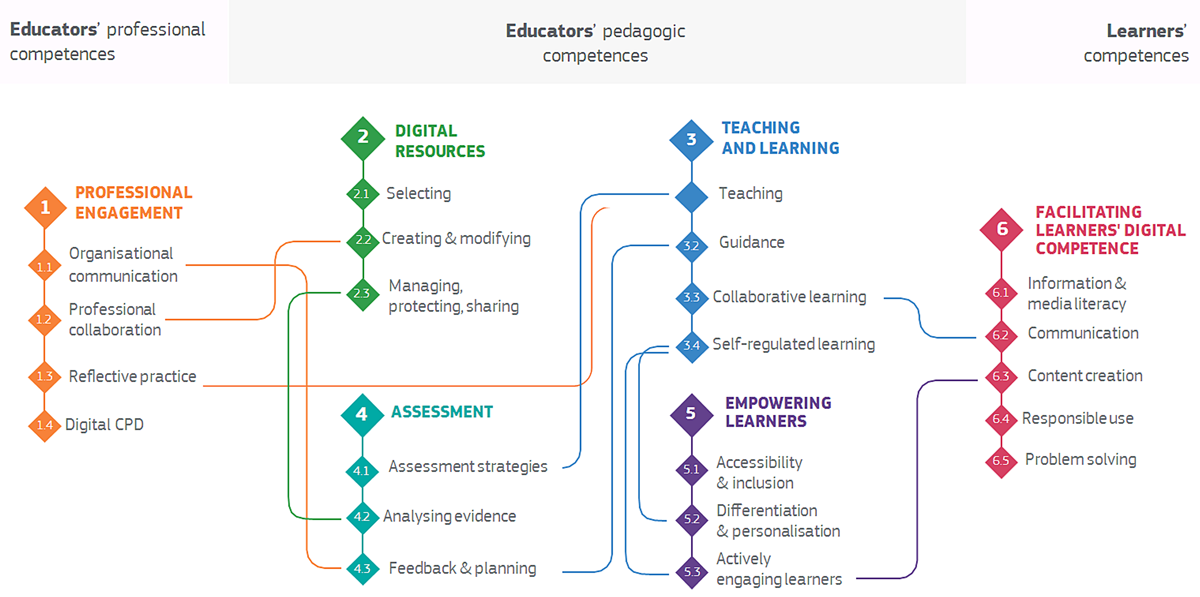
Figure 1
The sub-dimensions of six areas of DigiCompEdu competence and their connections (Punie & Redecker, 2017).
Table 1
The survey sections.
| SECTION | FOCUS AREA | DETAILS | SCALE/MEASURE |
|---|---|---|---|
| Demographic Data | Demographic information | Included four questions on age, gender, prior teaching experience, and digital experience. | |
| Technology Access | Technology access and university support | Included six questions on digital technology integration, technical infrastructure, devices, reliable internet, and technical support. | 5-point Likert scale (1 = strongly disagree, 5 = strongly agree) |
| Perceptions | Faculty perceptions of distance education | Included six questions on motivation, perceived quality of online education, and stress levels. | |
| Self-Efficacy | Faculty self-efficacy in technology use | Included five questions on the use of computers, the Internet, and new apps/programs. | 5-point Likert scale (1 = strongly disagree, 5 = strongly agree) |
| Error Management | Error management culture | Included seven questions using an error management culture measure derived from an instrument by van Dyck et al. (2005). | |
| Digital Competence | Digital competence based on the DigiCompEdu framework | Included twenty-four questions covering six competence areas: Professional Engagement, Digital Resources, Teaching and Learning, Assessment, Empowering Learners, and Facilitating Learners’ Digital Competence (Vuorikari et al., 2022). | Total or separate score for each competence area based on the framework. |
Table 2
Distribution of the DigiCompEdu scores based on the demographic data.
| DigiComp LEVEL | INTEGRATOR B1 | EXPERT B2 | LEADER C1 | PIONEER C2 | TOTAL | |||||
|---|---|---|---|---|---|---|---|---|---|---|
| n | % | n | % | n | % | n | % | n | % | |
| Gender | ||||||||||
| Female | 7 | 33.3 | 35 | 46.1 | 47 | 50.5 | 56 | 68.3 | 145 | 53.3 |
| Male | 14 | 66.7 | 41 | 53.9 | 46 | 49.5 | 26 | 31.7 | 127 | 46.7 |
| Age | ||||||||||
| [39 or below] | 7 | 33.3 | 22 | 28.9 | 29 | 31.2 | 35 | 42.7 | 93 | 34.2 |
| [40–49] | 7 | 33.3 | 26 | 34.2 | 35 | 37.6 | 31 | 37.8 | 99 | 36.4 |
| [50 or more] | 7 | 33.3 | 28 | 36.8 | 29 | 31.2 | 16 | 19.5 | 80 | 29.4 |
| Teaching Experience | ||||||||||
| [5 or less] | 2 | 9.5 | 13 | 17.1 | 10 | 10.8 | 14 | 17.1 | 39 | 14.3 |
| [6–9] | 4 | 19.0 | 13 | 17.1 | 16 | 17.2 | 16 | 19.5 | 49 | 18.0 |
| [10–14] | 5 | 23.8 | 16 | 21.1 | 24 | 25.8 | 23 | 28.0 | 68 | 25.0 |
| [15 or more] | 10 | 47.6 | 34 | 44.7 | 43 | 46.2 | 29 | 35.4 | 116 | 42.6 |
| Digital Experience | ||||||||||
| [Less than three years] | 15 | 71.4 | 29 | 38.2 | 21 | 22.6 | 18 | 22.0 | 83 | 30.5 |
| [4–9 years] | 2 | 9.5 | 27 | 35.5 | 30 | 32.3 | 33 | 40.2 | 92 | 33.8 |
| [10 years or more] | 4 | 19.0 | 20 | 26.3 | 42 | 45.2 | 31 | 37.8 | 97 | 35.7 |
Table 3
Descriptive of digital competence level/area of faculties.
| NEWCOMER A1 | EXPLORER A2 | INTEGRATOR B1 | EXPERT B2 | LEADER C1 | PIONEER C2 | ||||||||
|---|---|---|---|---|---|---|---|---|---|---|---|---|---|
| n | % | n | % | n | % | n | % | n | % | n | % | ||
| Digital Competence Level of Faculties | Female | 7 | 2.6 % | 35 | 12.9 % | 47 | 17.3 % | 56 | 20.6 % | ||||
| Male | 14 | 5.1 % | 41 | 15.1 % | 46 | 16.9 % | 26 | 9.6 % | |||||
| Area 1: Professional Engagement | Female | 5 | 1.8 % | 20 | 7.4 % | 39 | 14.3 % | 81 | 29.8 % | ||||
| Male | 4 | 1.5 % | 30 | 11.0 % | 47 | 17.3 % | 46 | 16.9 % | |||||
| Area 2: Digital Resources | Female | 1 | 0.4% | 4 | 1.5 % | 8 | 2.9 % | 22 | 8.1 % | 53 | 19.5 % | 57 | 21.0 % |
| Male | 4 | 1.5 % | 13 | 4.8 % | 30 | 11.0 % | 47 | 17.3 % | 33 | 12.1 % | |||
| Area 3: Teaching and Learning | Female | 4 | 1.5 % | 19 | 7.0 % | 48 | 17.6 % | 74 | 27.2 % | ||||
| Male | 14 | 5.1 % | 23 | 8.5 % | 48 | 17.6 % | 42 | 15.4 % | |||||
| Area 4: Assessment | Female | 4 | 1.5 % | 19 | 7.0 % | 42 | 15.4 % | 34 | 12.5 % | 46 | 16.9 % | ||
| Male | 4 | 1.5 % | 29 | 10.7 % | 39 | 14.3 % | 32 | 11.8 % | 23 | 8.5 % | |||
| Area 5: Empowering Learners | Female | 1 | 0.4% | 10 | 3.7 % | 23 | 8.5 % | 35 | 12.9 % | 38 | 14.0 % | 39 | 14.3 % |
| Male | 9 | 3.3 % | 35 | 12.9 % | 40 | 14.7 % | 21 | 7.7 % | 21 | 7.7 % | |||
| Area 6: Facilitating Learners’ Digital Competence | Female | 2 | 0.7% | 5 | 1.8 % | 18 | 6.6 % | 50 | 18.4 % | 38 | 14.0 % | 32 | 11.8 % |
| Male | 3 | 1.1% | 6 | 2.2 % | 34 | 12.5 % | 41 | 15.1 % | 26 | 9.6 % | 17 | 6.3 % | |
Table 4
Descriptive of the faculty members’ access to technology and support, their perception of distance education, self-efficacy, error eversion, error management, and digital competence points of faculties.
| DESCRIPTIVE | n | MEAN | STANDARD DEVIATION | |||
|---|---|---|---|---|---|---|
| FEMALE | MALE | FEMALE | MALE | FEMALE | MALE | |
| Access to technology and support | 145 | 127 | 3.92 | 3.89 | 0.91 | 0.80 |
| Perception of distance education | 145 | 127 | 3.35 | 3.13 | 0.88 | 0.88 |
| Self-efficacy | 145 | 127 | 4.33 | 4.42 | 0.65 | 0.58 |
| Error management | 145 | 127 | 3.58 | 3.52 | 0.69 | 0.70 |
| Digital competence points | 145 | 127 | 74.00 | 67.50 | 15.10 | 14.50 |
Table 5
Correlations between measures.
| DIGITAL COMPETENCE | ERROR MANAGEMENT CULTURE | ACCESS TO TECHNOLOGY AND SUPPORT | PERCEPTION OF DISTANCE EDUCATION | SELF-EFFICACY | ||
|---|---|---|---|---|---|---|
| Digital Competence | Pearson’s r | — | ||||
| p-value | — | |||||
| Error Management | Pearson’s r | 0.177** | — | |||
| p-value | 0.003 | — | ||||
| Access to Technology and Support | Pearson’s r | 0.088 | 0.451*** | — | ||
| p-value | 0.148 | < .001 | — | |||
| Perception of Distance Education | Pearson’s r | 0.395*** | 0.181** | 0.311*** | — | |
| p-value | < .001 | 0.003 | < .001 | — | ||
| Self-Efficacy | Pearson’s r | 0.478*** | 0.149* | 0.238*** | 0.375*** | — |
| p-value | < .001 | 0.014 | < .001 | < .001 | — |
[i] Note. * p < .05, ** p < .01, *** p < .001