
Table 1
Descriptive and inferential statistics of course materials cost measures by Pell grant recipient status.
| TOTAL M(SD) | PELL-GRANT RECIPIENTS M(SD) | NON-PELL GRANT RECIPIENTS M(SD) | F STATISTIC | p VALUE | |
|---|---|---|---|---|---|
| Importance of course materials cost when registering for courses (1–5) | 3.46(1.15) | 3.76(1.05) | 3.32(1.17) | 9.85 | .002 |
| Minutes searching for money saving options on course materials | 61.65(54.01) | 67.79(72.75) | 58.65(41.84) | 1.76 | .19 |
| Cost of course materials per semester | 277.78(189.17) | $271.04(187.79) | $281.00(190.21) | .18 | .67 |
| Stress of the cost of materials (1–10) | 6.32(2.36) | 6.77(2.22) | 6.10(2.40) | 5.37 | .02 |
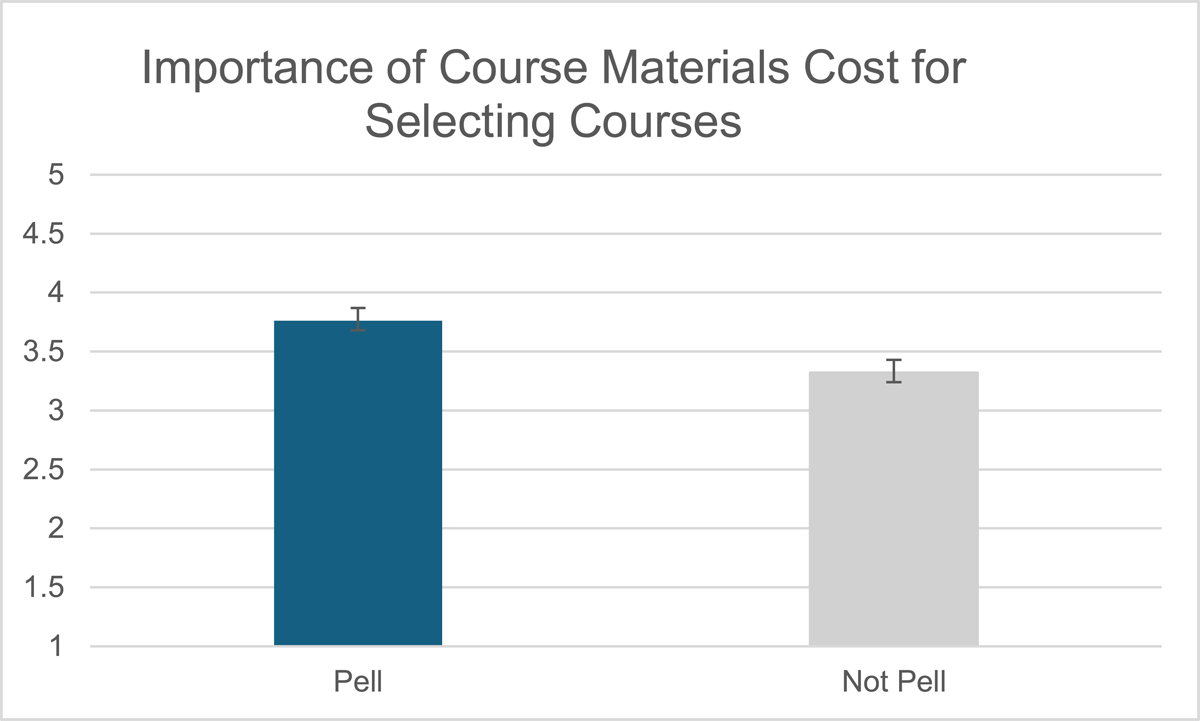
Figure 1
Bar graph of the importance of course materials costs for selecting courses by Pell grant recipient status.
Note: Error bars are +1/–1 standard error.
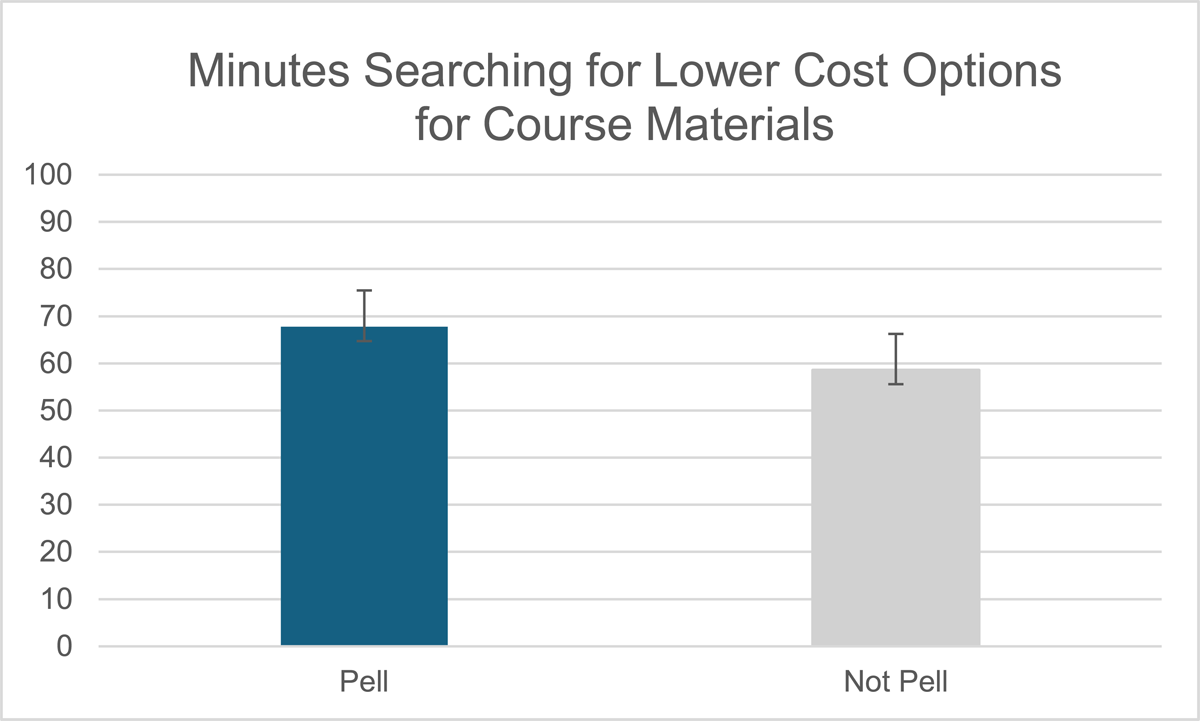
Figure 2
Bar graph of minutes searching for lower cost options for course materials by Pell grant recipient status.
Note: Error bars are +1/–1 standard error.
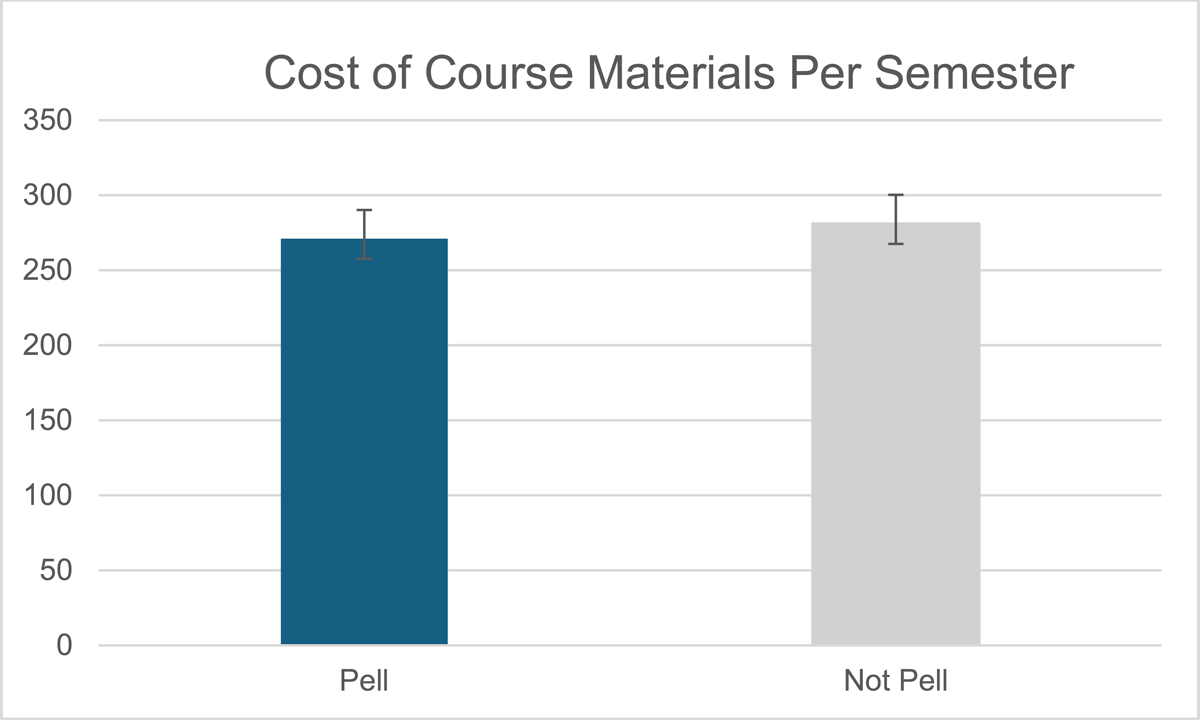
Figure 3
Bar graph of the dollars spent on course materials per semester by Pell grant recipient status.
Note: Error bars are +1/–1 standard error.
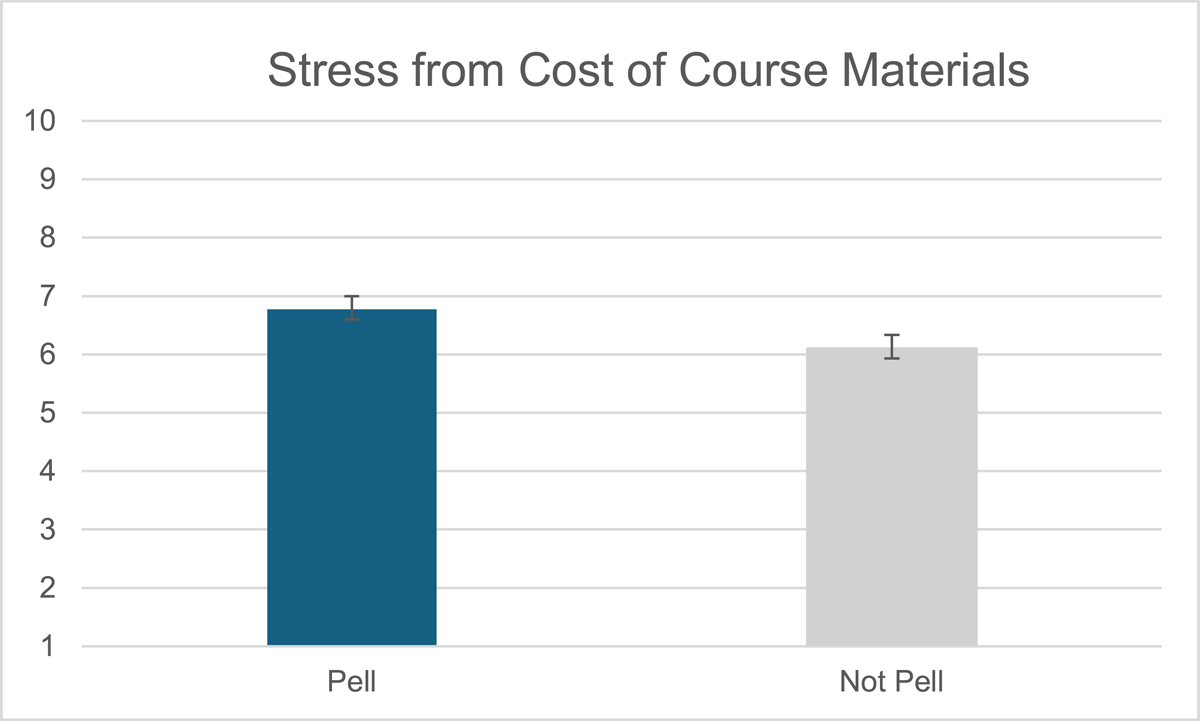
Figure 4
Bar graph of the stress due to the cost of course materials by Pell grant recipient status.
Note: Error bars are +1/–1 standard error.
Table 2
Descriptive and inferential statistics of dichotomous measures by Pell grant recipient status.
| TOTAL | PELL-GRANT RECIPIENTS | NON-PELL GRANT RECIPIENTS | PEARSON CHI-SQUARE | p VALUE | |
|---|---|---|---|---|---|
| Ever search for cost-saving options for course materials | 93.7% | 94.8% | 93.2% | .61 | .74 |
| Ever intentionally select a course with no or low cost materials | 32.9% | 38.1% | 30.4% | 1.83 | .40 |
| Used course marking | 11.7% | 16.9% | 9.4% | 5.18 | .08 |
| Plan to use course marking in the future | 53.5% | 58.8% | 50.9% | 2.40 | .30 |
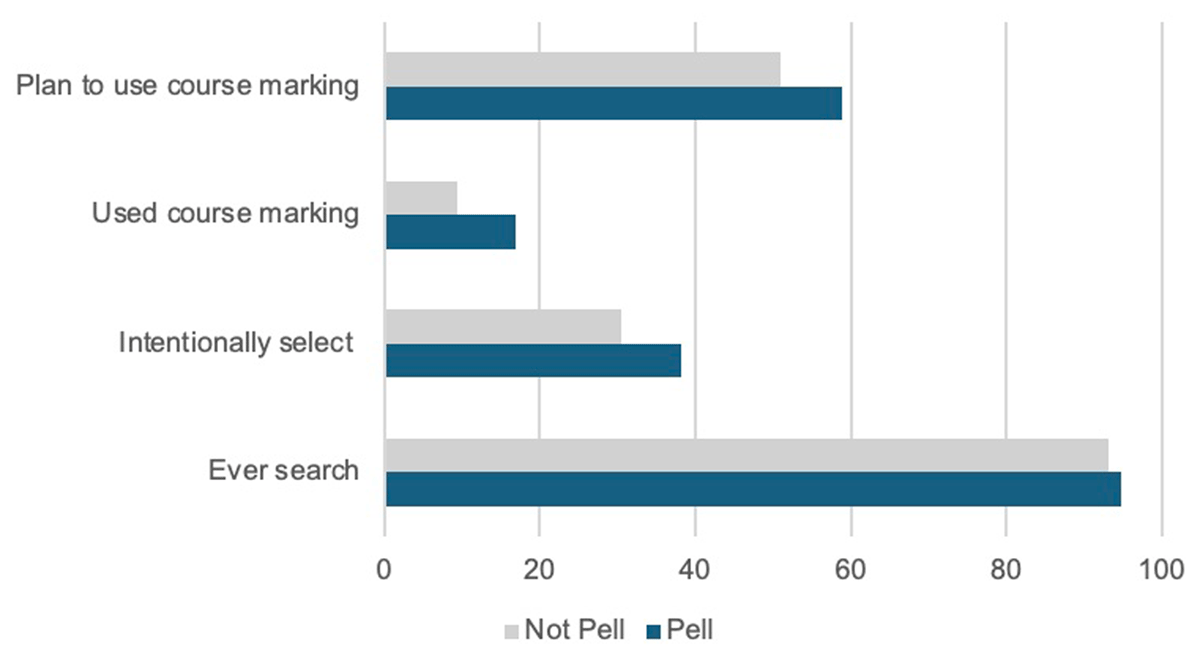
Figure 5
Bar graphs of percentage agreement with yes/no response measures by Pell Grant recipient status.
Note: No error bars due to frequency data.
Table 3
Reasons why course marking was not used.
| TOTAL | PELL RECIPIENTS | NON-PELL RECIPIENTS | |
|---|---|---|---|
| Wasn’t aware of the filter | 71.9% | 69.5% | 71.6% |
| Didn’t understand how to use the filter | 4.3% | 4.3% | 4.3% |
| Not concerned about the cost of materials | 9.1% | 8.6% | 9.4% |
| Already knew the classes needed | 45.6% | 33.2% | 50.9% |
| Other (example responses) | 7.5% | 5.8% “If the classes are required for graduation, there is no point in looking for classes with low cost or inexpensive textbooks.” “My required courses did not offer low cost materials.” | 8.2% “The classes I needed were not zero cost.” “College registered for me.” |
[i] Note: Students could select multiple options. Totals may add up to more than 100%.