
Introduction
The challenges of the cost of course materials in college, such as textbooks, have been well documented for students in public institutions, but less is known about students at private, nonprofit (independent) institutions (Bay View Analytics, 2024; Florida Virtual Campus, 2022; VIVA, 2021). This is unfortunate because like their counterpart peers at public institutions, many private college students also have financial challenges that may interfere with their education goals (Cuy Castellanos & Holcomb, 2020). Indeed, nearly 30% of students who receive funding from the United States government due to economic disadvantages attend private institutions (Hanson, 2024). One method to reduce the financial burden of a postsecondary education is to offer courses with free and/or low cost learning materials. Often, these materials are open educational resources (OER), which are generally available without access fees due to their licensing (Green, 2017). To assist students in identifying courses with no or low cost for materials, many institutions (generally public) have started course marking initiatives in which students can use filters to search for no/low cost materials in the course schedule (Ainsworth et al., 2020a). However, despite the use of course marking in many institutions, there is limited research evidence published about how students use these systems (see McNulty et al., 2023 for an exception). The purpose of this study is to examine private, independent college students’ experiences with the cost of course materials. In addition, student use of a course marking initiative at private colleges will be examined.
Literature Review
Private college students may be stereotyped as from affluent families, but many struggle with financial stressors (Cuy Castellanos & Holcomb, 2020). For example, 18.8% of students at private, nonprofit colleges report food insecurity (McKibben et al., 2023). Most private college students (83.5%) in the United States receive some form of federal financial aid, and the Council of Independent Colleges reports that independent colleges and universities offer students seven times what they receive in Pell Grants (Cameron et al., 2023; Council of Independent Colleges, 2022). However, 75% of private college students have reported that they still do not have sufficient financial aid to cover the cost of course materials (Appedu et al., 2021). Related to this, 67% of private college students have not purchased a required textbook because of the cost (VIVA, 2021). Students often forgo purchasing course materials even if they aware of academic consequences, such as lower grades, because they simply cannot afford the materials (Martin et al., 2017; Wittkower & Lo, 2020). Nearly all private college students reported engaging in cost saving techniques such as looking for less expensive versions online, using campus library resources, or sharing with classmates (Appedu et al., 2021; Murphy & Rose, 2018; VIVA, 2021).
One method to address the cost of course materials in college is through the adoption of open educational resources or other no or low-cost materials. Open educational resources (OER) are teaching and learning resources that have flexible licensing that allows them to be free to access and edit, retain, and share (Hewlett Foundation, 2024). No cost (also called zero cost) materials include resources students are able to access without additional cost through their campus libraries, government materials, and other resources that typically have restrictive licenses. Low cost materials vary in definition by institution but typically indicate that the course materials are not free, but are below a certain cost, such as 50 US dollars (Ainsworth et al., 2020b). Most research evidence has focused on OER specifically with student grades in OER courses being similar to grades in courses with expensive commercial materials (Clinton & Khan, 2019; Hilton, 2020; Tlili et al., 2023). Moreover, students who have OER courses appear to enroll in more credits per term, higher course completion rates, and subsequently have faster progress towards degree completion than their peers without OER courses (Cho & Permzadian, 2024; Clinton-Lisell, 2023; Griffiths et al., 2022). This may be because students are able to reallocate money towards additional courses that would have been spent on course materials (Ikahihifo et al., 2017). Indeed, 36% of private college students reported taking fewer courses because of the cost of course materials (VIVA, 2021).
Pell grant recipients
The cost of course materials has been understandably shown to impact students who are economically disadvantaged differently than their more affluent peers. In the United States, Pell grant recipient status is considered a useful proxy for socioeconomic status in research on postsecondary students (e.g., Mead et al., 2020; Rosinger et al., 2020; Warshaw et al., 2021). Pell grants are funding provided to students that do not need to be repaid and are only awarded to undergraduate college students who have substantial financial need (US Department of Education, 2022). Pell grant recipients tend to enroll in private institutions at rates similar to their peers who are not Pell eligible (Carruthers & Welch, 2019). However, their experiences in these institutions are not the same. Only 56.4% of Pell grant recipients at private institutions graduate in six years compared to 64% of non-Pell grant recipients (Wright-Kim et al., 2022). Specific to course materials, more Pell grant recipients (33%) at a private college reported not purchasing all required materials that term because of the cost compared to their non-Pell grant recipient peers (25%; Appedu et al., 2021). Not surprising given the differences in purchasing materials, the same study also found 27% of Pell grant recipients that they struggled academically because they could not afford course materials compared to 15% of their non-Pell grant recipient peers (Appedu et al., 2021). Likely due to differences in economic backgrounds, students who received Pell grants expressed a stronger desire to have OER rather than commercial textbooks compared to their peers who do not receive Pell grants (Read et al., 2020). Given the financial barriers to required expensive course materials, it is not surprising that Pell grant recipients at a selective public university had better grades in courses with OER than in courses with expensive course materials (Colvard et al., 2018).
Course marking
It can be challenging for students to know the cost of course materials when they register for courses (Freed et al., 2018). To alleviate this challenge, some institutions have begun a practice of indicating courses in the student information system (e.g. Banner) that are no-cost or low-cost (Ainsworth et al., 2020a) by assigning specific, searchable attributes known as course marking. This is done in a similar manner to course marking to indicate courses that fulfill requirements. Institutions with such practice include individual community colleges, individual public universities, public systems of postsecondary institutions such as the Connecticut State Colleges & Universities, City University of New York system and University System of Georgia, and private institutions such as Embry-Riddle Aeronautical University (Affordable Learning Georgia, n.d.; City University of New York, 2024; Embry-Riddle Aeronautical University, 2024; Piedmont Virginia Community College, n.d.; Portland State University, 2021; see Ainsworth et al., 2020b for case studies). Notably, several state governments have enacted legislation or policies mandating the practice of marking courses with no and/or low cost materials (Ainsworth et al., 2020c; Chae et al., 2019). One study on course marking across multiple public community colleges and universities in Oregon found that enrollment was somewhat higher in courses marked as no or low cost compared to courses that did not have such a designation (McNulty et al., 2023). This study also noted that the percentage of Pell-grant eligible students was greater in courses designated as no or low cost compared to other courses (McNulty et al., 2023). However, despite the number of institutions that provide course marking, including entire states with course marking mandates, there are only a few reports of student use of course marking (Freed et al., 2018; McNulty et al., 2023). Ultimately, course marking as a process has the potential to amplify redistributive justice (Rawls, 1971; Lambert, 2018) and student agency (Dewey,1922; Vygotsky, 1978; Bandura, 1986, 2001) by creating transparent systems that allow students to easily identify at the point of registration which course sections utilize OER or other no or low cost learning materials.
Following advice by Ainsworth and colleagues (2020b) a student survey was used to provide descriptive information about student use of course marking. Such surveys are useful for understanding student use of course marking and, importantly, why students may not use course marking. For example, a student survey found that students did not understand the term OER and subsequently did not use the filter marking courses as OER (Freed et al., 2018). Another survey found that students mistakenly thought OER indicated an online course and purposefully avoided courses marked as OER even if they were offered face to face (Dario-Becker, 2020). Student surveys have also found that students were unaware of the course marking filter available at their institution (McKinney & Fiddler, 2020).
Our inquiry into course materials cost and course marking based on cost at private, independent institutions is grounded in the SCOPE framework (Clinton-Lisell et al., 2023). The SCOPE framework may be used to organize the concepts of Social justice, Cost, Outcomes, Perceptions, and Engagement in open education research. The current study incorporates the components of social justice, cost, and engagement. In terms of social justice, the current study is particularly focused on redistributive justice, that is, improving access to resources particularly for those who have historically encountered barriers to these resources (Rawls, 1971; Lambert, 2018). For cost, the financial cost of materials is considered, but cost in a broader sense is also examined. Namely, the cost of time to find methods of saving money (Katz, 2019) and the stress due to expensive materials (emotional cost). Finally, engagement with the course marking based on materials cost will be examined in terms of students’ use of the filter when registering for courses.
Research questions
What were the overall experiences with cost of materials for students at small private colleges and how did these experiences vary between Pell-eligible and non-Pell eligible students?
How was course marking used and how did use of course marking vary between Pell-eligible and non-Pell eligible students?
Methods
Context
This research was a quantitative survey design (Creswell, 2004). This research was commissioned by the New England Board of Higher Education (NEBHE), a non-profit, regional education compact that works across the six New England states to help leaders to, among other goals, promote regional cooperation and programs that encourage the efficient use and sharing of educational resources; and promote equitable access to free, high-quality postsecondary learning materials. Faculty and administrators on NEBHE’s regional advisory committee have stated a need for students to be able to identify courses that utilize OER and other learning materials that have no associated direct costs (e.g., copyrighted but freely accessible materials like library resources or other content on the web).
NEHBE received a grant from the William and Flora Hewlett Foundation to fund the implementation of no-cost course marking at four independent institutions in the Northeast. Private, independent college were selected because these institutions, which comprise 61% of all New England’s institutions of higher education, are being left behind in many major open education initiatives, even though many serve students with significant financial need (Cameron et al., 2023). Through a re-grant program, NEBHE provided grants of $20,000 each to four independent postsecondary institutions to fund course marking. Institutions were asked to voluntarily disseminate an IRB-approved survey to the student body. IRB approval was obtained at both authors’ institutions (University of North Dakota and Roger Williams University) and permission to distribute the surveys at each participating institution was also obtained by each IRB.
Particpants
College students (N = 316) at the four participating institutions participated in the survey. They received a $20 gift card as an incentive. In terms of gender identity, 2 indicated they were gender fluid, 61 indicated they were men or cisgender men, 3 indicated they were nonbinary, 2 indicated they were transgender men, 194 indicated they were women or cisgender women, and the remaining participants preferred not to answer. Regarding racial and ethnic identity, 9 indicated they were Asian, 19 indicated they were Black/African American, 3 indicated they were Native American, 8 indicated they were Hispanic/Latino/Latina/Latinx, 210 indicated they were white, 4 indicated more than one racial/ethnic identity, and the remaining participants preferred not to answer. Regarding financial aid, 97 indicated they received Pell grants and 219 indicated they did not receive Pell grants. Data are publicly available on Open Science Framework (Clinton-Lisell, 2024).
Data collections tools
The survey instrument had 34 items. It began by asking students to rate the importance of a variety of factors when considering which courses to register on a Likert scale of 1–5 with one being not at all important and 5 being extremely important. Participants were then asked if they searched for options to save money on courses. If they indicated yes, then they indicated the number of minutes on such activities. Students were also asked how much they spent on course materials in a given semester about their perceptions of the cost of course materials. If they indicated they had ever had a course with no or low cost materials, then they were then prompted to answer three items about the quality of the materials in these courses on a Likert scale of 1–5 with higher scores indicating higher quality. The survey instrument is publicly available on Open Science Framework (Clinton-Lisell, 2024).
For the course marking section of the survey, students were shown a screenshot of how course marking appears in their specific institution’s registration system. They were then asked about their awareness of course marking. If they were aware, they were asked to indicate how they were made aware. Students were then asked if they used course marking. If so, they indicated why. If not, they were asked to indicate why not. Students were asked if they expected to use course marking in the future and to explain why. Finally, students were asked to report their demographics and given the opportunity to provide comments about course marking.
Research procedures
Students were emailed invitations to participate in the survey through their institutions. A link to the Qualtrics survey was provided in the email. After indicating consent, students completed the survey. At the end of the survey was a link to request the gift card as a thank you for participating.
Findings
Experiences with cost of materials
To answer the first research question, “What were the overall experiences with cost of materials for students at small private colleges and how did these experiences vary between Pell-eligible and non-Pell eligible students” a series of one-way ANOVAs were conducted with continuous measures relevant to the cost of course materials as the dependent variables and Pell-grant recipient status (yes or no) as the independent variable. The means across the sample were compared to examine the overall experiences. ANOVA was chosen because it may be used to compare group differences (Pell grant recipients and non-Pell grant recipients) on continuous measures (such as those in Table 1). Levene’s statistic was used to assess homogeneity of variance with sufficient normality found (all p values were above .05). Outliers were a concern for the open response minutes and cost measures. With the restricted range of the rating scale measures (“Importance of course materials cost when registering for courses” and “Stress of the cost of materials”) there was little concern about outliers. All data were examined for potential outliers, however, all data points were plausible and there was no indication that outliers could be driving the noted group differences (e.g., there were similar distributions of outliers in both groups). Therefore, in the interest of keeping valid responses (Sullivan et al., 2021), all data were analyzed. Any missing data due to unresponded to items were not used in analysis.
Table 1
Descriptive and inferential statistics of course materials cost measures by Pell grant recipient status.
| TOTAL M(SD) | PELL-GRANT RECIPIENTS M(SD) | NON-PELL GRANT RECIPIENTS M(SD) | F STATISTIC | p VALUE | |
|---|---|---|---|---|---|
| Importance of course materials cost when registering for courses (1–5) | 3.46(1.15) | 3.76(1.05) | 3.32(1.17) | 9.85 | .002 |
| Minutes searching for money saving options on course materials | 61.65(54.01) | 67.79(72.75) | 58.65(41.84) | 1.76 | .19 |
| Cost of course materials per semester | 277.78(189.17) | $271.04(187.79) | $281.00(190.21) | .18 | .67 |
| Stress of the cost of materials (1–10) | 6.32(2.36) | 6.77(2.22) | 6.10(2.40) | 5.37 | .02 |
The findings in Table 1 and presented in Figure 1 show that Pell grant recipients perceived more importance of course materials cost when registering for courses than did non-Pell grant recipients (p = .002). Additionally, as can be noted in Figure 4, Pell grant recipients reported higher levels of stress due to the cost of course materials than did non-Pell grant recipients (p = .02). However, no significant differences were found for the time spent searching for money-saving options, (p = .19), nor for the cost of course materials per semester (p = .67), see Figures 2 and 3.
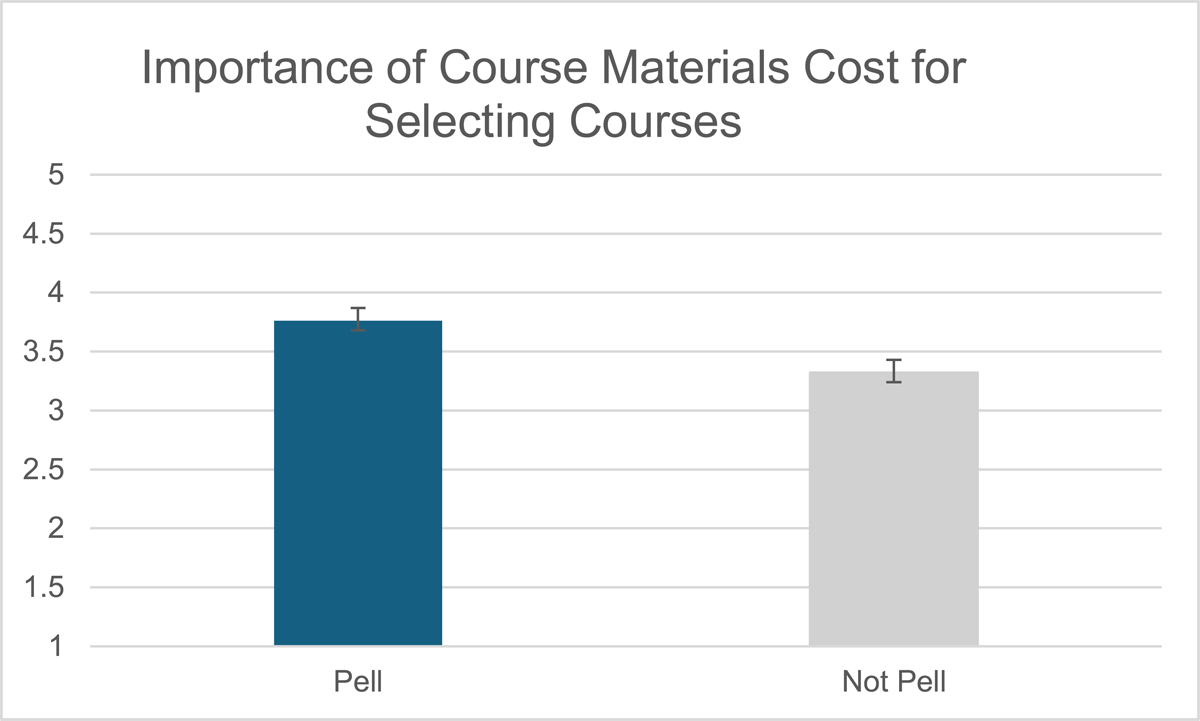
Figure 1
Bar graph of the importance of course materials costs for selecting courses by Pell grant recipient status.
Note: Error bars are +1/–1 standard error.
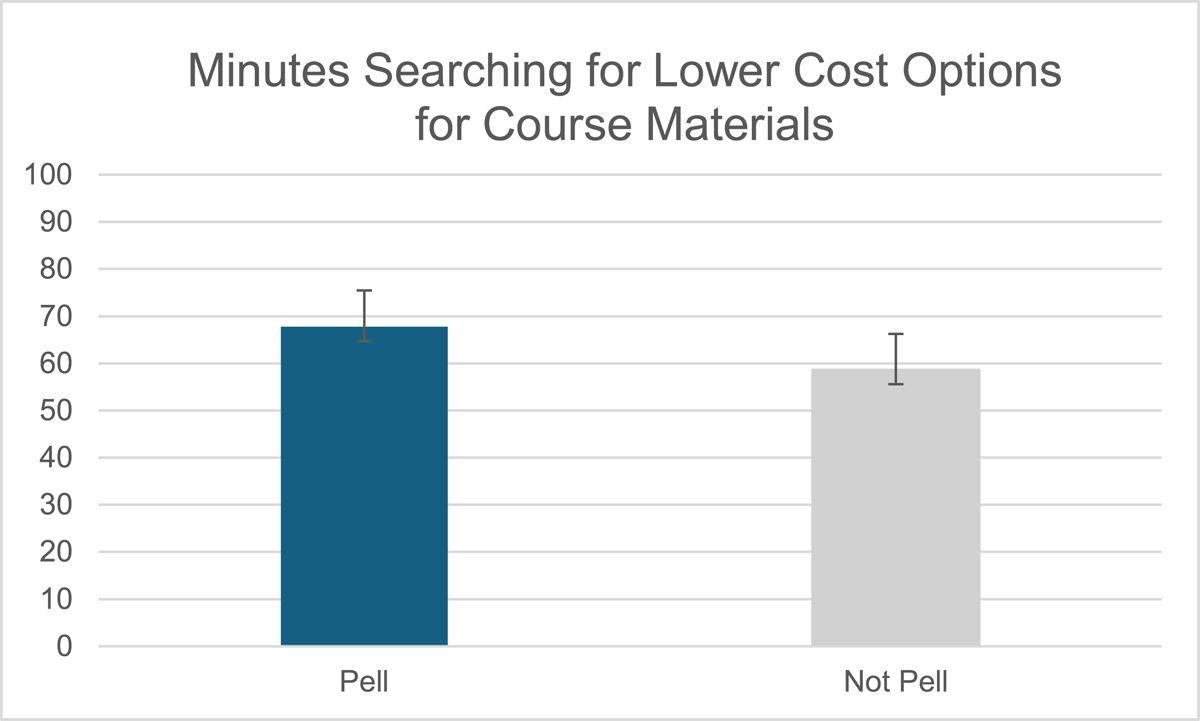
Figure 2
Bar graph of minutes searching for lower cost options for course materials by Pell grant recipient status.
Note: Error bars are +1/–1 standard error.
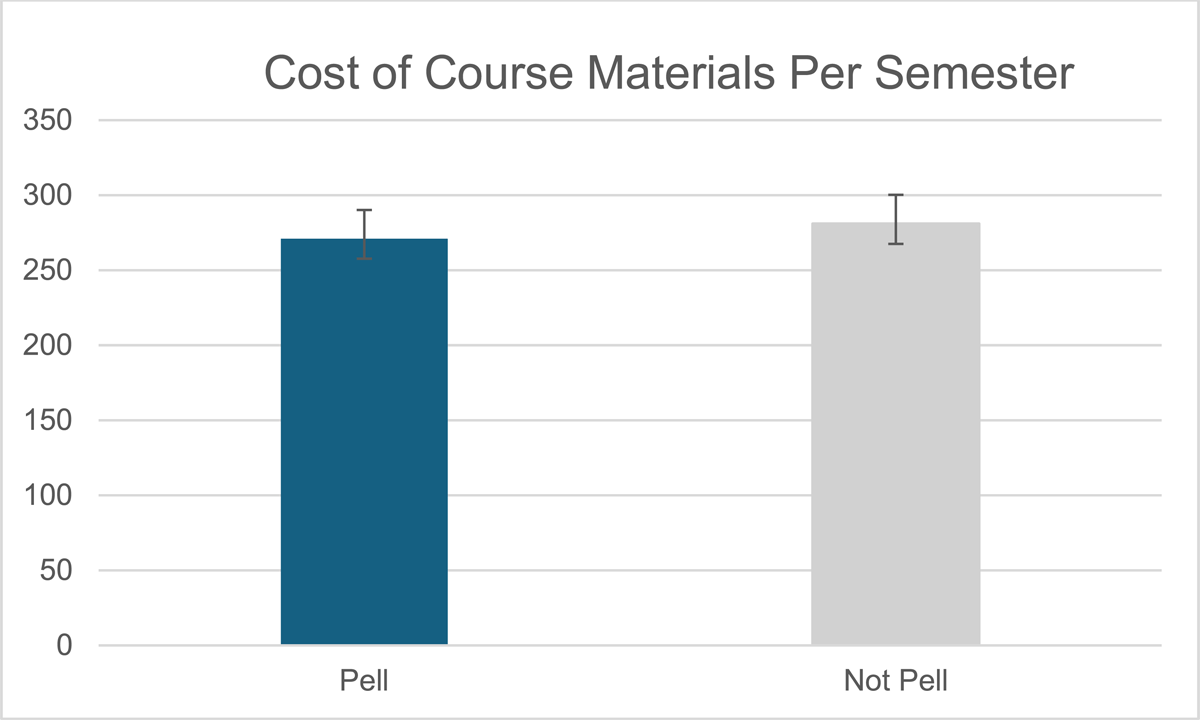
Figure 3
Bar graph of the dollars spent on course materials per semester by Pell grant recipient status.
Note: Error bars are +1/–1 standard error.
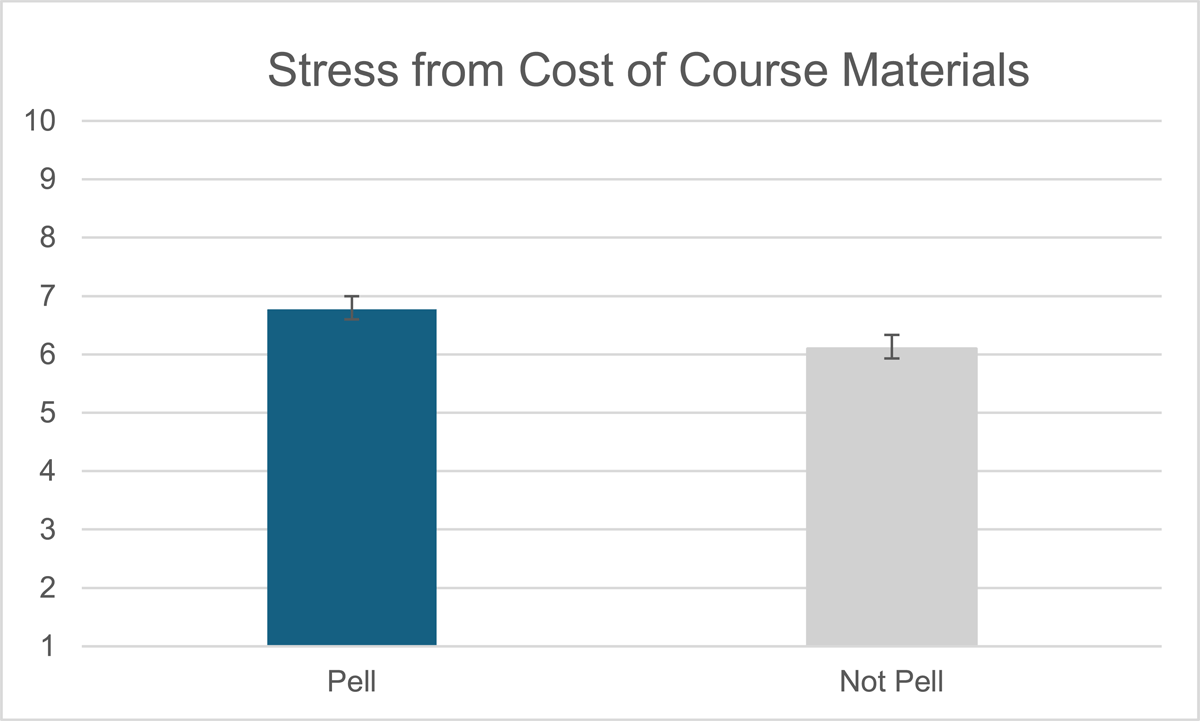
Figure 4
Bar graph of the stress due to the cost of course materials by Pell grant recipient status.
Note: Error bars are +1/–1 standard error.
For dichotomous (yes or no) measures, chi-square analyses were conducted to test if distributions differ for students who were Pell grant recipients compared to students who do not receive Pell grants. Pearson chi-square was chosen as the statistical test as both the independent variables (Pell grant recipient status) and dependent variables (see Table 2) were categorical and none of the cells had fewer than five values. There are no assumptions in chi-square testing regarding the normality of the data distributions (McHugh, 2013). Students who indicated “I prefer not to answer” for the response 1were not included in the statistics reported in Table 2.
Table 2
Descriptive and inferential statistics of dichotomous measures by Pell grant recipient status.
| TOTAL | PELL-GRANT RECIPIENTS | NON-PELL GRANT RECIPIENTS | PEARSON CHI-SQUARE | p VALUE | |
|---|---|---|---|---|---|
| Ever search for cost-saving options for course materials | 93.7% | 94.8% | 93.2% | .61 | .74 |
| Ever intentionally select a course with no or low cost materials | 32.9% | 38.1% | 30.4% | 1.83 | .40 |
| Used course marking | 11.7% | 16.9% | 9.4% | 5.18 | .08 |
| Plan to use course marking in the future | 53.5% | 58.8% | 50.9% | 2.40 | .30 |
As can be seen in Table 2, most students (93.7%) reported engaging in cost saving measures for course materials. Approximately one third of students (32.9%) have purposefully chosen a course based on the cost of the materials. The use of course marking was rather low (11.7% of students); however, over half of students plan to use course marking when they register for classes in the future (53.5%). There were no reliable differences due to Pell grant recipient status for any of these measures (see Figures 4 and 5 for bar graphs).
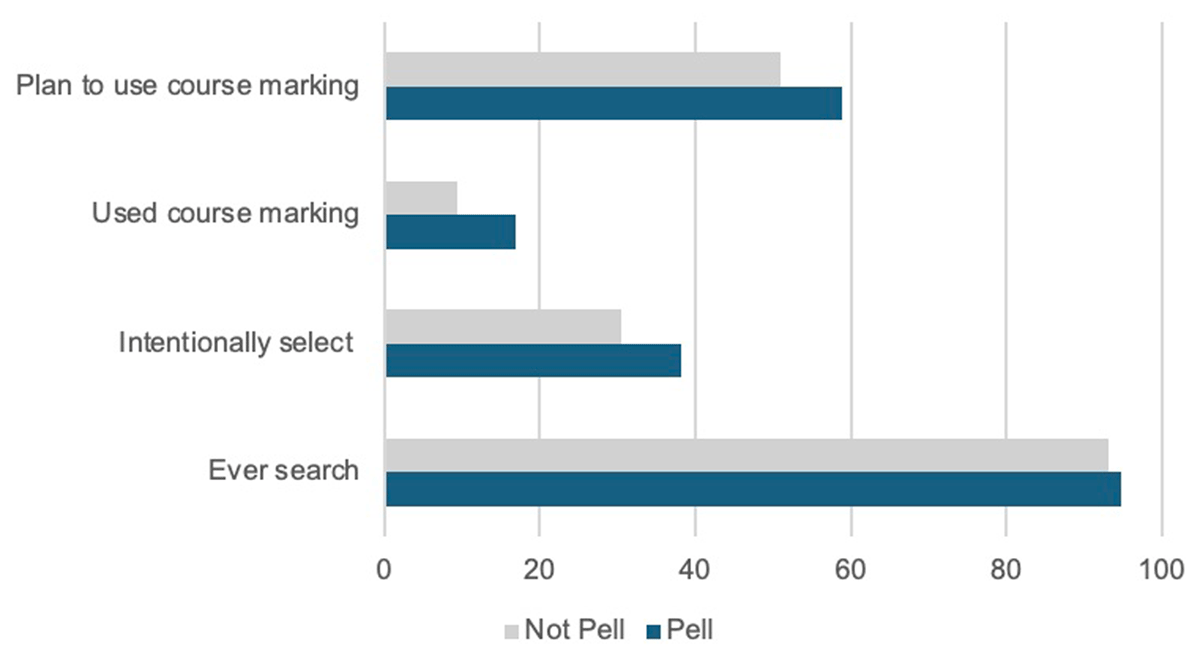
Figure 5
Bar graphs of percentage agreement with yes/no response measures by Pell Grant recipient status.
Note: No error bars due to frequency data.
Reasons for not using course marking
To further investigate the reasons course marking was not used, the frequencies of responses were reported in Table 3. Because multiple responses were allowed, chi square analyses cannot be conducted to test for differences in response frequencies based on student Pell grant recipient status. Therefore, percentages of responses are reported, but statistical tests to compare students based on Pell Grant recipient status are not possible. Participants had the option to indicate “other” and write their responses if they learned about course marking from a source not mentioned. Examples of “other” responses are provided in Table 3. Because the student responses for “other” were so varied, percentages of each response were not calculated and instead the percentage of “other” responses are reported as a group in Table 3.
Table 3
Reasons why course marking was not used.
| TOTAL | PELL RECIPIENTS | NON-PELL RECIPIENTS | |
|---|---|---|---|
| Wasn’t aware of the filter | 71.9% | 69.5% | 71.6% |
| Didn’t understand how to use the filter | 4.3% | 4.3% | 4.3% |
| Not concerned about the cost of materials | 9.1% | 8.6% | 9.4% |
| Already knew the classes needed | 45.6% | 33.2% | 50.9% |
| Other (example responses) | 7.5% | 5.8% “If the classes are required for graduation, there is no point in looking for classes with low cost or inexpensive textbooks.” “My required courses did not offer low cost materials.” | 8.2% “The classes I needed were not zero cost.” “College registered for me.” |
[i] Note: Students could select multiple options. Totals may add up to more than 100%.
As can be seen in Table 3, not being aware of the filter for course marking was by far the most common reason for not using it (71.9% of all students) followed by already knowing the courses needed for registration (45.6% of all students). Only 9.1% of students indicated they were not concerned about the cost of course materials, which would imply most students were indeed concerned. Only a small percentage indicated that they did not understand how to use the filter (4.3%). However, this number may have been larger had more students known about the filter and not already knew the classes they needed. Although there is not a method of testing statistical signficance, there is a notable descriptive differences based on Pell grant recipient status for how many students indicated they already knew the classes needed. About one third of Pell grant recipients (33.2%) indicated they already knew their classes needed compared to slightly over half of non-Pell grant recipients (50.9%).
Discussion
The purpose of this study was to examine issues relevant to the cost of course materials for private college students. In addition, college students’ use of a novel course marking system to designate courses based on the cost of materials was examined. Of particular interest from a redistributive justice standpoint was how these issues differed for students based on their economic backgrounds (see Rawls, 1971; Lambert, 2018). In doing so, the cost of materials in terms of money, time, and stress were considered. Students who were economically disadvantaged (based on assumptions with their Pell grant recipient status) indicated higher importance and levels of stress related to the cost of course materials than did their peers who were not Pell grant recipients. The financial and time costs of course materials per semester did not differ reliably based on Pell grant recipient status. There were no reliable differences in use or planned use of course marking based on Pell grant recipient status. However, over half of students indicated that they planned to use course marking in the future when they register for classes (58.8% Pell grant recipient and 50.9% non-Pell grant recipient).
Overall, the findings highlight how course materials incurs notable cost in different manners. The financial cost is similar to a previous study at a private college in which students reported not being able to afford materials and incurring academic consequences due to not affording materials (Appedu et al., 2021). Nearly all students indicated that they spent time searching for ways to save money on course materials. These findings are consistent with those from a public university in terms of the cost of time when courses have expensive required materials (Katz, 2019). In addition, students reported a moderate degree of stress due to the cost of course materials. Notably, the stress from the cost of materials was greater for students who were Pell grant recipients. This builds on previous findings focused on Pell recipient students in which Pell grant recipients were less likely to purchase all of their required materials (Appedu et al., 2021). Moreover, Pell grant recipients had better academic perforrmance in courses with OER than commercial materials (Colvard et al., 2018), which is likely related to Pell grant recipient students being more likely to report negative academic consequences (namely lower grades) due to not being able to afford required materials (Appedu et al., 2021). Taken together, these findings indicate that relieving the cost of course materials would likely enhance redistributive justice, particularly for students from economically disadvantaged backgrounds. Private, independent institutions may use these findings to develop policies to promote OER adoption.
In general, only a minority of students used the course marking filter to register for courses. When asked why it was not used, over two thirds of students indicated that they were not aware that the filter was an option. Institutions may use this finding to inform policies on communication about course marking. Without students knowing about course marking, course marking will not be used and potential benefits will not be achieved. Notably, case studies of other course marking initiatives have noted difficulty with communicating the feature to students (Ainsworth et al., 2020d; McKinney & Fiddler, 2020). Another common issue was that students already knew the courses they needed to take. Relatedly, students commented that if a course was required, they needed to take it no matter how much the materials cost. Policy solutions to this would be to encourage more OER adoption or provide more options for courses that fulfill requirements to graduate. Only a small number reported not knowing how to use the filter. However, since most students did not know about the filter or already knew their classes, it is possible that not knowing how to use the filter could be a barrier to using course marking. Therefore, even though only small percentage reported not knowing how to the use the filter, institutions should request feedback from students to check the useable of course marking filters.
Conclusion
The cost of course materials continues to be an important issue for college students. The findings from the current study indicate that private college students have costs of time, money, and stress due to required course materials. The cost of stress is more pronounced for students from economically disadvantaged backgrounds. Course marking in which the cost of materials is designated on course schedules may help alleviate this issue. However, students need to be informed about the option to filter courses based on materials costs and there needs to be adequate offerings of courses without expensive materials.
Data accessibility statement
The survey instrument and the datasets generated and analysed during the current study are available in the Open Science Framework repository, https://osf.io/zxwgy.
Author’s contributions (CRediT)
Virginia Clinton-Lisell: Conceptualization, Data curation, Formal Analysis, Investigation, Methodology, Resources, Writing – original draft, Writing – review & editing. Lindsey Gwozdz: Conceptualization, Funding acquisition, Investigation, Methodology, Project administration, Validation, Writing – original draft, Writing – review & editing. All authors have read and agreed to the published version of the manuscript.
Ethics and consent
Please identify whether ethical approval was obtained for the work described in this article. If not, please identify whether a waiver was received, explain any ethical measures, or if an ethics review was not applicable.
Acknowledgements
We thank Liliana Diaz, Annika Many, and Laura Robert-Rivera for helpful feedback on the survey instrument.
Competing Interests
The authors have no competing interests to declare.