
Introduction
Open Educational Resources (OER) are teaching, learning and research materials in any medium – digital or otherwise – that are in the public domain and/or released under an open licence that permits no-cost access, use, adaptation and redistribution by others with no or limited restrictions. They are free at the point of use and ‘free’ in the sense that they provide users with greater freedoms in how resources are shared, used, customised and iterated (UNESCO, n.d.; Hewlett Foundation, 2024; OER Commons, 2024). The UNESCO Recommendation on OER (UNESCO, 2019) was issued to recognise the important contribution OER has to make in supporting access to education and innovative pedagogical practice, and OER are increasingly recognised as a crucial element of future-facing educational ecosystems (Bozkurt et al., 2023).
OER challenge the traditional copyright model and so introduce new possibilities for how teaching and learning are facilitated. OER have long been associated with pedagogical innovation. The most common concept here is the use of OER to improve access to education by lowering the cost of educational materials (Brahim, Khribi & Jemni, 2017; Bohrer et al., 2016; Bossu et al., 2016; Brahim et al., 2020; Blackmon, 2018; Blomgren, 2018; Hameed & El-Ameer, 2020; Henderson & Ostashewski, 2018; Herrera-Cubides et al., 2022; Kopp, Gröblinger & Zimmermann, 2017; Mays, 2020; Mazohl et al., 2018; Wong & Li, 2019) or to reduce costs incurred directly by students (Farrow, Pitt & Weller, 2020; Fischer, Ernst & Mason, 2017; Henderson & Ostashewski, 2018; Hilton, 2020; Hollister & Patton, 2021; Julien et al., 2018). Many OER based innovations consequently begin with the substitution of OER for proprietary materials, either in classrooms or online. However, the affordances of OER can also support innovation behaviours that are subsequent to this initial step. OER can act as a catalyst for innovation, facilitating institutional culture of pedagogical innovation and collaboration as the OER themselves are used as the basis of further creation, co-creation or innovative pedagogical activity (Coughlan et al., 2019; Otto, 2019; Senn et al., 2022; Smirani & Boulahia, 2022).
Despite this, a detailed conceptualisation of the relationship between OER and innovation is lacking in the scientific literature (Guevara-Pezoa, 2023). It is quite common for OER to be referred to as ‘innovative’ or as a catalyst for innovation. However, the extent to which one considers OER as innovative largely depends on existing understandings of OER. For the complete novice, incorporating some form of OER into their pedagogical activity is innovative, while for the experienced user of OER this may be understood as a first step and prerequisite for more unique innovations such as remixes of resources or a shift to open pedagogy (Hegarty, 2015; Tietjen & Asino, 2021). Differentiating these senses of innovation in the research literature is challenging because the keyword ‘innovation’ is used imprecisely and interchangeably. Innovation with OER is also often under- theorised and the language used to describe and evaluate OER innovation is inconsistent. The goal of this study was to develop a conceptual framework for evaluating instances of OER implementation and use this to consistently describe a collection of cases which could illustrate alternative interpretations of what constitutes innovation in the context of OER. There is a clear case for such outcomes because a shared set of concepts and terminology can make it easier to learn from innovative applications of OER and potentially replicate or adapt these in new contexts. This entails using a common language and, hence, moving towards a common understanding in the description of identifiable indicators around innovation. The current lack of such a framework and evidence base can be understood to present a barrier to innovative practice. There is a gap in the understanding of how different factors such as the location, size or maturity of OER implementation affect innovation behaviours. Also of interest was the ways in which different stakeholders conceptualise or communicate the value proposition of OER to their target audiences.
Conceptual Framework
To evaluate and describe instances of innovation consistently and identify outstanding examples of innovation with OER, a rubric was produced. There are no specific theories of OER innovation and much of the language of innovation studies comes from business studies which tend to conceptualise innovation with respect to competitive practices. From such perspectives, innovation is a route to competitive advantage. (It should be noted that many open educators understand what they do as primarily oriented towards collaborative approaches which are in tension with any assumed profit motive.) The research proceeded by identifying existing theoretical constructs which could be mapped onto areas of interest and elaborating a conceptual framework around these. The framework was then used to generate questions which could serve as data points or proxies. This identified a set of indicators which could consistently compare diverse cases across differing contexts of application.
Table 1 summarises the main elements of the conceptual framework.
Table 1
Conceptual Framework.
| AREA OF INQUIRY | CONCEPTS | DATA POINTS |
|---|---|---|
| Basic information about the case | Organisation type, size of user base, OER offer, key challenges faced. | |
| Strategic focus | ‘Defenders and prospectors’ indicators (Miles & Snow, 1978) (Table 2) | Products & services; target group(s); advantage of approach; sustainability & revenue; network; communication channels; value added – for each aspect ‘defender’ or ‘prospector’ is selected. |
| Business model(s) & sustainability | The ENCORE+ OER business model typology is synthesized from Tlili et al. (2020); Padilla Rodriguez et al., (2018); Belleflamme & Jacqmin (2015); Ubachs & Konings (2016); and Farrow (2019). | The ENCORE+ business model typology (Farrow, 2023) describes 14 types (Table 5). |
| Pedagogy & technology | A free text field to describe pedagogical approaches and technologies employed. A list of technologies based on Orr et al. (2018) was provided. | |
| OER implementation | The SAMR framework (Puentedura, 2006) (Table 3) Darwish’s (2019) model of ‘edupreneurship’ (Table 3) | Selecting which stage of OER implementation best reflects the case: substitution, augmentation, modification, or redefinition. These are conceptually mapped to the four stages of Darwish’s model (static; interactive; dynamic; transformative) |
| Stakeholders | ENCORE+ ‘ecosystem’ model for OER stakeholders | UPIG stakeholder model (users, providers, influencers, governance) as a general model provides categories that apply across cases (Figure 3) |
| Barriers and enablers | 27 possible barriers to OER innovation indicated (with facility to add bespoke descriptions) organised into the following categories: practitioner level; organization level; evidence base; technology & infrastructure; community; other | |
| Culture and process | Entrepreneurial and innovation culture in higher education and technology-enhanced learning (Zhu, 2015; Herbig & Dunphy, 1998) | 5 point Likert agreement/disagreement scale for a range of institutional and cultural indicators |
| Impact & diffusion | Diffusion of innovations (Rogers, 2003) | Innovation vectors (relative advantage, compatibility, simplicity, trialability, observability) identified for each stakeholder type (where relevant) (Figure 3) Questions evaluating the perception of success of the OER implementation |
Tables 2, 3, 4 provide more detail on key elements presented in Table 1.
Table 2
Conceptual framing for strategic focus (based on Miles & Snow, 1978).
| CORE ASPECTS | DEFENDER-LIKE APPROACH | PROSPECTOR- LIKE APPROACH |
|---|---|---|
| Products and services | Focus on core institutional educational provision | Focus on provision which is complementary or alternative |
| Target group | Existing markets/learners | New (or nontraditional) markets/learners |
| Communication channels | Traditional | New or innovative channels (physical or virtual) |
| Legacy or new value chain | Making the most of legacy knowledge | Exploration of new approaches and innovation |
| Competitive advantage | Traditional competences (e.g., market knowledge, expertise, improvement of existing technology) | Newer, unfamiliar, competences (e.g., new or emerging technologies, innovation in working practices) |
| Networks | Traditional institutional or cultural | Nontraditional or (dynamic) networks (e.g., alliance, joint-venture) |
| Profitability and sustainability | Cost cutting and efficiencies | New processes to generate revenues, or cost-cutting in existing processes |
Table 3
Conceptual Framing for OER implementation.
| SAMR MODEL (PUENTEDURA, 2006) | OER EDUPRENEURSHIP MODEL (DARWISH, 2019) |
|---|---|
| Substitution: OER substituted for proprietary content with no functional change | Static: This model is content-based (content aggregation & curation) for supplementary use (e.g. repositories, libraries & courseware) |
| Augmentation: Substitution of OER for proprietary content with functional change or task redesign | Interactive: Courses/products for self-study & blended learning (xMOOCs, Edutainment & Games) |
| Modification: OER use allowed for significant redesign of tasks or functions associated with teaching/learning | Dynamic: Online courses/blended learning; learning management system(s) |
| Redefinition: Using OER allowed for new ways of conceiving teaching and/or learning | Transformative: platform with interactive learning environment(s) aligned to marketplace needs |
Table 4
ENCORE+ UPIG stakeholder model and innovation vectors.
| RELATIVE ADVANTAGE(PERCEIVED AS BETTER THAN COMPETITION) | COMPATIBILITY(UNDERSTOOD IN RELATION TO EXISTING PRACTICE) | SIMPLICITY(EASY TO PICK UP THE NEW SERVICE OR PRODUCT) | TRIALABILITY(EASE WITH WHICH TARGET MARKETS CAN TRY SERVICE OR PRODUCT) | OBSERVABILITY(RESULTS ARE VISIBLE OR NOTICEABLE) | |
|---|---|---|---|---|---|
| Users (learners/educators or customers) | |||||
| Governance (management, steering groups, regulators, etc.) | |||||
| Influencers (policymakers, investors, media, trade unions, etc.) | |||||
| Providers (educators, trainers, suppliers, vendors, etc.) |
Table 5
ENCORE+ OER Business Model Typology (Farrow, 2023).
| CATEGORY | BUSINESS MODEL | REVENUE DESCRIPTION |
|---|---|---|
| Externally funded | Donations Model | Funding from donations or grants, e.g., foundations, society, industry, non-governmental agencies |
| Governmental Model | National and international governmental agencies providing funding for OER | |
| Sponsorship/Advertising Model | Generating revenue by exposing learners to commercial messages | |
| Internally funded | Institutional Model | Higher education providers setting aside some part of their budget for OER programmes |
| Substitutions Model | Cost savings from redundant services (e.g. obsolete systems) are redirected towards OER programmes | |
| Author pays Model | Publishers generate revenue by charging content creators | |
| Community funded | Community based | Members of a community or network collaboratively create and use OER, generating revenue through services and/or infrastructure |
| Membership Model | The Membership model relies on organizations contributing to the OER provider with money, services and/or goods | |
| Platformization | Organises (paying) stakeholders around a digital ecosystem, facilitating interaction and generating insights | |
| Higher Education Service Models | Data Exploitation Model | Generates revenue by selling analytic data about the activities of those using a learning environment |
| Dual-Mode University | Use of OER in an online course (e.g. Massive Open Online Course) to develop a distance learning or virtual university operation | |
| Freemium | Educational materials are offered for free and sustainability is derived from subsequent income streams offered alongside this (e.g. assessment or access to a larger curriculum) | |
| Online Programme | Extending presence-based education to online or blended courses and related services | |
| Segmentation Model | Commercializing a service relating to OER (such as printing open textbooks; providing assessment or certification of learning) |
An important consideration in the study was how to describe the different business models that might be used in the cases. As part of the theoretical foundation, a typology of OER based business models (Farrow, 2023) was synthesised from strategies that are proposed in the literature (Tlili et al., 2020; Padilla Rodriguez et al., 2018; Belleflamme & Jacqmin, 2015; Ubachs & Konings, 2016; and Farrow, 2019). To keep the analysis manageable, respondents were asked to select a single simplified model which most closely represents their case. (In practice, revenue models are often hybrid.) The business model typology presents 14 models organised into 4 categories.
Similarly, categories were imposed on descriptors for the type of case (business, initiative, institution, project, social enterprise, other); the length of implementation (0–3 months, 4–6 months, 7–12 months, 1–2 years, 3–5 years and 5 years+); and the scale of the implementation (micro/institutional, meso/regional, macro/national, or international).
Methods
This framework was used to create a rubric for an online survey that collected data from people currently using OER to innovate their practice. A key challenge in writing the survey instrument was to balance the collection of rich data across a range of variables while keeping cognitive load to a minimum. Though there were typically opportunities to provide longer form responses, questions were presented as selections from predetermined categories where possible. The conceptual framework was also used to create a reflective evaluation tool which can be used independently of the study. Hence, the framing of the questions around innovation tended towards reflective rather than summative evaluation. Though this paper focuses on quantitative analysis, many of the questions around innovation behaviours were free text to support the statistical analysis with rich qualitative data.
The survey was open from 11 September 2022 to 28th February 2023 across three different collectors on the JISC Online Surveys platform (namely, one for the ENCORE+ project as a whole; one for users of the H5P OER platform; and one for Baden-Wuerttemberg Cooperative State University). Both Baden-Wuerttemberg Cooperative State University and H5P were partners in the ENCORE+ project and used independent collectors. Using the JISC survey tool ensured compliance with relevant data protection legislation, and the study received approval after review from the Human Research Ethics Committee at The Open University, UK.
The responses were compiled into a single dataset. 57 responses were received, with 44 cases eligible for inclusion in the analysis following quality review; these provide the basis for the analysis below. (It should be noted that the number of responses to specific items may vary in relation to the total number of cases.) The rest of the cases did not meet the quality threshold for being included – which means that their data was incomplete or the material provided was either not relevant to the questions asked by the survey, or a commercial educational technology provided was using the survey as a route to promote a product. As it can be observed in Figure 1, the survey had a wide geographical spread including Argentina, Australia, Canada, Colombia, UK, Germany, Greece, Hungary, India, Ireland, Kenya, the Netherlands, Norway, Scotland, Slovenia, South Africa, Spain, Switzerland, USA, and Zanzibar. Contributors were given several weeks to review the presentation of their case and respond to queries before the analysis proceeded.
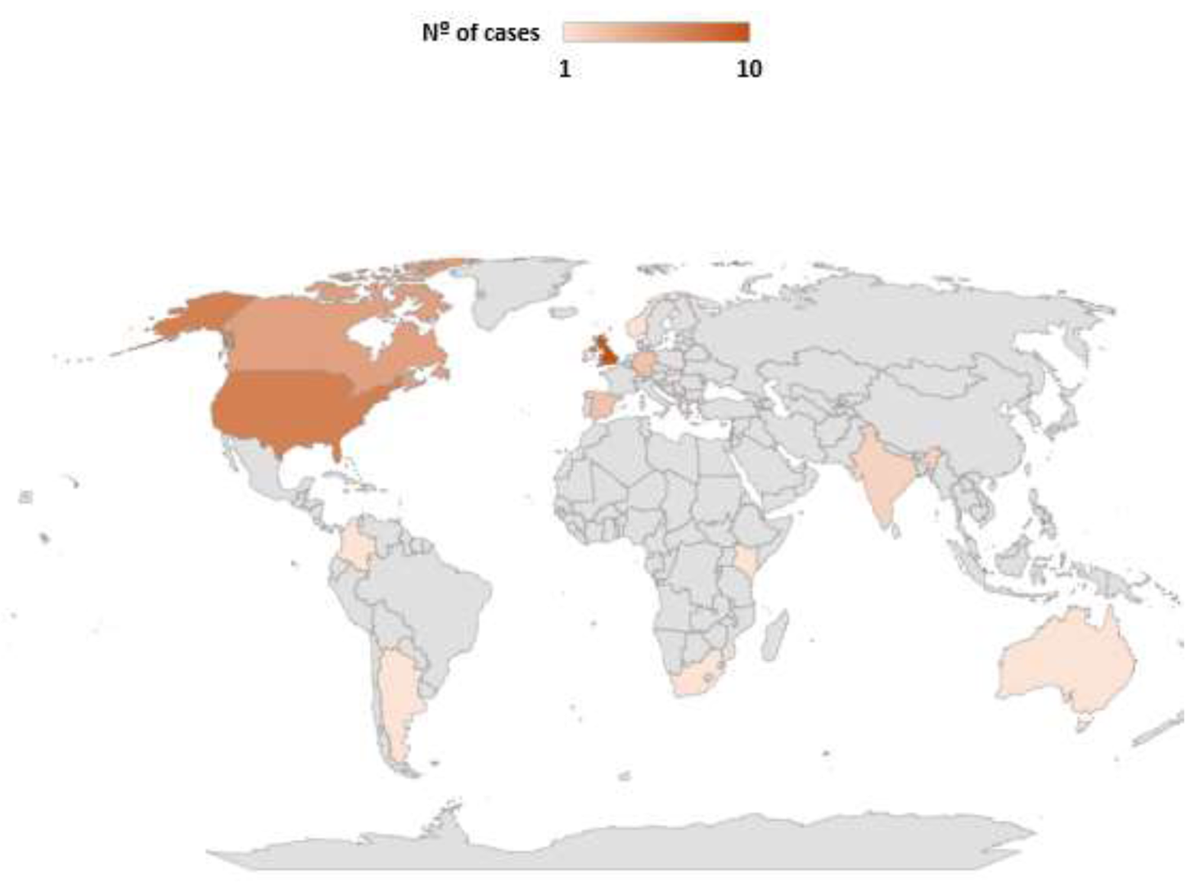
Figure 1
Geographical spread of the cases.
A basic analysis of the data was conducted with Excel to generate descriptive statistics. Inferential statistical analysis was conducted using IBM SPSS Statistics. Given the non-normal distribution of the sample, Pearson’s chi-square values were obtained to test the potential dependency between qualitative variables, and their association strength was measured by Cramer’s V test, a chi-square-based measure of nominal association which explains how two categorical fields are related. This value reveals the degree of significance, so the probability of finding results like those observed when the null hypothesis is rejected for a 95% confidence interval. This calculation allowed us to explain which elements within the dependent variables were significantly related and the effect size (ES) between them. The interpretation of Cramer’s V test can be found in Table 6.
Table 6
Interpretation of effect size (Cramer’s V).
| EFFECT SIZE | INTERPRETATION |
|---|---|
| ES ≤ 0.2 | The result is weak. Although the result is statistically significant, the fields are only weakly associated. |
| 0.2 < ES ≤ 0.6 | The result is moderate. The fields are moderately associated. |
| ES > 0.6 | The result is strong. The fields are strongly associated. |
Additionally, Krusk al-Wallis (non-parametric) test was applied for the comparison of the different size conditions of the cases through data measured on ordinal scales (Likert-scale questions) based on the organisational culture and processes related to innovation from the cases. This test informed whether the differences among the participants grouped by size (n = 4) were significant enough that they were unlikely to have occurred by chance (95% of confidence interval).
Results
This section presents descriptive data from the cases in relation to the conceptual framework developed in Table 1 in which this work is based. Then, relevant relationships between the different variables which shape the concepts studied are explained. The latter demonstrates which aspects of innovation processes were most likely to converge.
Description of the cases
Table 7 shows the relationship between the type of case and size of the implementation. Cases mostly came from projects (n = 19), initiatives (n = 12) and institutional actions (n = 7) and principally had an international focus (n = 23). It is also worth noting that almost a quarter of the cases were derived from local endeavours (n = 9) (micro level), second in terms of representation. (Responders were free to self-describe their case type and there could be interpretative differences between the semantics of “project” vs “initiative”.)
Table 7
Cross-referencing size and type of case.
| PROJECT (N = 19) | INITIATIVE (N = 12) | INSTITUTION (N = 7) | BUSINESS (N = 1) | OTHER (N = 5) | |
|---|---|---|---|---|---|
| International (54.8%) | 10 | 5 | 3 | 1 | 4 |
| Macro (16.7%)(national) | 4 | 3 | 0 | 0 | 0 |
| Meso(regional) (7.1%) | 1 | 1 | 2 | 0 | 1 |
| Micro (institutional) (21.4%) | 4 | 3 | 2 | 0 | 0 |
Half of the sample was well-established with a 5-year or longer duration (n = 22). This was followed by the cases which ranged in duration from 3 to 5 years and 1 to 2 years (n = 8 (each)). Consolidated cases,defined as those with a prolonged duration (3–5 years or +5 years), were mainly international (n = 13), a trend followed at all size levels. Macro and meso scales were less representative and evenly distributed across the duration ranges proposed . Smaller OER implementations, represented by meso and micro level cases, had in all instances a lifetime of at least one year (see Table 8).
Table 8
Cross-referencing size and duration of the cases.
| +5 YEARS | 3–5 YEARS | 1–2 YEARS | 6–12 MONTHS | 0–3 MONTHS | |
|---|---|---|---|---|---|
| International | 13 | 4 | 2 | 2 | 2 |
| Macro | 3 | 1 | 1 | 1 | 1 |
| Meso | 2 | 0 | 3 | 0 | 0 |
| Micro | 4 | 3 | 2 | 0 | 0 |
These variables were found to have influence on each other. Moderate significant values (ES = 0.484) were found between international cases and implementations which lasted 1–2 years and +5 years. Similarly, meso level cases were more frequent in implementations lasting 6–12 months, and meso-level cases were significantly related to cases that lasted over 5 years. The survey inquired about the practical obstacles encountered in the attempt to innovate with OER. The top challenge was related to “budget and finance”, followed by “building awareness”, “changing culture/practices”, and “skills development”, respectively. Another relevant variable was “time pressure” with a similar perceived presence to “skills and development”. The top 3 challenges had a wide margin of difference with the rest of the proposed options. Table 9 reflects variations in the order based on the size of the implementation (n = 44).
Table 9
Most frequently cited challenges for OER innovation at different size levels.
| INTERNATIONAL (N = 23) | MACRO (N = 6) | MESO (N = 5) | MICRO (N = 8) | |
|---|---|---|---|---|
| 1st challenge | Budget & finance | Building awareness | Budget & finance | Building awareness |
| 2nd challenge | Building awareness | Time pressure | Changing culture/practices | Changing culture/practices |
| 3rd challenge | Changing culture/practices | Changing culture/practices | Building awareness | Budget & finance |
Strategic Approach
Miles & Snow (1978) proposed a simple model for organisational strategy. For 7 key aspects, organisations can be understood as defenders or prospectors. Defenders focus on preserving market share, specialisation, emphasising stability and gradual growth. Prospectors, by contrast, are embracers of change and adaptability who seek new markets, new practices and new technologies in search of new product markets. Survey respondents were asked to classify themselves in relation to the 7 aspects proposed by Miles & Snow: products and services; target groups; communication channels; value chain; competitive advantage; networks; and sustainability. Prospector attitudes were found to be generally prominent, particularly around their competitive advantage, value chain and communication channels (Figure 2). However, the target markets, products and services appear to be traditional. Taken together, this gives the impression that OER users are exploring alternative approaches to formulating and communicating their value proposition to established groups. The most ‘prospective’ variable was for competitive advantage, suggesting this is a focus for innovation.
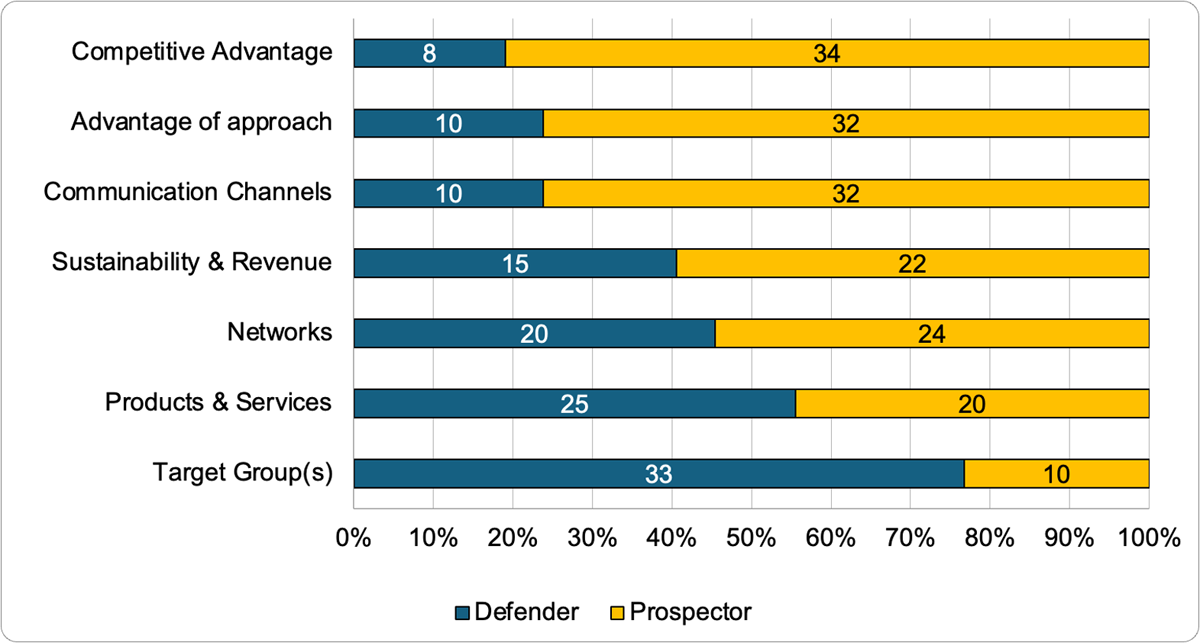
Figure 2
Strategic Approach: Prospectors and Defenders (N = 44).
Moving towards revenue generation and sustainability, the survey employed an inclusive and comprehensive description of existing open business models (Farrow, 2023). Respondents were asked to align their business models to one of those provided. Looking at the macro categories, externally funded models were the most recurrent ones (n = 17; 41%) along with internally funded ones (n = 15; 37%). Higher Education Service Models accounted for 12% (n = 5) of the sample; similarly, community funded ones accounted for 10% (n = 4).
Figure 3 shows the percentages obtained for individual modalities total count for the categories they belong to. Institutional models were the most prominent among these. Almost half of the funding structures in OER cases relied on budgets provided by public administrations and governments. However, cases also explored more innovative manners to raise revenue such as donations, community-owned infrastructure hosting, or the use of OER in online courses. (There were additional revenue model types in the wider sample but these did not meet the quality filter; this may imply they had less resource available for contributing data.)
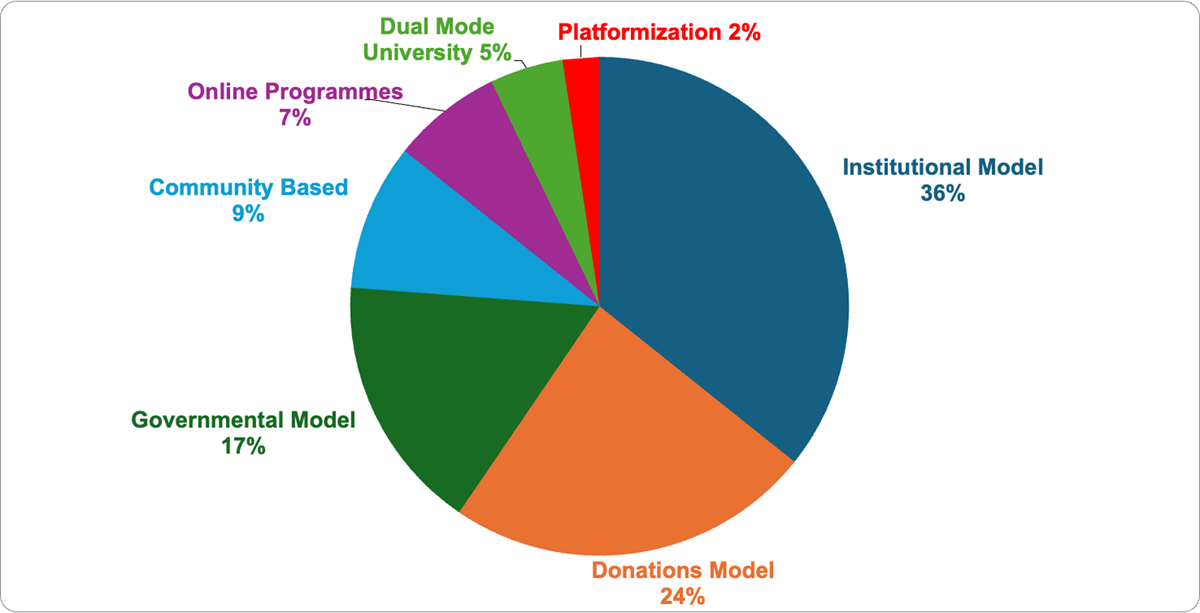
Figure 3
Business model typologies in the cases (n = 42).
Implementation of OER
The SAMR framework (Puentedura, 2006) was employed to conceptualise how OER, as technological objects, were employed through a progressive sequence which trends towards innovation. This can be illustrated with the example of open textbooks. First, open textbooks are substituted for proprietary resources with no behavioural change. They can also be considered augmented since they improve access, enable pedagogical experimentation and can be shared freely. More innovative behaviours may follow, such as modification of pedagogical tasks or teaching approaches supported by OER, remixed content, or collaboration across institutions. Finally, the use of OER can lead to the redefinition of pedagogical approaches, such as through open pedagogy or rethinking the textbook as the standard pedagogical aid or organisation of curricula. We can therefore classify substitution and augmentation as forms of enhancement and modification and redefinition as more innovative and transformative.
In this study, practitioners mostly described themselves in relation to these more transformative approaches: allowing for significant redesign of tasks and functions associated with teaching/learning (modification, n = 18, 41.8%) and allowing for new ways of conceiving teaching/learning (redefinition, n = 14, 32.6%); this implies moving towards a sophisticated an innovative conceptualisation of practice. By contrast, behaviours related to the enhancement of existing learning/teaching processes by the use of OER were less prominent, with augmentation (n = 7, 16.2%) and substitution (n = 4, 9.3%) next in decreasing order of frequency. Substitution was most closely associated with institutional use, as can be seen in Figure 4.
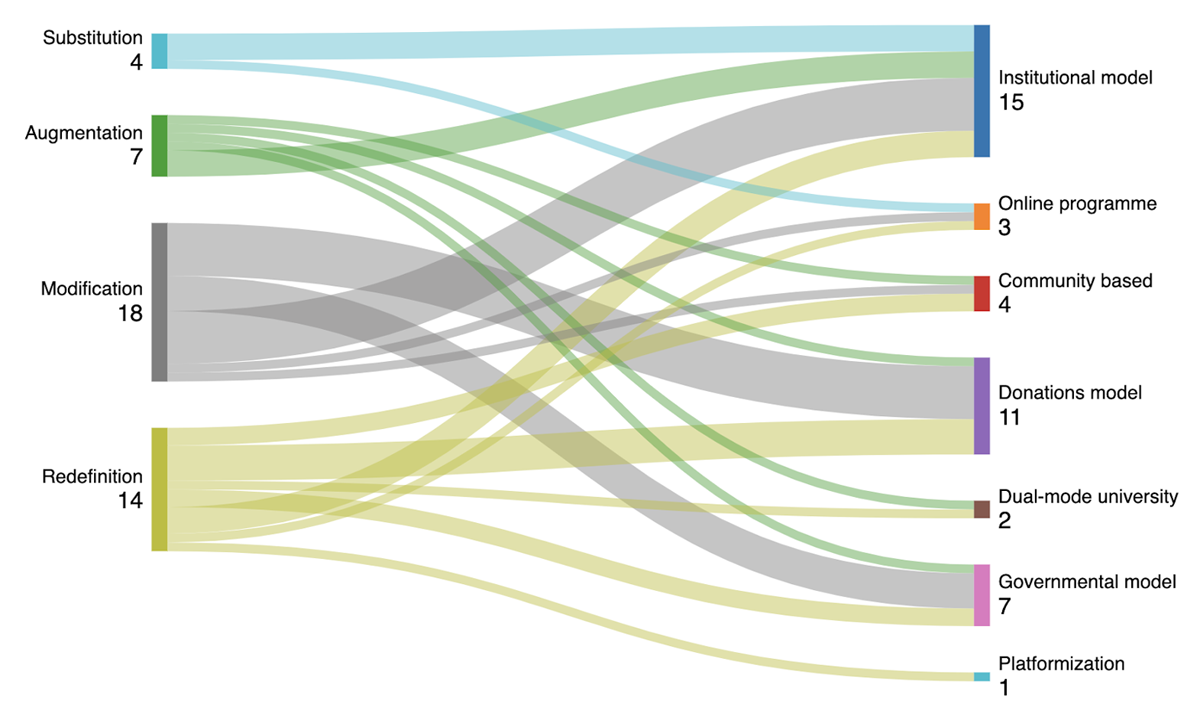
Figure 4
Revenue models correlated with primary SAMR OER implementation (n = 43).
SAMR categories also map well onto Darwish’s (2019) Edupreneurship Business Models (static, interactive, dynamic, transformative) which describe how different forms of content delivery are associated with organisational aspects and revenue models. When considered in conjunction with data about business models, we found qualified support here for Darwish’s prediction that more innovative use of OER is associated with more entrepreneurial and diverse revenue models.
Stakeholder Relations and Value Propositions
This study used a simplified stakeholder model (UPIG) which designated members of the OER ecosystem into four types. Users are consumers of OER and can include course providers, educators, learners, instructional designers, employers, trainers, and so on. Providers serve to fulfil this need, and include content creators, libraries, collections, galleries, infrastructure and technology companies. Repositories are both users and providers of OER. Influencers, including advocates, funders, charities, professional organisations, trade unions and researchers, are those who have influence over other stakeholders. Finally, Governance, including institutional decision makers, managers, local and national governments, evaluators, quality assessors and educational authorities, provides overall regulation and oversight (Farrow, Díez-Arcón, & Pitt, 2023:21). This model was put forward to address new stakeholders that were beyond the ones commonly associated with educational contexts, such as the ones coming from the business sector. Most of the cases were evidently thinking about how to meet the needs of traditional and non-traditional stakeholders, so proposing value propositions for all the groups targeted. Users were the main target group for proposals (97.7%) followed by Governance (77.3%), Providers (72.7%), and Influencers (54.5%). Although more than half of the sample suggested propositions for the latter, many cases reported that this category was not applicable to their implementation or the role of influencers was not fully understood.
Considering value propositions and their relation with the size (Table 10) and OER implementation (Table 11) it can be observed that more than half of the international and micro-level implementations addressed all stakeholders’ needs, while 40% of the meso-level cases did. Macro-level implementations did not offer propositions to all stakeholders in any of the cases, which may reflect increasing specialisation and consequent refinement of value proposition. Table 10 shows the distribution of the cases by size in relation to the number of stakeholders addressed. Table 11 show s that transformative approaches, redefinition and modification, obtained a high percentage (50% and 55.6% respectively) in the offer of value propositions to all stakeholders proposed. Both approaches revealed a trend which points to a growing concern to ensure that potential stakeholders’ needs are met. Values represent percentages for individual size and innovation-related categories.
Innovation: Barriers and Enablers
Respondents informed about enablers and barriers encountered based on vectors potentially involved in the cases. Figure 5 reflects the vectors mostly identified as barriers. The most significant barriers correspond to the regulatory environment and the use of proprietary software (74% of the sample respectively).
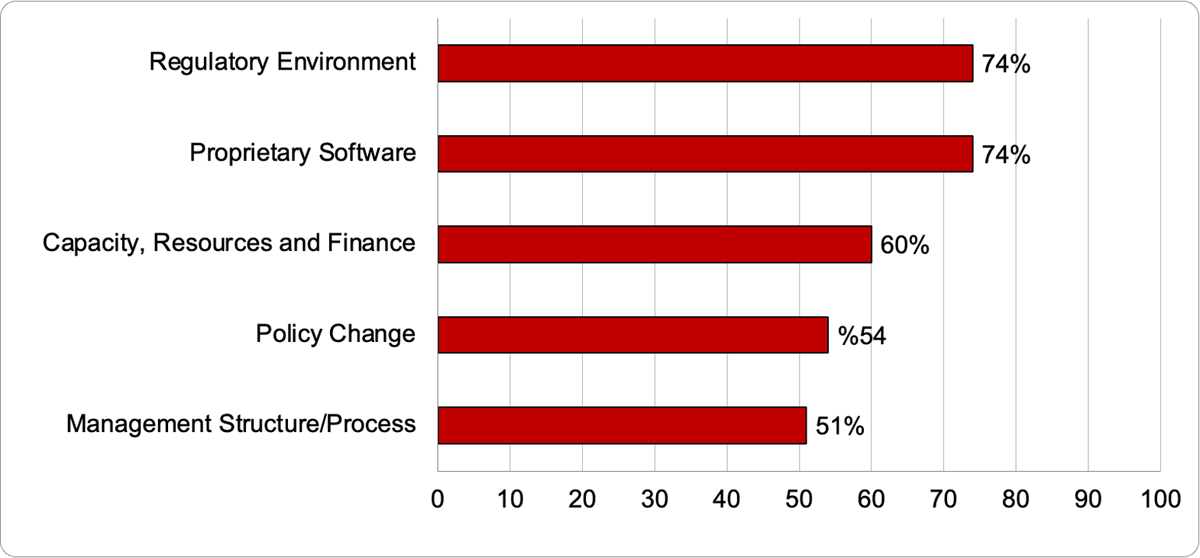
Figure 5
Barriers (%) for OER Innovation.
The rest of the vectors were perceived as enablers to innovation, and 75% of them obtained this evaluation ation from 70% of the sample (existence of evidence, Open Educational Practices, leadership, organisational culture, personal characteristics, our skills, open source software, internet access, research-practice links, quality of evidence, responding to authentic learners’ needs, stakeholders’ relationships, social context, other infrastructure, and Virtual Learning Environments). Conversely, other vectors, mostly perceived as enablers as well, obtained a more modest representation as Figure 6 shows.
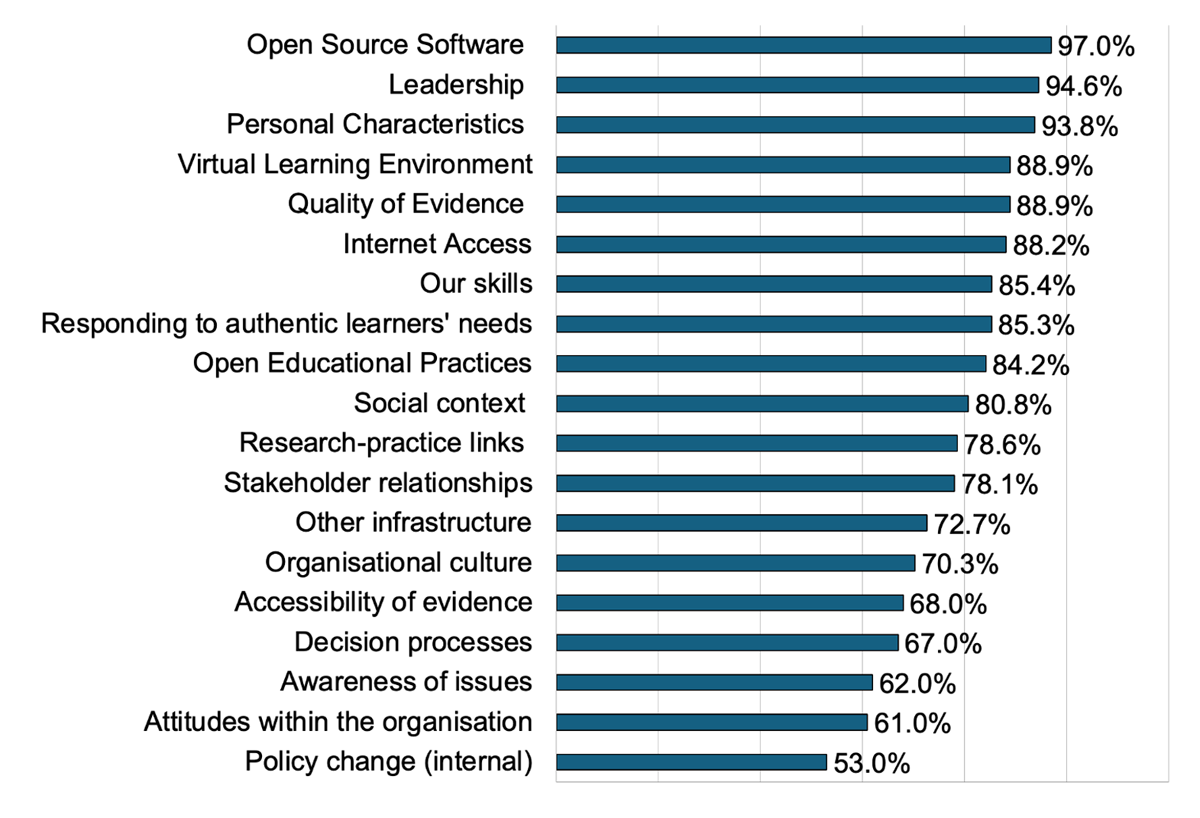
Figure 6
Enablers (%) for OER innovation.
Innovation: Culture and Process
Respondents rated different cultural and institutional indicators adapted from Herbig & Dunphy (1998) and Zhu’s (2015) works through Likert-scale questions where 5 meant “strongly agree” and 1 “strongly disagree”. Table 12 shows the set of items addressed by the whole sample, and also indicates the percentages obtained for each rating and their mean values. Considering these overall results, we can deduce that cultural and organisational approaches to innovation are moderately/highly established in the cases, with most of the items rating from 3–4. However, those aspects related to tracking and analysing innovation were capable of being further developed.
Table 12
Organisational culture and innovation processes (ranked by mean).
| INDICATOR | 5 | 4 | 3 | 2 | 1 | MEAN |
|---|---|---|---|---|---|---|
| Innovation is clearly aligned to our organisational strategies | 41% | 35.9% | 20.5% | 2.6% | – | 4.15 |
| Our staff are empowered to develop their capacity for innovation | 39.5% | 28.9% | 26.3% | 5.3% | – | 4.03 |
| My organisation is open to new and innovative approaches | 41% | 28.2% | 20.5% | 10.3% | – | 4.00 |
| Innovation activity is a part of daily activity tasks in this organisation | 34.2% | 28.9% | 26.3% | 10.5% | – | 3.87 |
| Our leaders recognise the innovation achievements of our staff | 31.6% | 36.8% | 21.1% | 7.9% | 2.6% | 3.87 |
| Our organisation is committed to a continuing and meaningful evaluation of best practices | 25.6% | 41% | 23.1% | 7.7% | 2.6% | 3.79 |
| Leadership provide clear guidance on innovation strategy | 30.8% | 28.2% | 23.1% | 15.4% | 2.60 | 3.69 |
| Our organisation captures, documents and shares ideas from diverse roles | 20.5% | 43.6% | 17.9% | 17.9% | – | 3.67 |
| Management provide the time and space needed to develop and implement ideas | 25.6% | 30.8% | 23.1% | 20.5% | – | 3.62 |
| We apply best practices to the flow of information within our organisation | 15.4% | 43.6% | 28.2% | 7.7% | 5.1% | 3.56 |
| We apply agile approaches to meet challenges | 20.5% | 23.1% | 38.5% | 15.4% | 2.6% | 3.44 |
| Our organisation has clearly identified innovation champions | 12.5% | 32.5% | 37.5% | 12.5% | 5% | 3.35 |
| Our decision making is middle-out | 5.4% | 37.8% | 37.8% | 16.2% | 2.7% | 3.27 |
| Our organisation responds quickly to adopt/adapt new ideas and approaches | 23.1% | 15.4% | 25.6% | 30.8% | 5.1% | 3.21 |
| Our decision making is top-down | 17.9% | 23.1% | 23.1% | 28.2% | 7.7% | 3.15 |
| Our decision making is bottom-up | 10.8% | 21.6% | 35.1% | 24.3% | 8.1% | 3.03 |
| We have systems in place to recognise and reward innovation behaviours | 5.1% | 33.3% | 28.2% | 23.1% | 10.3% | 3.00 |
| We have a management system for tracking innovation | 5.1% | 7.7% | 43.6% | 38.5% | 5.1% | 2.69 |
| Key performance indicators (KPIs) are used to track and analyse innovation behaviours | 7.9% | 13.2% | 31.6% | 31.6% | 15.8% | 2.66 |
The assessment of these same aspects did not differ significantly (p > 0.05) considering the variability of the sample sizes (Krusk al-Wallis test), although meso and micro-level cases tended to have a lower development on particular indicators. This could be inferred c onsidering the abundant neutral (3) and negative (1,2) responses of these two size samples for some indicators. Meso and micro level cases did not have systems to recognise and reward innovation, did not apply best practices to the flow of information, or did not quickly adopt/adapt new ideas. Additionally, meso-level cases did not usually have an agile response to challenges, captured and shared ideas from different roles in their organisations, or have middle-out decision-making processes, having a neutral position about leaders’ recognition of innovation achievements of the staff; this being more developed by international, macro and micro-level cases, perhaps suggesting difficulties in the evolution from smaller to larger operations.
While international and macro-level sizes tended to have highly developed cultural and organisational indicators, meso and micro-level examples often had neutral positions. Such is the case of leadership’s provision of guidance and strategy, staff’s capacity for innovation development, or the identification of innovation champions. Micro-level cases also differed from other types of cases in relation to decision-making procedures and the alignment of the organisational strategies with innovation: top-down decision-making processes were not common, but they firmly agreed on their organisational strategies being in line with innovation. The rest of indicators showed a uniform pattern across sizes in line with the results in Table 12.
Convergence of Innovation Variables in the Framework
In this section, size and duration are compared with all the variables of the conceptual framework. The analysis of the potential effects among variables and their different factors revealed significant relationships. Nearly all the variables studied were found to be related to each other in some specific aspect, with attention to the individual factors involved in the conceptualisation of the innovation proposed. It is important to mention that no relevant variations in the direction of responses were found based on basic characteristics of the cases such as their size or duration. This exploratory analysis was carried out without hypothesising or having any preconceived ideas about the possible results due to the characteristics of the study proposal itself, where for the first time an attempt was made to conceptualise the aspects influencing innovation in OER. The results shown below do not include all the analyses performed, but only those where significant values were obtained.
Business models showed a significant dependency with strategic foci and barriers encountered. The former had a strong association with an effect size (ES) of 0.6 for community-based cases which significantly adopted prospectors’ strategies. Specific business models were also highly associated with barriers encountered in some of the factors studied (see Table 13). Such is the case of “responding to authentic learners’ needs” significantly related to community-based and platformisation models (ES = 0.691); “stakeholders’ relationships” (ES = 0.6), linked to governmental-based funding models; “social context”, related to platformisation and community-based models ES = 0.855) and “research and practice links”, related to platformisation and governmental funding models (0.707).
Table 13
Dependency between business models and strategic foci (barriers).
| BUSINESS MODEL | BARRIER |
|---|---|
| Community-based | –Responding to authentic learners’ needs –Social context |
| Platformisation | –Responding to authentic learners’ needs –Social context –Research & practice links |
| Governmental | –Stakeholders’ relationships –Research & practice links |
The type of case was also found to have a moderate influence (0.456) on the attributes of innovation and enablers and barriers. The attribute “trialability” had influence on business cases and the ones labelled as initiatives. Business cases significantly found this attribute in the implementations, while initiatives did not.
The type of OER implementation (SAMR) also happened to have moderate effects on other variables, specifically: augmentation, substitution and modification, in their relation with the attributes of innovation, and barriers and enablers. Firstly, cases labelled as “augmentation”, so which were substituting proprietary content with changes to functionality, were significantly perceiving their innovations as more efficient than what they replace, or to perceive their “relative advantage”, as in Rogers (2003). Also, cases categorised as “substitution” significantly found the awareness of issues in their implementations as a barrier. Lastly, the most sophisticated approach to innovation, “modification”, perceived the decision processes during the run of the cases and the attitudes in their organisations as enablers.
Data also revealed which type of stakeholders significantly tended to be identified with the attributes of innovation in a similar way. The tandem users-providers were associated by respondents to all the attributes of innovation alike (moderate ES in all cases). Stated another way, when “users” were identified with either direction on the perceived value of the implementation, “providers” did in the same way. Also, governance-related stakeholders usually were identified with the attributes of innovation “relative advantage”, “observability”, and “compatibility” as influencers were . The ES in “compatibility” was found to be strong (0.671), while the other associations were moderate. Governance agents also were significantly identified with how “users” were perceived in relation to “trialability” (0.413) and were associated with the “providers” group when referring to “relative advantage” (0.414), “compatibility” (0.544), and “trialability” (0.586).
The relationships between the perceived (or not) attributes of innovation for OER value proposition when addressed to individual stakeholders and the rest of the variables were ascertained. As Table 14 illustrates, all stakeholders were represented at some level with the exception of “influencers”. A correct interpretation of the information included in Table 14 could be made as follows, considering the first effect between variables found: micro (institutional) cases tended to significantly find the attribute “compatibility” with existing practice as an effective route to forming their value proposition for users. Similarly, when the strategic approach for “products & services” was new or not traditional (“prospectors”), “compatibility” was also found to be an effective avenue for users. Also, “modification” cases were more likely to perceive “observability” as an efficient path for users, while “redefinition” examples show a significant – but opposite – effect for users.
Table 14
Variables affected by attributes of stakeholder value propositions.
| STAKEHOLDER | ATTRIBUTE OF INNOVATION (YES/NO) | VARIABLE | CATEGORY | ES |
|---|---|---|---|---|
| Users | Observability (YES) | Enabler | Regulatory environment | 0.654 |
| Governance | Relative advantage (NO) | Barrier | Policy change (external) | 0.654 |
| Providers | Observability (YES) | Barrier | Relevance & replicability | 0.516 |
| Governance | Trialability (NO) | Enabler | Quality of evidence | 0.516 |
| Users | Compatibility (YES) | Size | Micro-level | 0.494 |
| Providers | Observability (YES) | Strategy | Products & services (prospectors) | 0.494 |
| Users | Observability (NO) | OER Implementation | Redefinition | 0.474 |
| Governance | Observability (YES) | Enabler | Policy change (internal) | 0.467 |
| Users | Compatibility (NO) | Type of case | Initiative | 0.465 |
| Users | Observability (YES) | OER Implementation | Modification | 0.46 |
| Users | Compatibility (YES) | Strategy | Products & services (prospectors) | 0.454 |
| Providers | Trialability (YES) | Barrier | Open Educational Practices | 0.417 |
| Users | Observability (YES) | Enabler | Stakeholders’ relationships | 0.412 |
| Providers | Compatibility (YES) | Barrier | Our skills | 0.408 |
Strong (0.677) and moderate (0.4) associations were found with the barriers encountered. “Relative advantage” had a strong influence on the “regulatory environment”. Similarly, although with a moderate association (ES = 0.4), the attribute “observability” had an effect on “capacity and resources”. This means that the majority of the cases that identified these two aspects as barriers did not emphasise relative advantage and observability, respectively, in their value propositions.
Table 15 summarises the relationships found. The attitudes in the organisation as an enabler become significantly related to implementations labelled as “modification”, a transformative approach from the SAMR model. Enablers such as “awareness of issues”, “personal characteristics”, and “our skills” were dependent on some attributes to innovation. Cases perceiving “awareness of issues” as enablers were more likely to perceive a “relative advantage” in their value proposition. In contrast, “decision processes” and “personal characteristics”, when perceived as enablers, did not significantly affect perceived “observability” and “triability” respectively in the cases. Finally, enablers’ perspectives in “decision processes”, “personal characteristics”, and “organisational culture” notably adopted a defender approach in reference to target groups addressed. This also happened between “organisational culture” and “products and services”.
Table 15
Dependency of enablers with SAMR, strategy and diffusion of innovations.
| ENABLERS | TYPE OF OER IMPLEMENTATION | INNOVATION STRATEGY | DIFFUSION OF INNOVATIONS |
|---|---|---|---|
| Attitudes in the organisation | Modification | — | — |
| Awareness of issues | — | — | Relative Advantage (YES) |
| Decision processes | — | Target group (defender) | — |
| Personal characteristics | — | Target group (defender) | Observability (NO) |
| Our skills | — | — | Trialability (NO) |
| Organisational culture | — | Target group (defender) Products and services (defender) | — |
Discussion
The cases collected for this study are diverse, representing a range of organisations with variances across the size and maturity of the organisation, location, target audiences, key stakeholders, and mission. One of the central challenges addressed is the need to find a set of concepts that could act as a universal framework for understanding how innovation is understood in practice.
While the data set is relatively small in terms of the number of cases, the cases themselves provided a lot of detail. We found that OER users are exploring alternative approaches to formulating and communicating their value proposition to their respective stakeholders. Perceived attributes of value propositions/impact in terms of innovation can ascertain their rate of diffusion. According to Rogers (2003) innovations should possess the qualities of relative advantage, compatibility, complexity, trialability and observability. These was also reported by respondents, who reflected on effective routes of impact to their different stakeholders. Micro-level cases tended to significantly find the attribute “compatibility with existing practice” as an effective route to innovation for users, which can be seen to endorse a common sequence where OER are initially introduced and used alongside or in the same way as proprietary resources. Micro-level cases also differed from other types in that top-down decision-making processes were not common but they felt that their strategic approach nonetheless supported innovative practice. This may reflect the relative agility and freedom of smaller organisations in terms of ability to innovate.
As shown in Figure 4, more complex and reflective OER implementations are associated with more innovative forms of delivery. This finding is consistent with the hypothesis put forward by Darwish (2019) that “providers continually try to build up the opportunities to constitute the expansion and variation of users and providers’ motivation”. However, Darwish focused on a supply and demand model. The UPIG model used in this study reveals more complex and multifaceted stakeholder relationships, but the trend nonetheless appears to be that, over time, increased maturity of organisations in the OER space sees the extension of value propositions to a wider range of stakeholders. Deductively, the data suggests that a more complex conceptualisation of innovation involves processes that are distanced from a basic use of educational resources, where OER are no longer proposed only for the most commonly found tandem of stakeholders (users-providers). This can see OER being used online at scale, being used as part of a shared learning platform or repository, or in hybrid forms of delivery. Those working within institutions seem more likely to simply adopt OER, while extra-institutional innovations are more likely to draw on the downstream behaviour of the 5 Rs of OER (Wiley & Hilton, 2018) as they innovate practice.
How do innovative practices emerge? One response to this could be to implement formal management practices which attempt to enculture an innovation mindset. We did not find evidence of this being the case in our sample. Most of the organisations in the case studied believed they had an innovative culture, but this was not codified into key performance indicators, reward or recognition structures, even in larger organisations. The suggestion is instead that innovation culture in open spaces may be fluid, informal and lightly regulated. As Table 12 indicates, there was universally strong agreement with the idea that individuals working within the cases were part of innovative cultures which focused on the empowerment of the individual. While it could be argued that few managers (whether in the “open” space or not) would declare the opposite, it would be interesting to see (perhaps through triangulation) whether the same would be true for more traditional education providers.
Figure 2 showed that the most innovative approaches are associated with competing for and communicating with end-users (who often themselves meet the traditional definitions of learners and educators). As OER using organisations develop and mature, extending their offer to a wider group of potential stakeholders, they often become more distanced from their end users as the classroom is left behind. Interactions are further mediated as size and ambition increased. Providers, influencers and governance may have a looser sense of their users in such circumstances, and this may drive innovation in how value propositions are formed and communicated. Similarly, Table 10 shows that more mature, transformative approaches to OER use (redefinition and modification) were highly represented in the offer of value propositions concerned with all stakeholder types. Increasing distance from the point of OER use can obviously act as an obstacle to mutual understanding of stakeholders, but also seems to drive innovative online practices. Those providing online services as a starting point rather than an evolution of campus interactions also face this challenge, since users of their services may be understood indirectly or abstractly.
The effect of the Covid-19 pandemic (Stracke et al., 2022a; 2022b) is potentially a confounding variable here, since many providers were obliged to expand online provision rapidly. The “online pivot” (Camacho & Legare, 2021; Bozkurt et al., 2022) forced experimental and improvised shifts to online provision and evolutions in practice. This could be seen as a driver of innovation in that “necessity is the mother of invention”. However, the importance of this interpretation shouldn’t be overstated since, by the time of the survey, many had returned to classroom education and educators in the OER space are often used to online or blended learning scenarios.
Table 13 suggests that policy and regulation factors are considered the biggest barrier to innovation. This was a consistent finding, and may mean that combinations of institutional rules and government policies restrict individuals from experimenting with change. Conversely, regulatory environments may also act as enablers when sympathetic. The elements found as enablers can be interpreted as indicators of a relative standardisation of the processes influencing innovation. In this case, some elements mostly acting as “enablers” had an influence on the type of OER implementation (SAMR), innovation strategy focus and the diffusion of innovations. In all cases, the effect size (ES) was moderate. It should be noted, though, that internal policies were also found to be a moderate driver of innovation (Figure 6).
Table 13 also indicates that influencers, overall, are not a particularly relevant stakeholder for the sample, and, consequently, practically no relationships of dependence or influence with other variables were found. For less transformative uses of OER (augmentation, substitution) this group is practically ignored. This may reflect that influencers become more relevant when activities scale up and become more visibly part of a wider ecosystem with more stakeholders to consider. One interpretation here is that targeting influencers with value propositions for OER is not currently prominent. Given that influencers are diverse (including funders, development agencies, advocates, charities, non-governmental organisations, professional associations, student organisations, trade unions, consultants, institutional actors, parents and guardians) there could be untapped potential for developing communication strategies which focus on their ability to affect change and communicate.
Chesbrough (2006) argued that openness itself is a route to innovation. We found empirical support for this, particularly through OEP and open source software being frequently named as enablers (Figure 6). Openly licensed software is arguably so prevalent as to often be overlooked. It was also found that leadership and personal qualities were important for effecting change and innovating practice. Overall, many factors are considered relevant enablers of innovation but reflective practice, recognising achievements, empowering staff and retaining an “open” mindset were consistently reported. These qualities correspond with Chesbrough’s idea that information flow across institutions is an effective modern paradigm for supporting innovation.
Conclusion
This paper addresses a significant gap in the OER research literature which pertains to claims commonly made about OER being a catalyst for innovative practice, providing a conceptual framework and an empirical base that can support future research in this area. This study analyses a diverse array of cases across various organizations, indicating the multifaceted nature of innovation in Open Educational Resources (OER). While the dataset is relatively small, it offers detailed insights into how OER users navigate value propositions and conceptualise innovation within their practices. The study underscores the importance of compatibility with existing practices in driving innovation, particularly for smaller organizations or less mature implementations of OER. As organizations mature in the OER space, their value propositions extend to a broader range of stakeholders, leading to more complex and reflective implementations. The emergence of innovative practices is not solely driven by formal management practices but is rather fostered within fluid, informal, and lightly regulated innovative cultures. As organizations evolve, they may become more distanced from end-users, which can both hinder mutual understanding and drive innovative online practices. The COVID-19 pandemic acted as a catalyst for rapid shifts to online provision, potentially influencing innovation trajectories. Policy and regulatory factors are identified as significant barriers to innovation, while openness itself is recognized as a route to innovation, particularly through Open Educational Practices (OEP) and open-source software. Leadership qualities, reflective practice, and maintaining an open mindset are highlighted as crucial enablers of innovation, aligning with the notion that information flow across institutions is pivotal for fostering innovation in the OER ecosystem. We find that OER value propositions evolve along four dimensions: they are transformative, focusing on modifying pedagogical activity; practical, targeting direct and achievable behaviour change; emphasise observability, simplicity, and compatibility in communication; and become more inclusive of various stakeholders as organisations mature in their use of OER.
Recommendations
We propose that the SAMR (Puentedura, 2006)and Edupreneurship (Darwish, 2019) frameworks can be meaningfully mapped conceptually and empirically to provide a maturity model for OER innovation (Table 3)
The OER Innovation Evaluation Framework seems to support the description of innovation in OER use examples, and it could be used to support additional research or strategic reflection on practice
The UPIG stakeholder model may provide a compromise between overly simplified and overly complex stakeholder models in open education
In some cases, OER value propositions can be strategically extended to additional parties, and influencers are perhaps often overlooked
Limitations
While some patterns emerge from considering the collection of cases as a whole, the information conveyed in this work is intended as an illustrative snapshot of showcase projects rather than a general guide to OER implementation in view of the convenience sampling method employed. Caution should be taken when reviewing the trends seen in this report, as patterns may not be generalisable beyond the original context of application. However, it is hoped that these examples demonstrate a range of innovation possibilities and can act as inspiration for further activity. The dataset and data collection tools are made available CC BY to support future research.
Data accessibility statement
The datasets generated and/or analysed during the current study are available in the ORDO repository, https://doi.org/10.21954/ou.rd.25809337.v1.
Ethics and Consent
This study is informed by BERA’s Ethical Guidelines for Educational Research (https://www.bera.ac.uk/resources/all-publications/resources-for-researchers) and governed by The Open University’s Code of Practice for Research (https://www.open.ac.uk/research/governance/policies). This research has been reviewed by, and received a favourable opinion from, The Open University Human Research Ethics Committee: reference HREC/4379/FARROW. All participants provided informed consent, including for open release of the dataset.
Acknowledgements
The study was conducted as part of the European Network for Catalysing Open Resources in Education (ENCORE+, n.d) project (2020–2023). ENCORE+ was an Erasmus+ funded initiative dedicated to facilitating the uptake of OER in Europe by amplifying the activity of existing projects, initiatives, platforms and networks. ENCORE+ was organised around the distinctive challenges of the OER sector in Europe, including fragmentation of the OER stakeholder communities; lack of collaboration and interoperability among OER repositories; low development of OER institutional strategies in businesses and academia; lack of an integrated European OER quality paradigm and quality assurance mechanism; and lack of entrepreneurial innovative approaches and business models based on OER.
The authors are grateful to the 44 individuals and organisations who contributed data for their cases. The partial list of contributors can be found in the ENCORE+ report on the innovation case studies (Farrow, Díez-Arcón & Pitt, 2023). Some of those who contributed data preferred to remain anonymous.
This study has been funded with support from the European Commission. This publication reflects the views only of the authors, and the Commission cannot be held responsible for any use which may be made of the information contained therein.
Funding Information
This paper is funded by Erasmus+ with grant number 621586-EPP-1-2020-1-NO-EPPKA2-KA.
Competing Interests
The authors have no competing interests to declare.
Author contributions (CRediT)
Robert Farrow: Conceptualization, methodology, formal analysis, investigation, data curation, visualization, funding acquisition, writing—original draft preparation, writing—review and editing; Paz Díez-Arcón; formal analysis, investigation, software, validation, writing—original draft preparation, writing—review and editing. All authors have read and agreed to the published version of the manuscript.