
Table 1
Control and sample groups sizes, year mark and exam results (both in percentage points) for the TC quasi-experiment. Data is listed for the three consecutive semesters when the interventions took place.
| YEAR/SEMESTER | 2017/S2 (4 × 4 hrs) | 2018/S1 (5 × 3 hrs) | 2018/S2 (5 × 3 hrs) |
|---|---|---|---|
| Control # | 547 | 550 | 500 |
| Sample # | 21 | 15 | 21 |
| Year Mark | |||
| Control mean | 66.3 | 60.9 | 59.1 |
| Sample mean | 74.8 | 68.2 | 70.3 |
| P-value | 0.044 | 0.094 | 0.052 |
| Effect size | 0.32 | 0.25 | 0.38 |
| Exam | |||
| Control mean | 47.1 | 45.7 | 59.7 |
| Sample mean | 58.7 | 48.8 | 68.2 |
| P-value | 0.018 | 0.112 | 0.011 |
| Effect size | 0.45 | 0.25 | 0.44 |
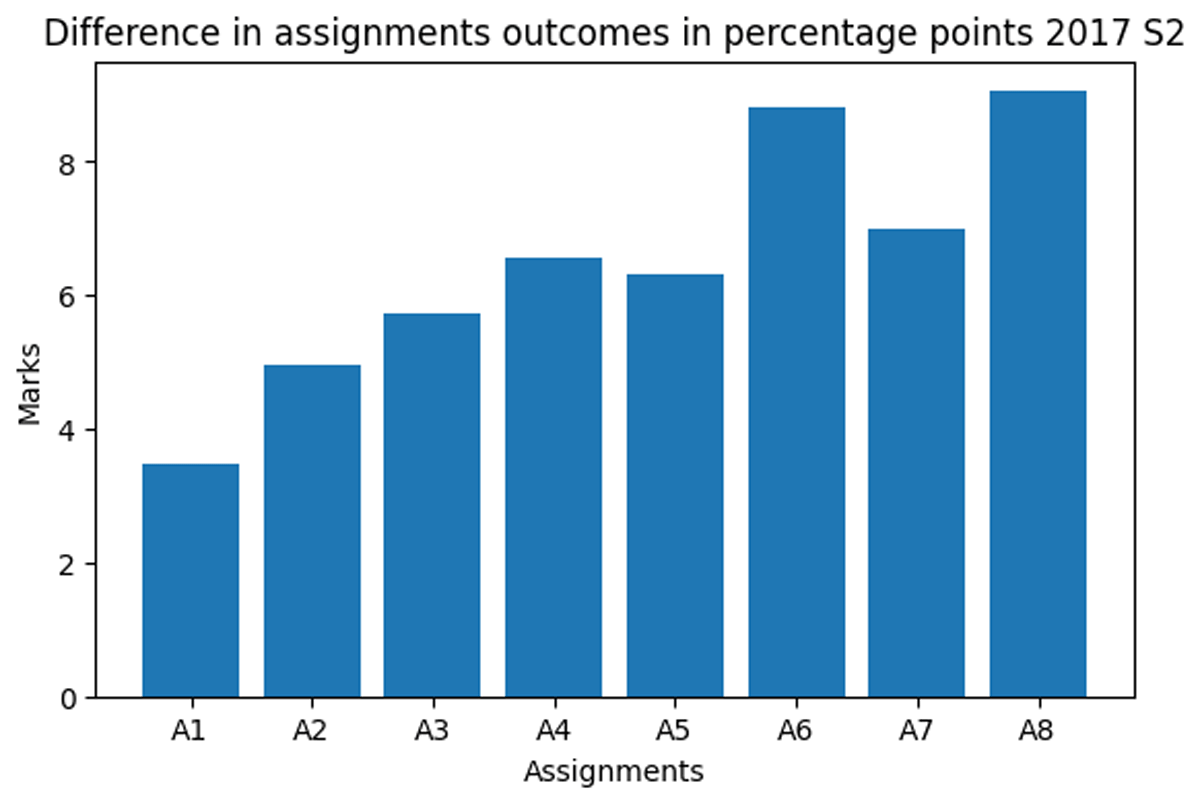
Figure 1
The difference in marks (equivalent to the percentage points) in consecutive assignments during the second semester of 2017.
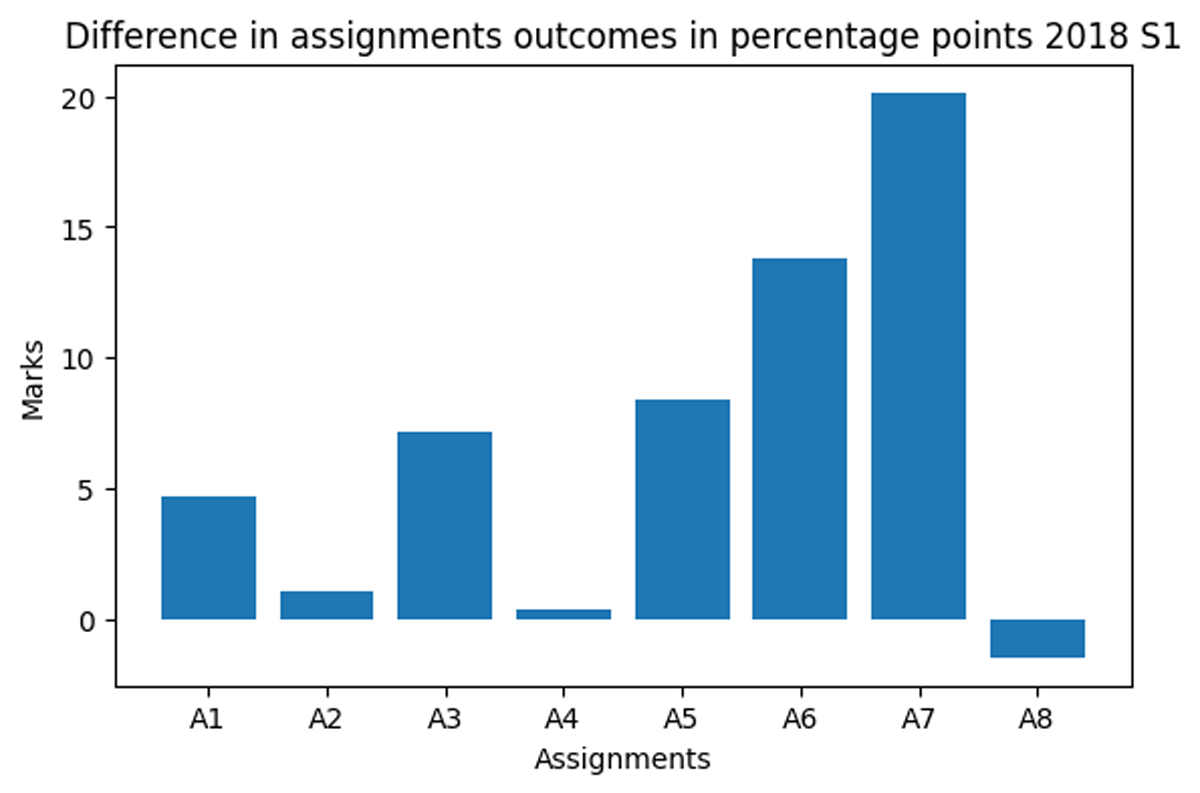
Figure 2
The difference in marks (equivalent to the percentage points) in consecutive assignments during the first semester of 2018.
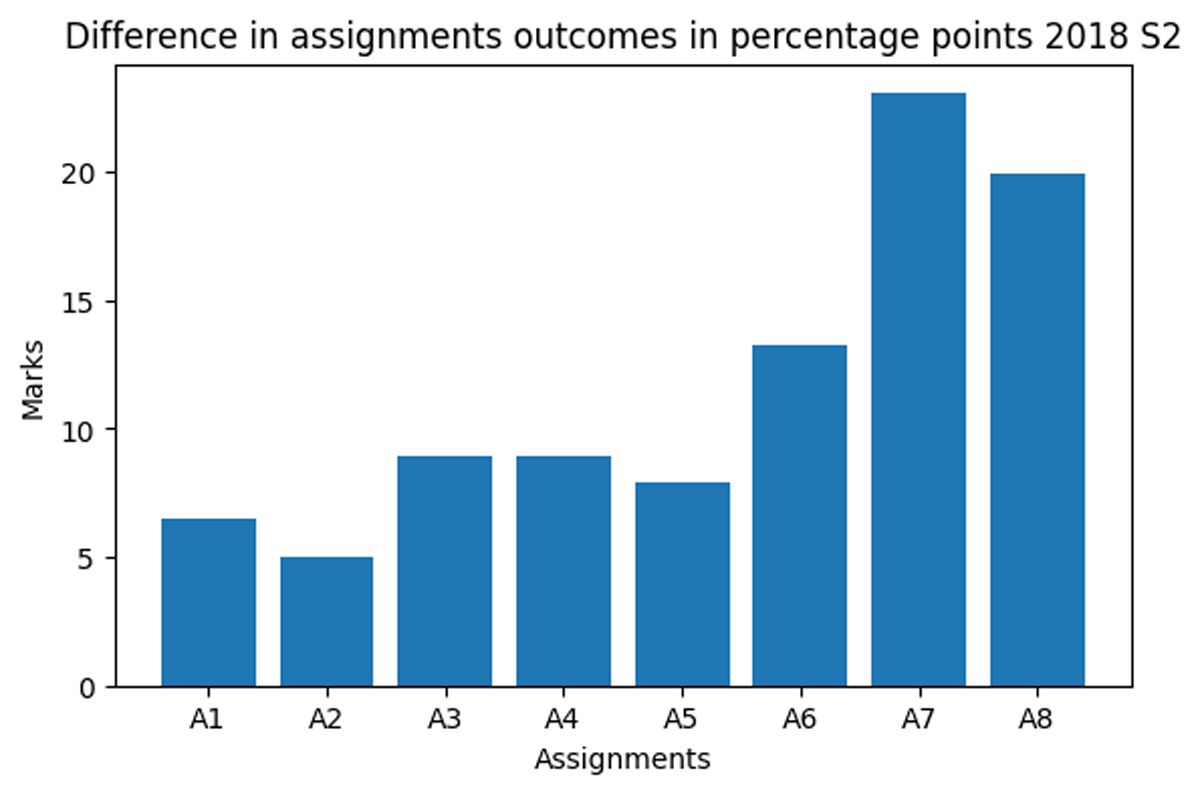
Figure 3
The difference in marks (equivalent to the percentage points) in consecutive assignments during the second semester of 2018.
Table 2
Linear approximation of results growth (the difference between the average sample mark and the average control group mark) over a series of consecutive assignments submitted by students in the sample.
| YEAR/SEMESTER | 2017/S2 (4 × 4 hrs) | 2018/S1 (5 × 3 hrs) | 2018/S2 (5 × 3 hrs) |
|---|---|---|---|
| Pearson | 0.91 | 0.30 | 0.87 |
| P-value | 0.002 | 0.465 | 0.005 |