
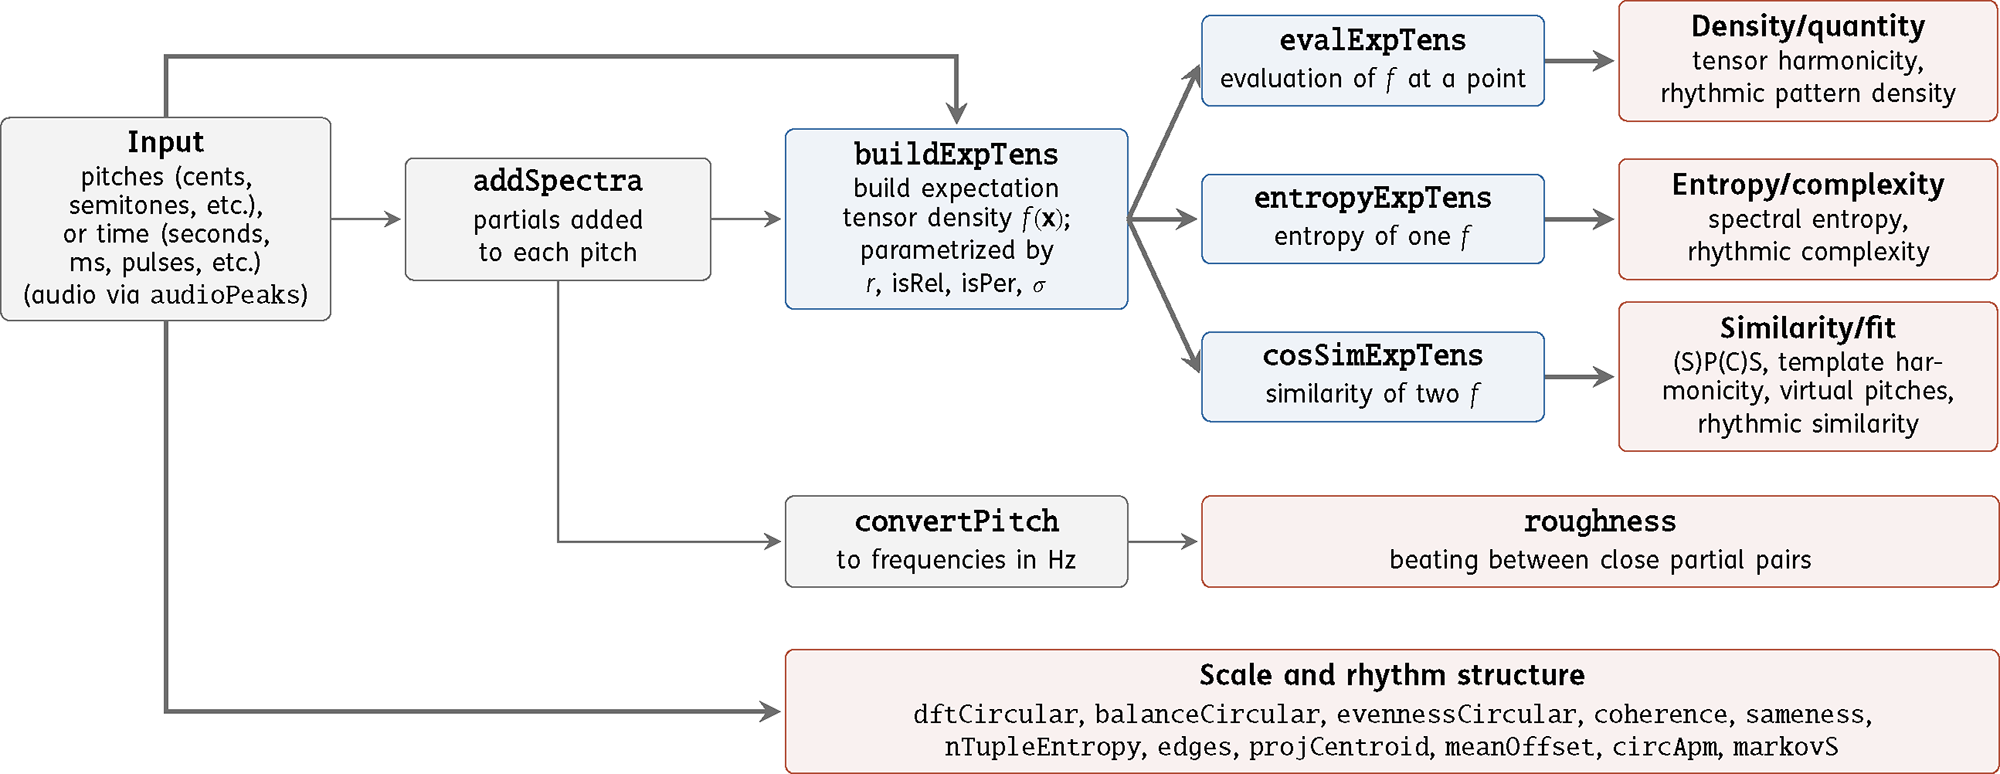
Figure 1
Dataflow through the toolbox. A weighted multiset of pitches or time points is the common input. Spectral enrichment is optional—time points bypass it, as may pitches—after which the collection becomes an expectation tensor density. Three operations are defined on a density: evaluation at a point, entropy of one, and comparison of two. Two paths bypass the density: roughness takes the partials directly, converted to Hz, and the structural measures take the weighted positions directly. Thick arrows mark the paths that serve the pitch and rhythm domains alike, with only the period changing; the thin ones pass through spectral enrichment, which applies to pitched sounds only. Colour marks each box’s role: grey for input and preprocessing, blue for the expectation tensor operations, and red for measures.
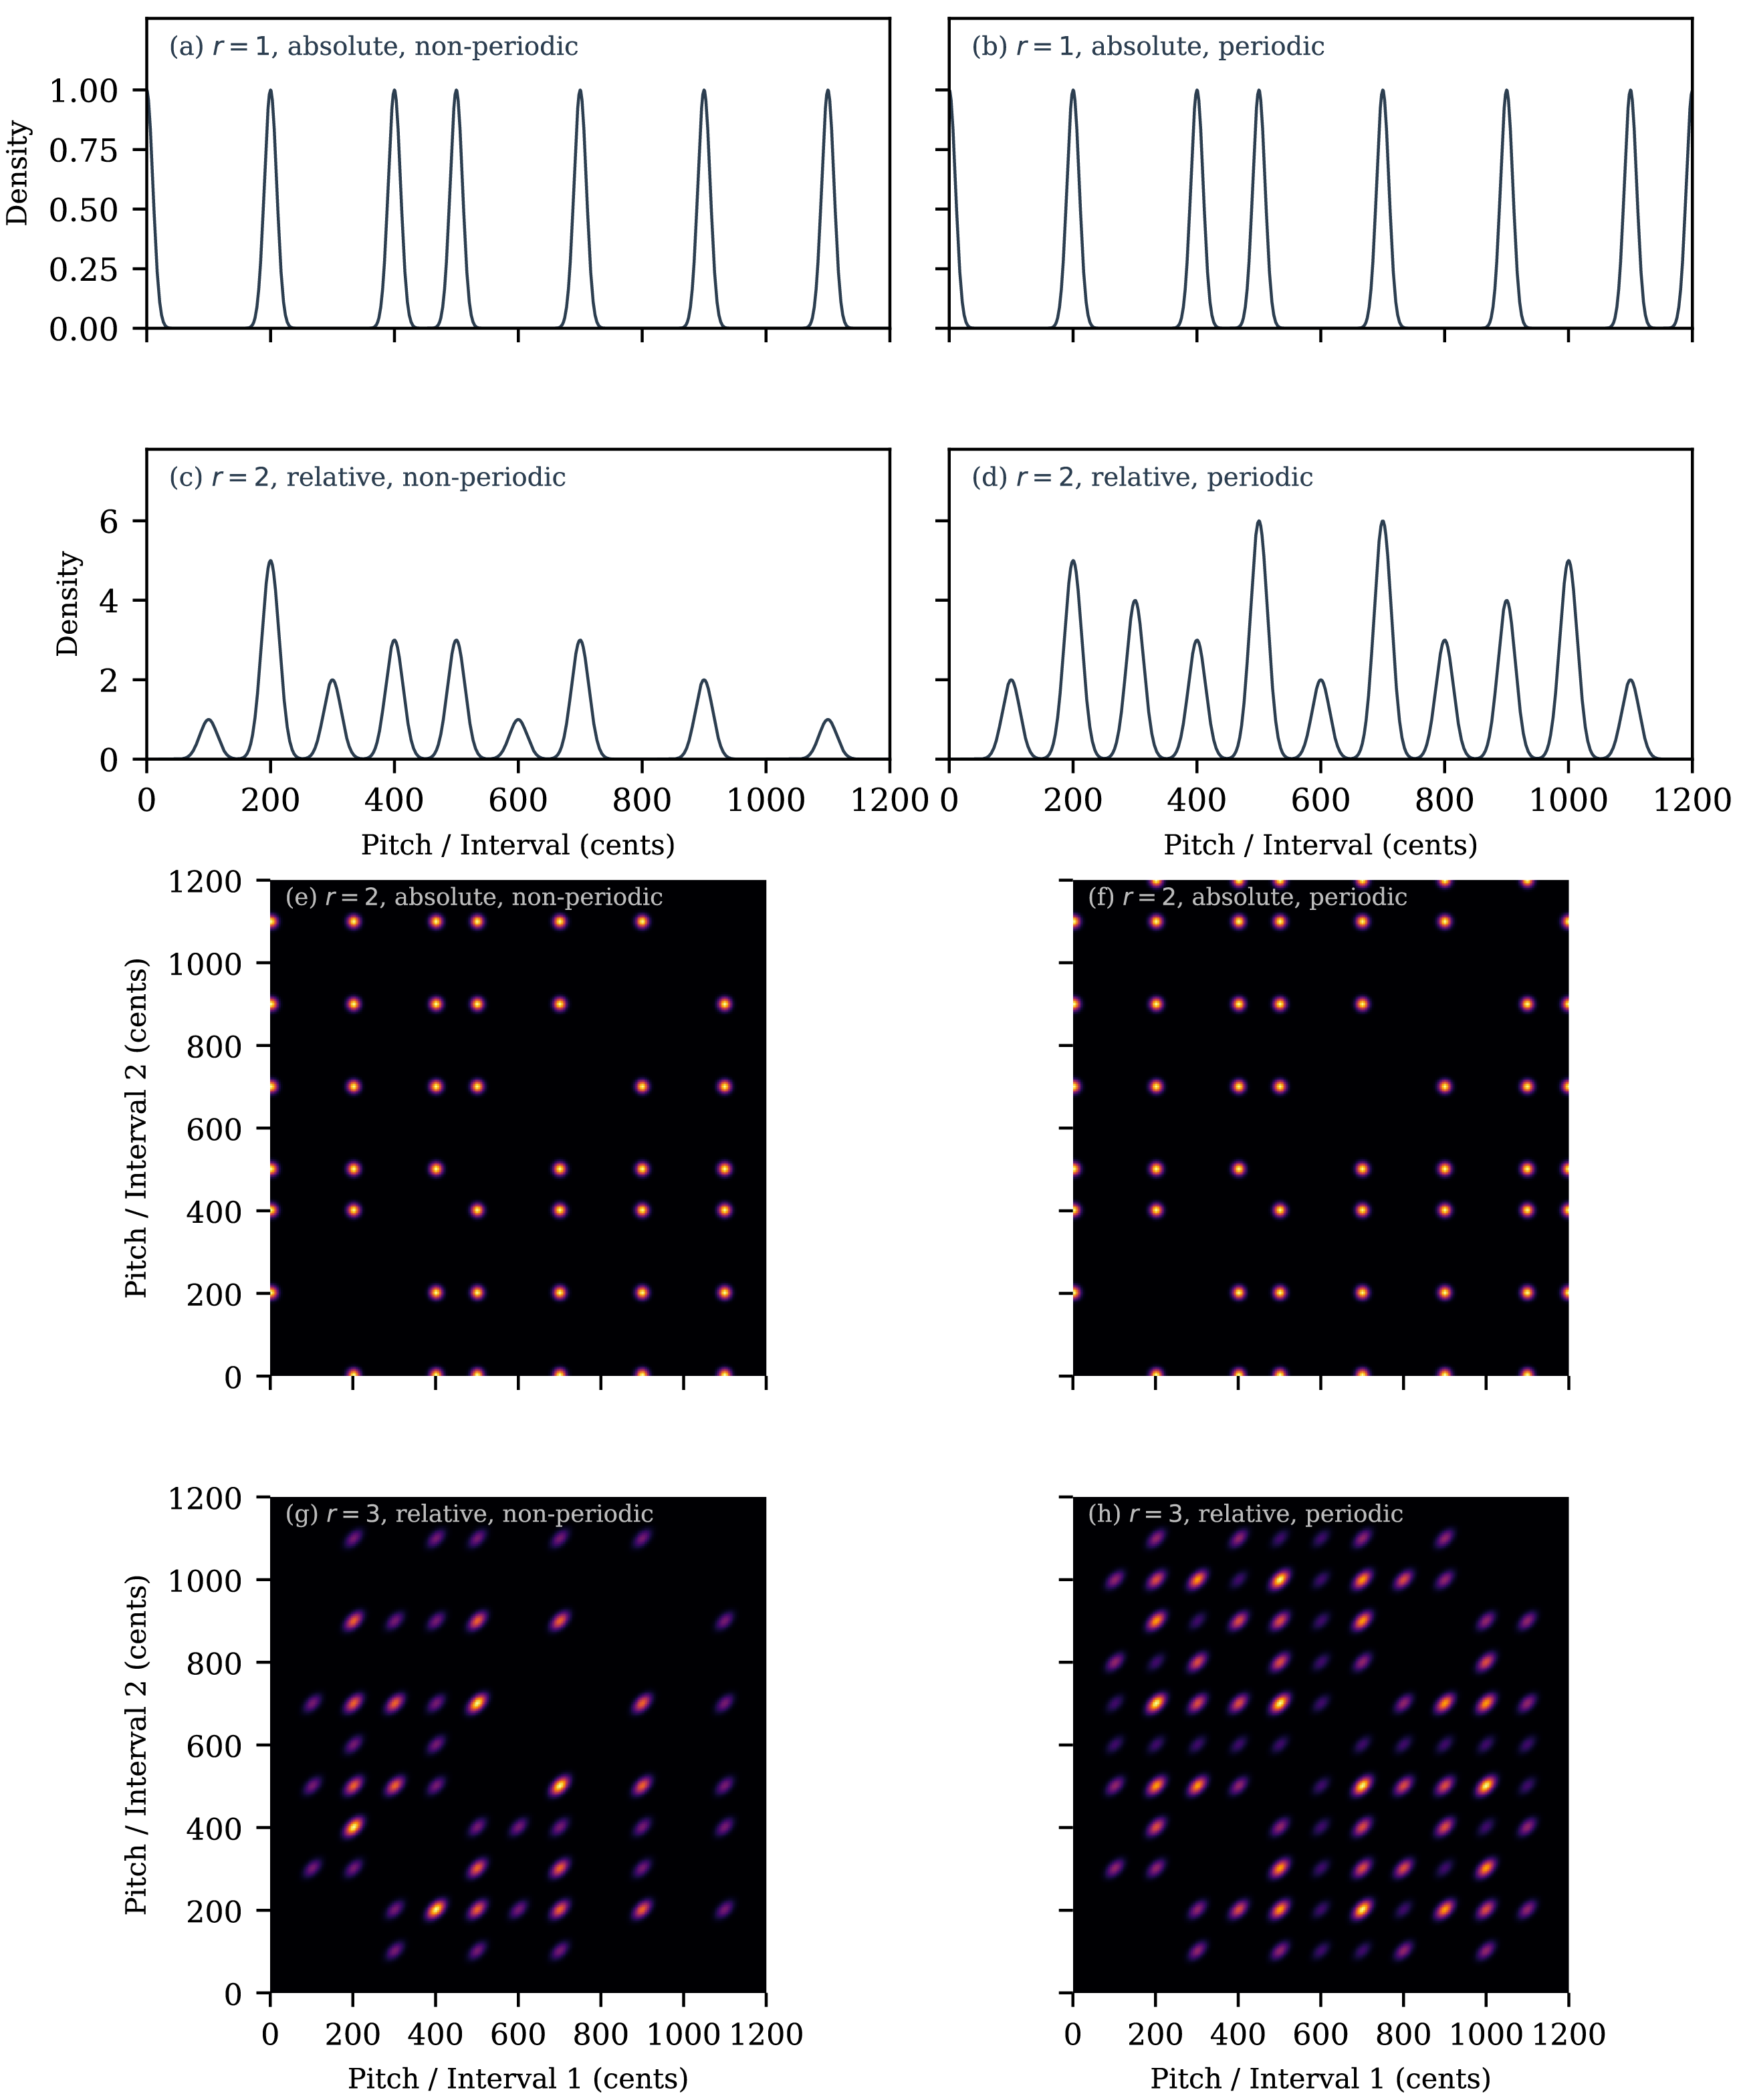
Figure 2
Spectral pitch class similarity of 20‑tone generator‑chain tunings against two reference chords: the 4:5:6 just intonation (JI) major triad (right half, red) and the 4:5:6:7 JI tetrad (left half, blue). Uniform weights; cents. With a single reference chord, each plot would have left–right reflective symmetry since generator and its complement produce the same pitch set. (a) (relative dyads; 0.1‑cent resolution): radial distance on the right indicates how closely different generator‑chain tunings approximate the pairwise intervals within the 4:5:6 triad (4:5, 5:6, 2:3); on the left, it indicates the same for the pairwise intervals within the 4:5:6:7 tetrad (4:5, 5:6, 2:3, 4:7, 5:7, 6:7). (b) (relative triads; 1‑cent resolution): the right half indicates how closely tunings approximate the 4:5:6 triad as a whole, while the left half indicates approximations to the four triads within the 4:5:6:7 tetrad (4:5:6, 4:5:7, 4:6:7, 5:6:7).
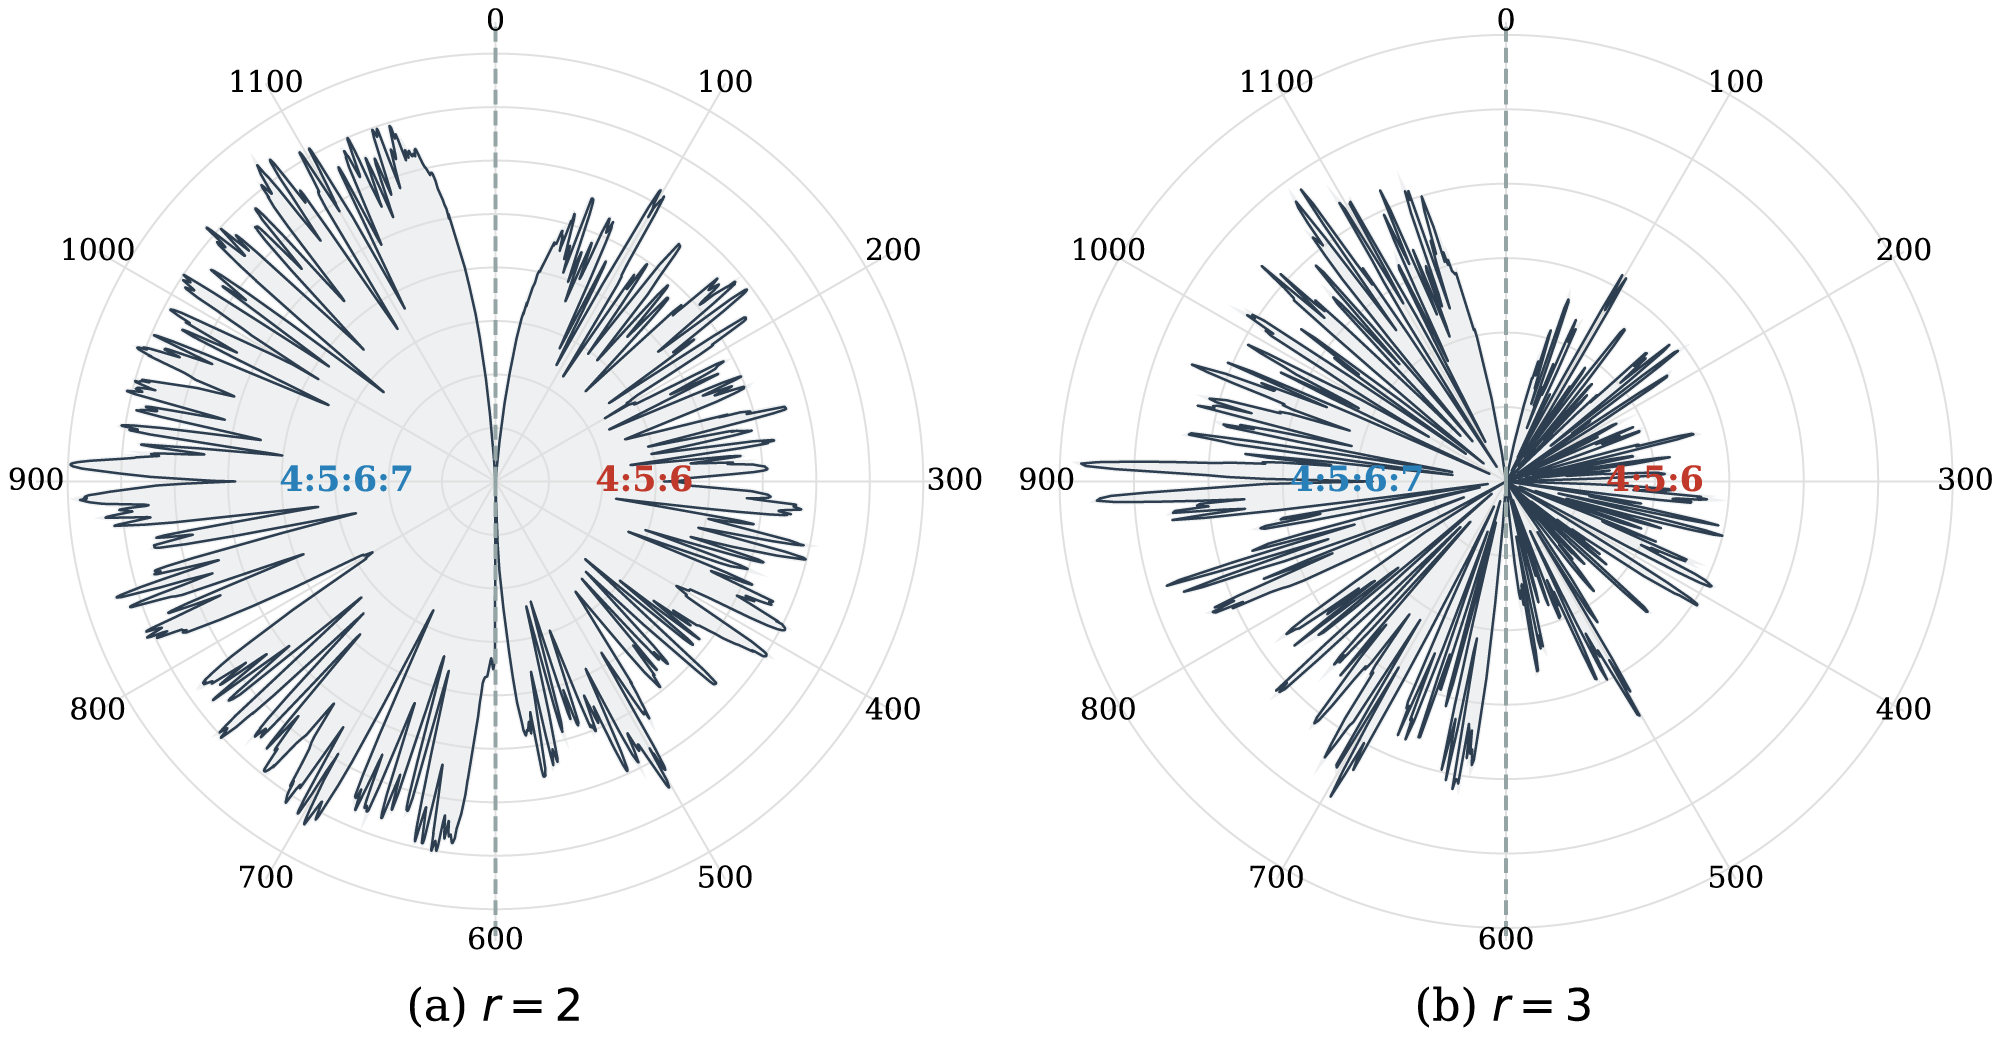
Figure 3
Expectation tensor densities for the diatonic scale ( cents, period = 1200 cents) across eight mode combinations. Left column: non‑periodic; right column: periodic. (a, b) Absolute monad (, dim = 1). (c, d) Relative dyad (, dim = 1). (e, f) Absolute dyad (, dim = 2). (g, h) Relative triad (, dim = 2). Periodic densities wrap at the octave; relative densities are transposition‑invariant. The pitch set shown is not specific to C major—any rotation of the diatonic scale yields the same relative densities and the same absolute densities up to translation.
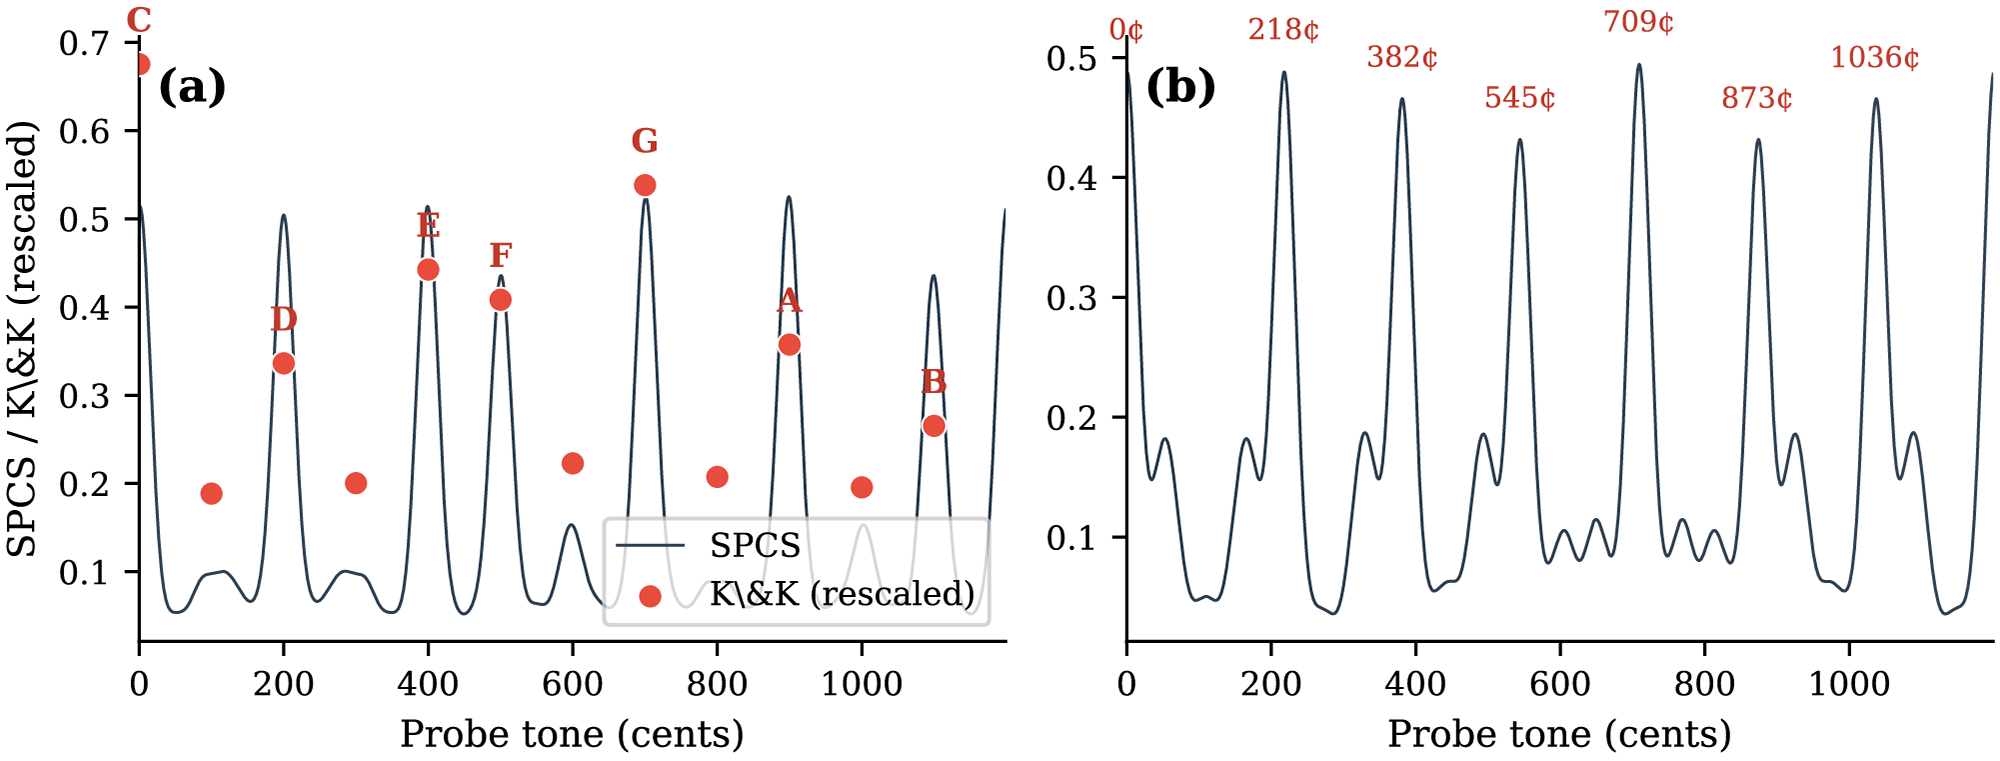
Figure 4
Spectral pitch class similarity (SPCS) of probe tones against two reference scales. (a) C major scale in 12‑TET, with Krumhansl and Kessler’s (1982) empirical probe‑tone ratings (red dots, affinely rescaled to minimize squared error with SPCS values at the 12 semitone positions; with these parameters). (b) Porcupine[7] scale in 22‑EDO (step pattern 4333333) suggesting a psychoacoustically motivated major tonic on the scale’s first degree and minor tonic on its fifth degree. (EDO stands for equal divisions of the octave.)
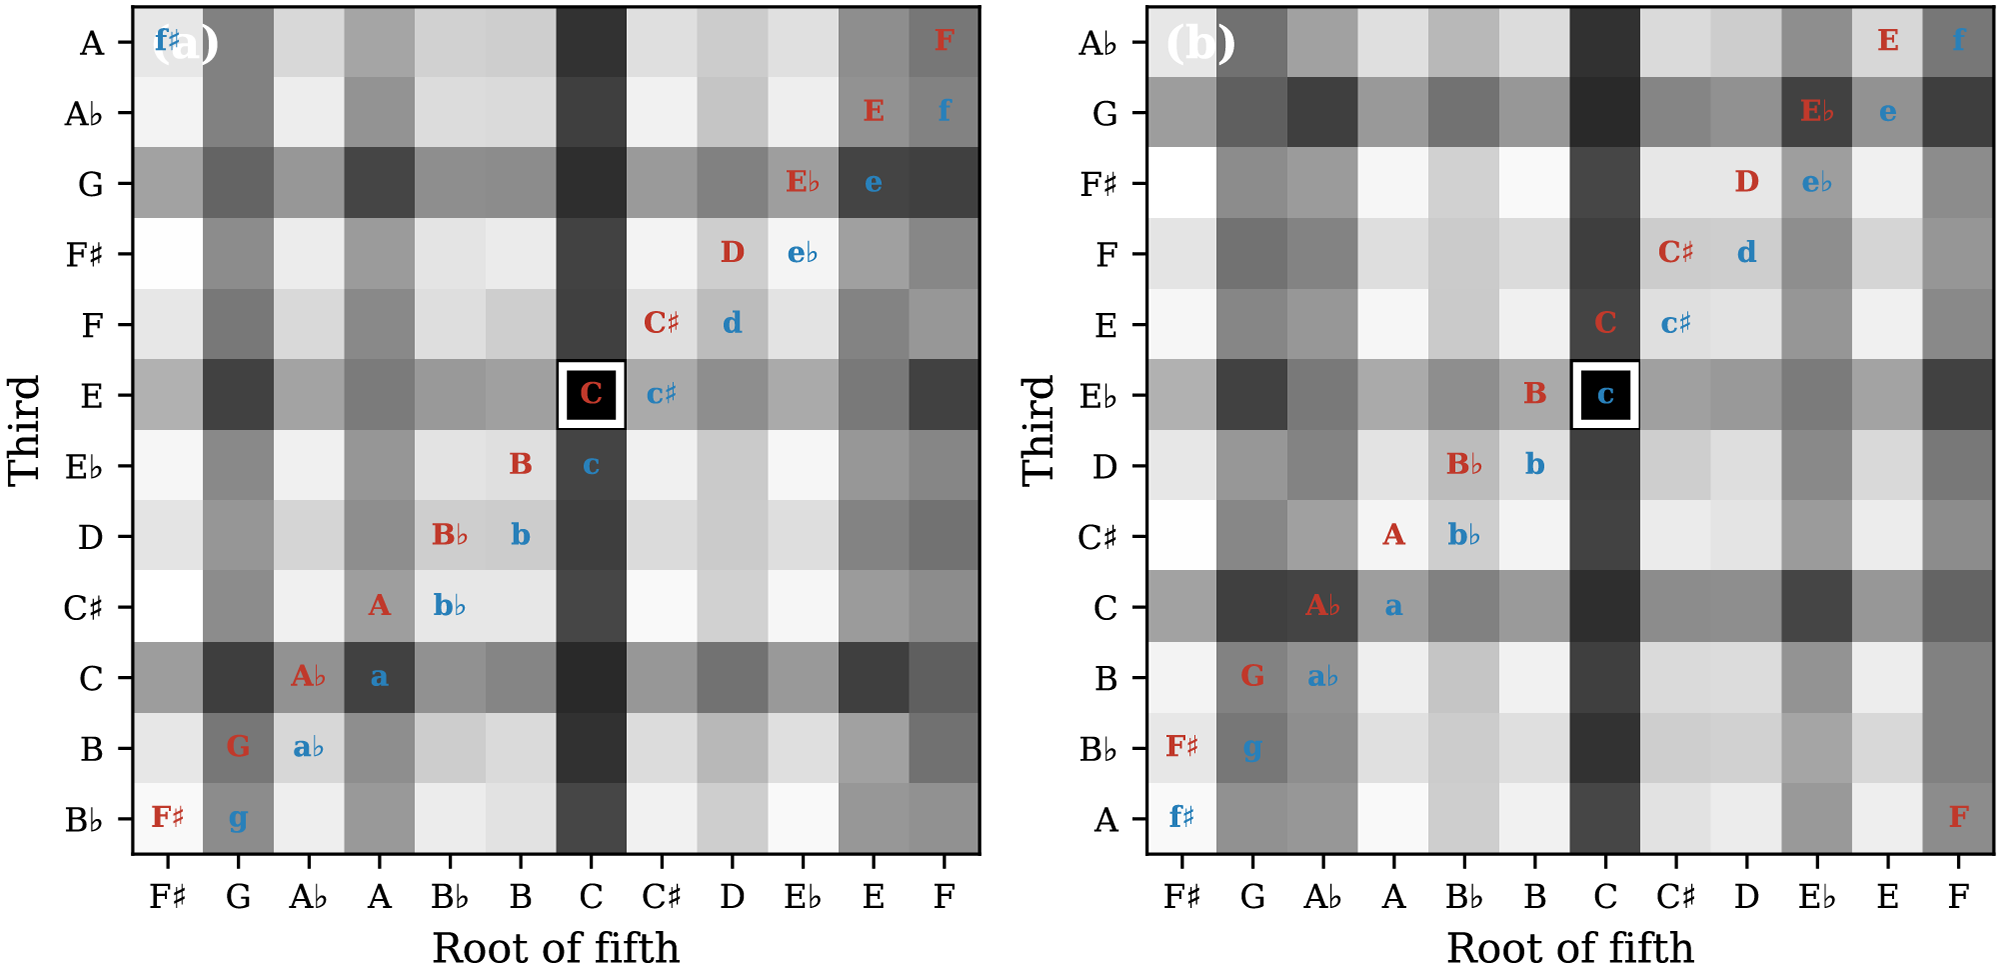
Figure 5
Spectral pitch class similarity of all 12‑EDO triads comprising a perfect fifth relative to (a) a C major reference and (b) a C minor reference. Major triads are labelled in red, while minor ones are labelled in blue; the white square marks the reference. Darker cells indicate greater similarity.
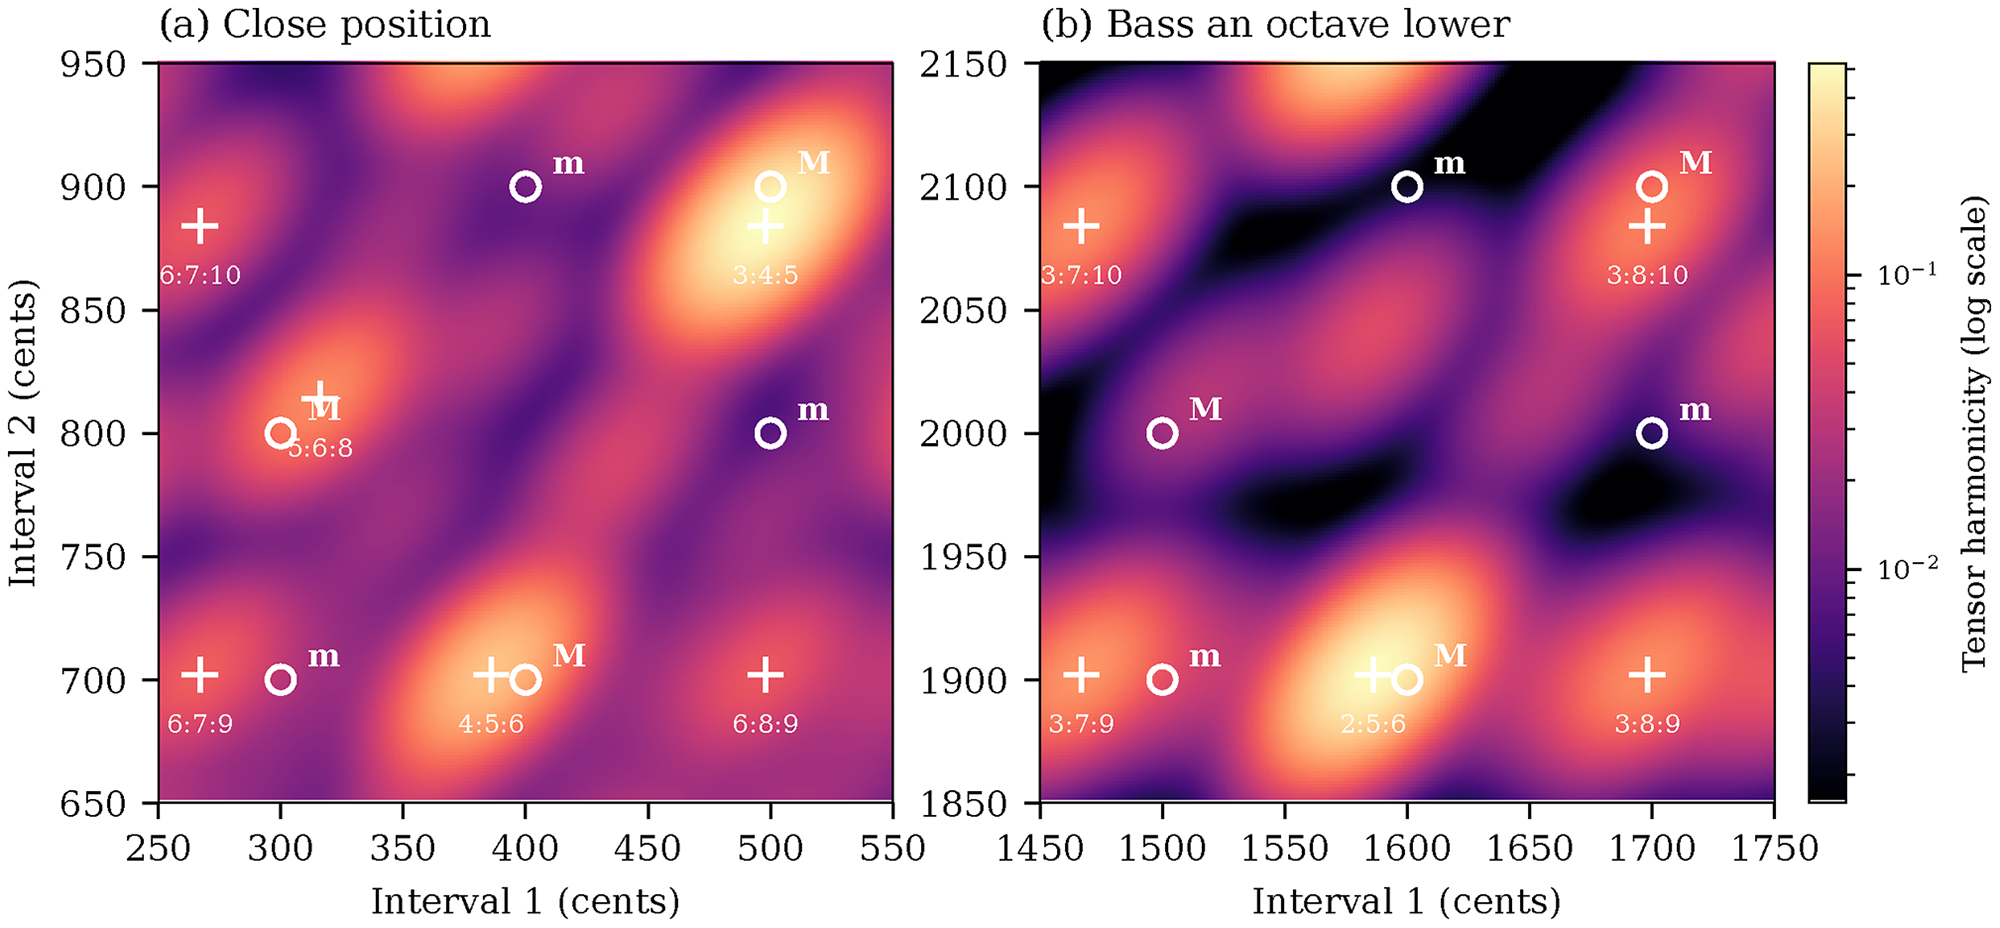
Figure 6
Tensor harmonicity across two regions of the triad landscape, at 1‑cent resolution, with for cents as in Figure 7c, at the article’s 16 harmonics per tone. Open circles mark the six 12‑EDO voicings, major (M) and minor (m) in root position and first and second inversion; crosses mark the local maxima, labelled with the simplest integer frequency ratio that produces each. (a) Close position, where the second inversion scores highest. Note that the just minor triad 10:12:15 is not itself a maximum, lying between peaks, whereas the subminor 6:7:9 to its left is one. (b) The same six chords with the bass an octave lower, where root position scores highest instead. Colour is logarithmic, for legibility only: which transformation of the density best reflects perception is an open question.
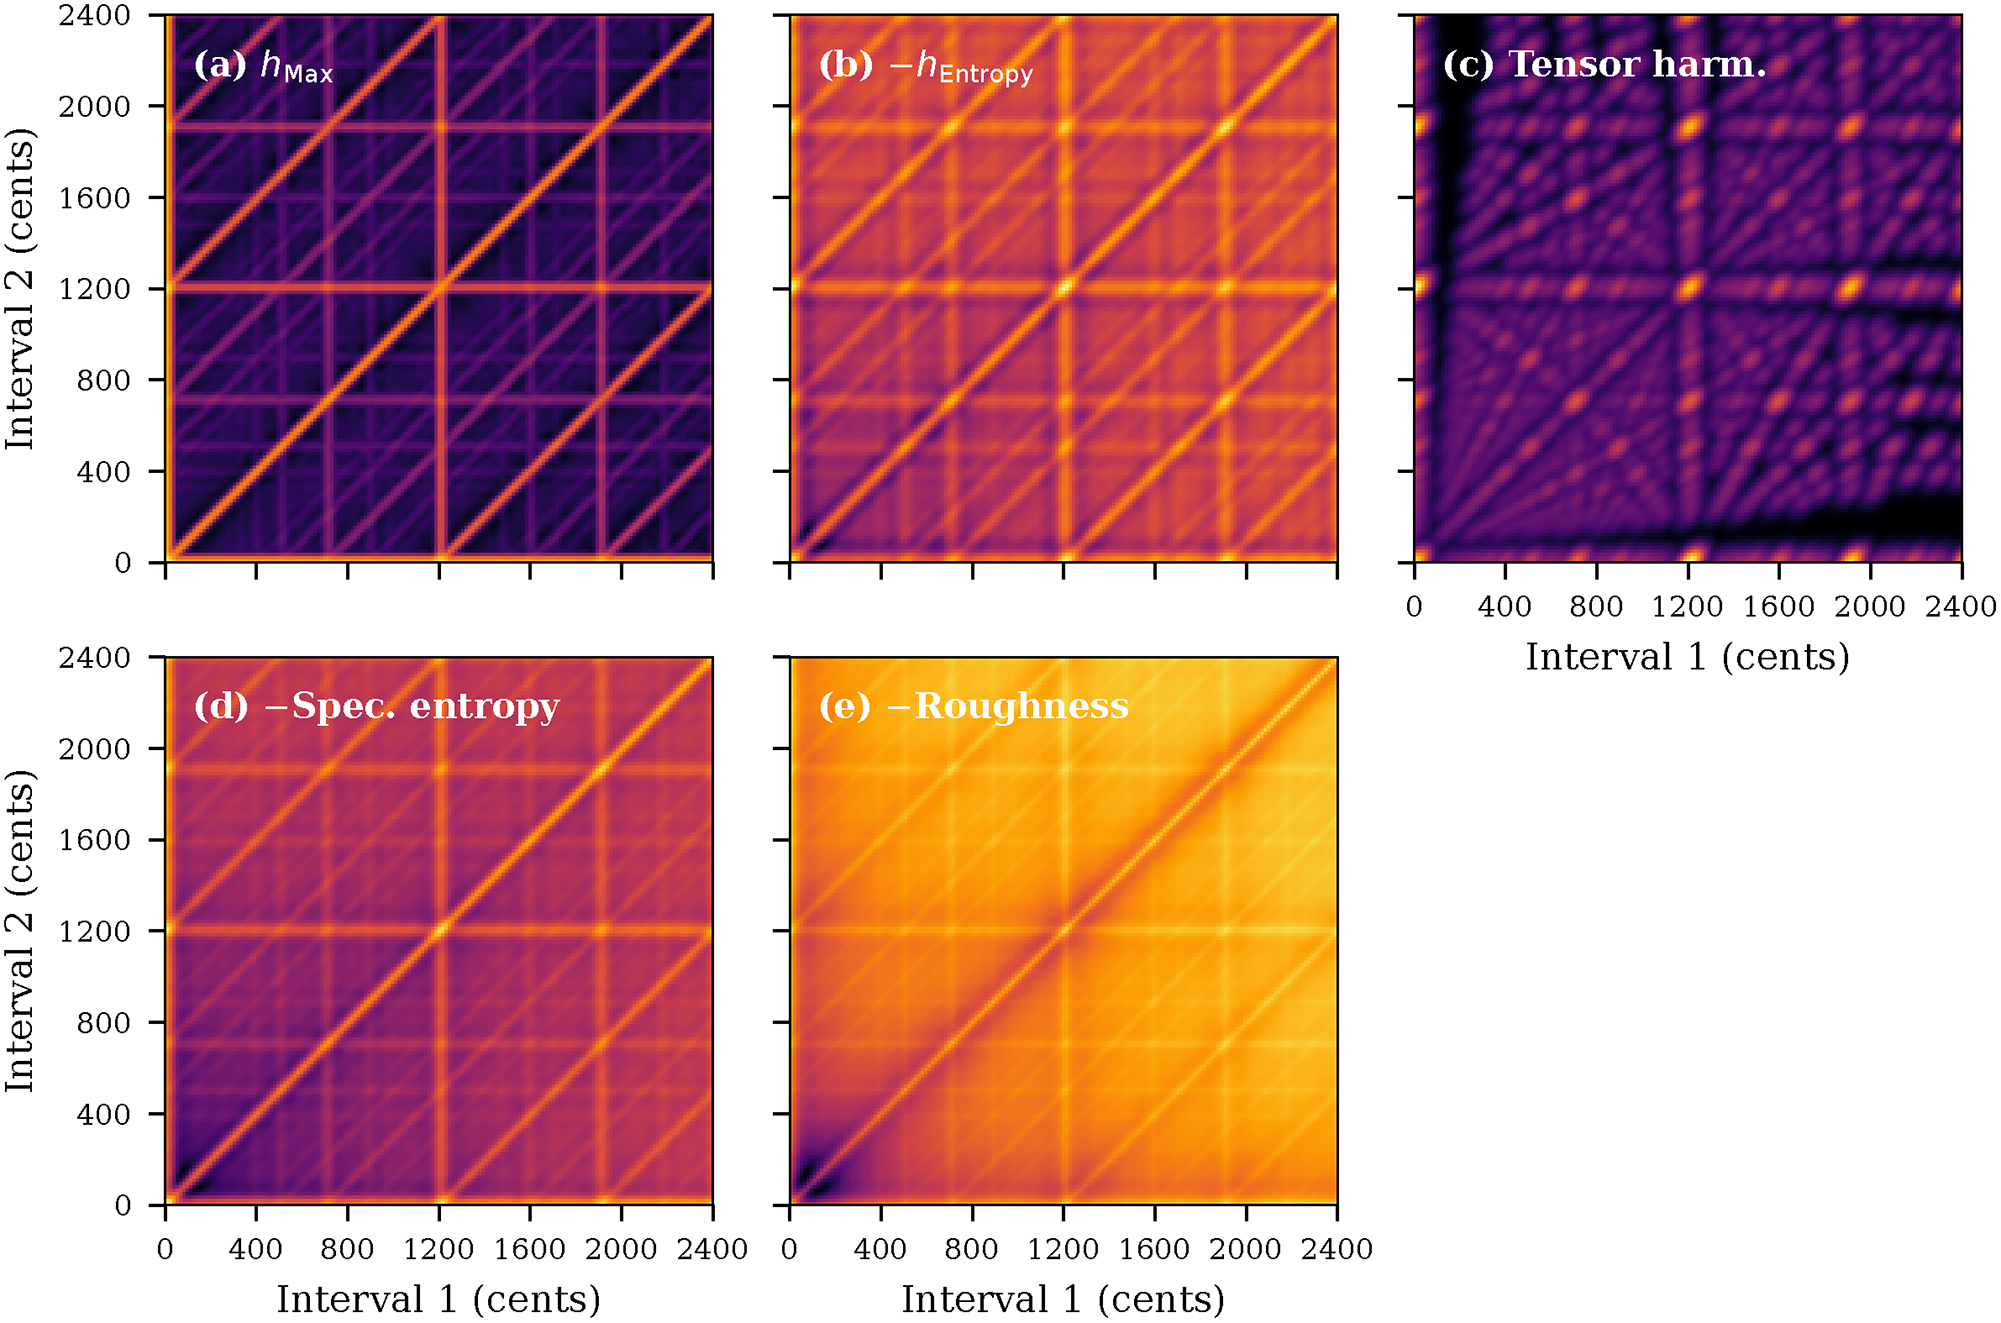
Figure 7
Five consonance‑related measures for triads with both intervals swept from 0 to 2400 cents. Brighter regions indicate higher consonance (roughness and spectral entropy are negated so that peaks correspond to consonance in all panels). Here, cents, the value used for spectral entropy and template harmonicity in Milne et al. (2023b); tensor harmonicity uses , for the reason given in Section 3.3. Note the distinctive topography of tensor harmonicity (c) compared to the other measures. (Different gamma compressions have been applied to ensure the visibility of low‑level features.)
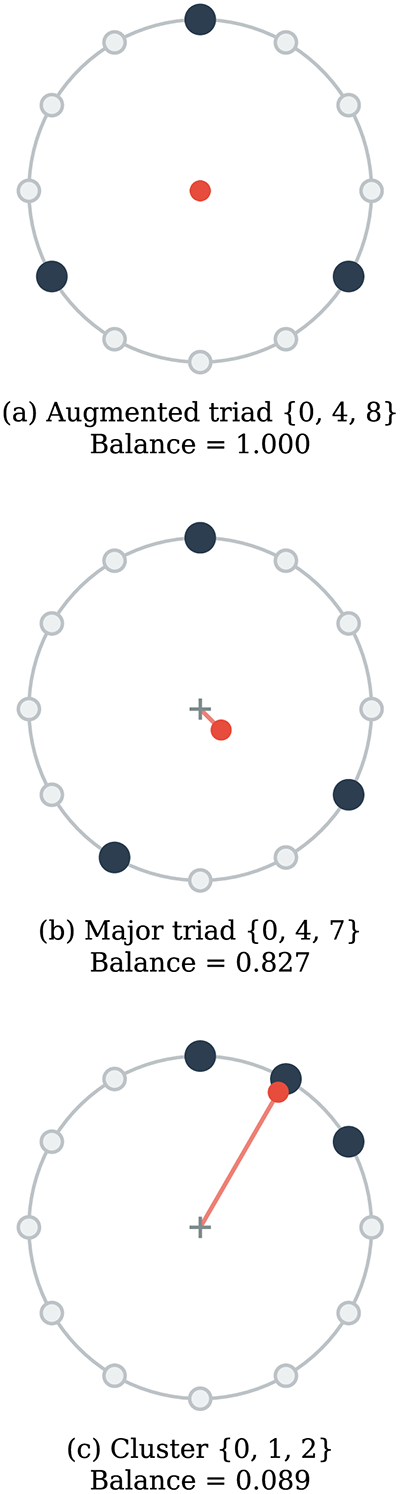
Figure 8
Balance illustrated on the chromatic circle. Filled circles mark pitch classes in each set; the small red circle shows the centre of gravity of the set, and the red line connects it to the circle’s centre. (a) The augmented triad is perfectly balanced: its centre of gravity lies at the centre. (b) The major triad is nearly balanced. (c) The cluster is highly unbalanced: its centre of gravity is far from the centre.
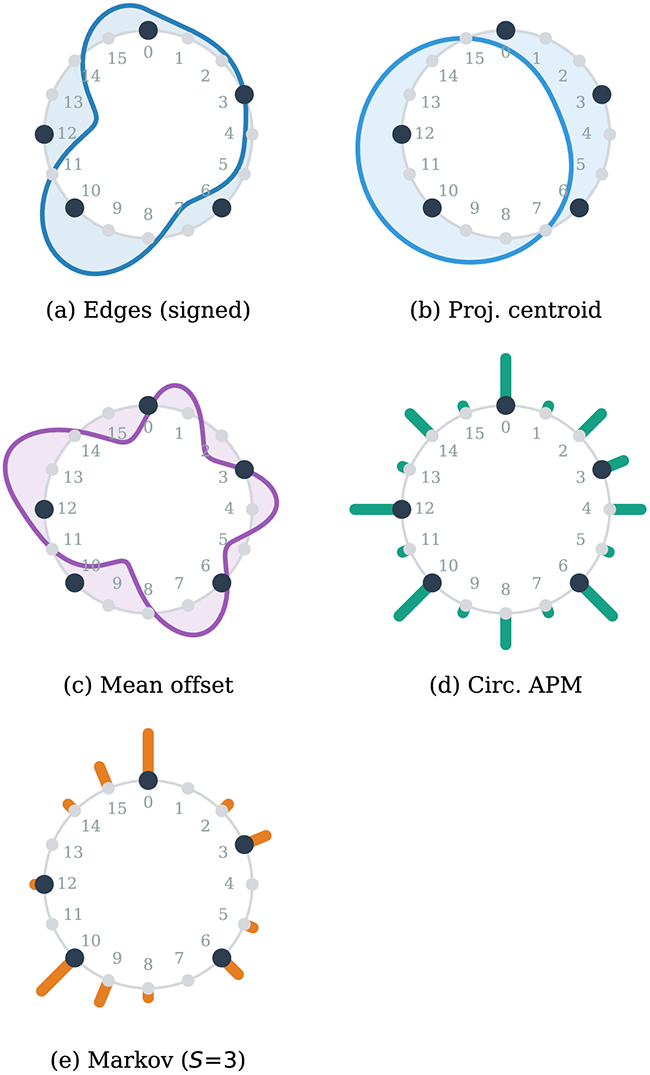
Figure 9
Five position‑level features for the son clave rhythm in a 16‑step cycle. Event positions are marked by filled black circles; position 0 is at 12 o’clock and positions proceed clockwise. Smooth curves (a–c) show continuous features; bars (d, e) show discrete features. Each panel is scaled radially to its own maximum absolute value. (a) Signed edges (): positive values (outward) mark transitions from sparse to dense; negative (inward) mark them from dense to sparse. (b) Projected centroid: near zero throughout (maximum magnitude 0.016, against 1 for a single event) reflecting the pattern’s near‑perfect balance. (c) Mean offset. (d) Circular APM (summed across lags). (e) Markov prediction ().
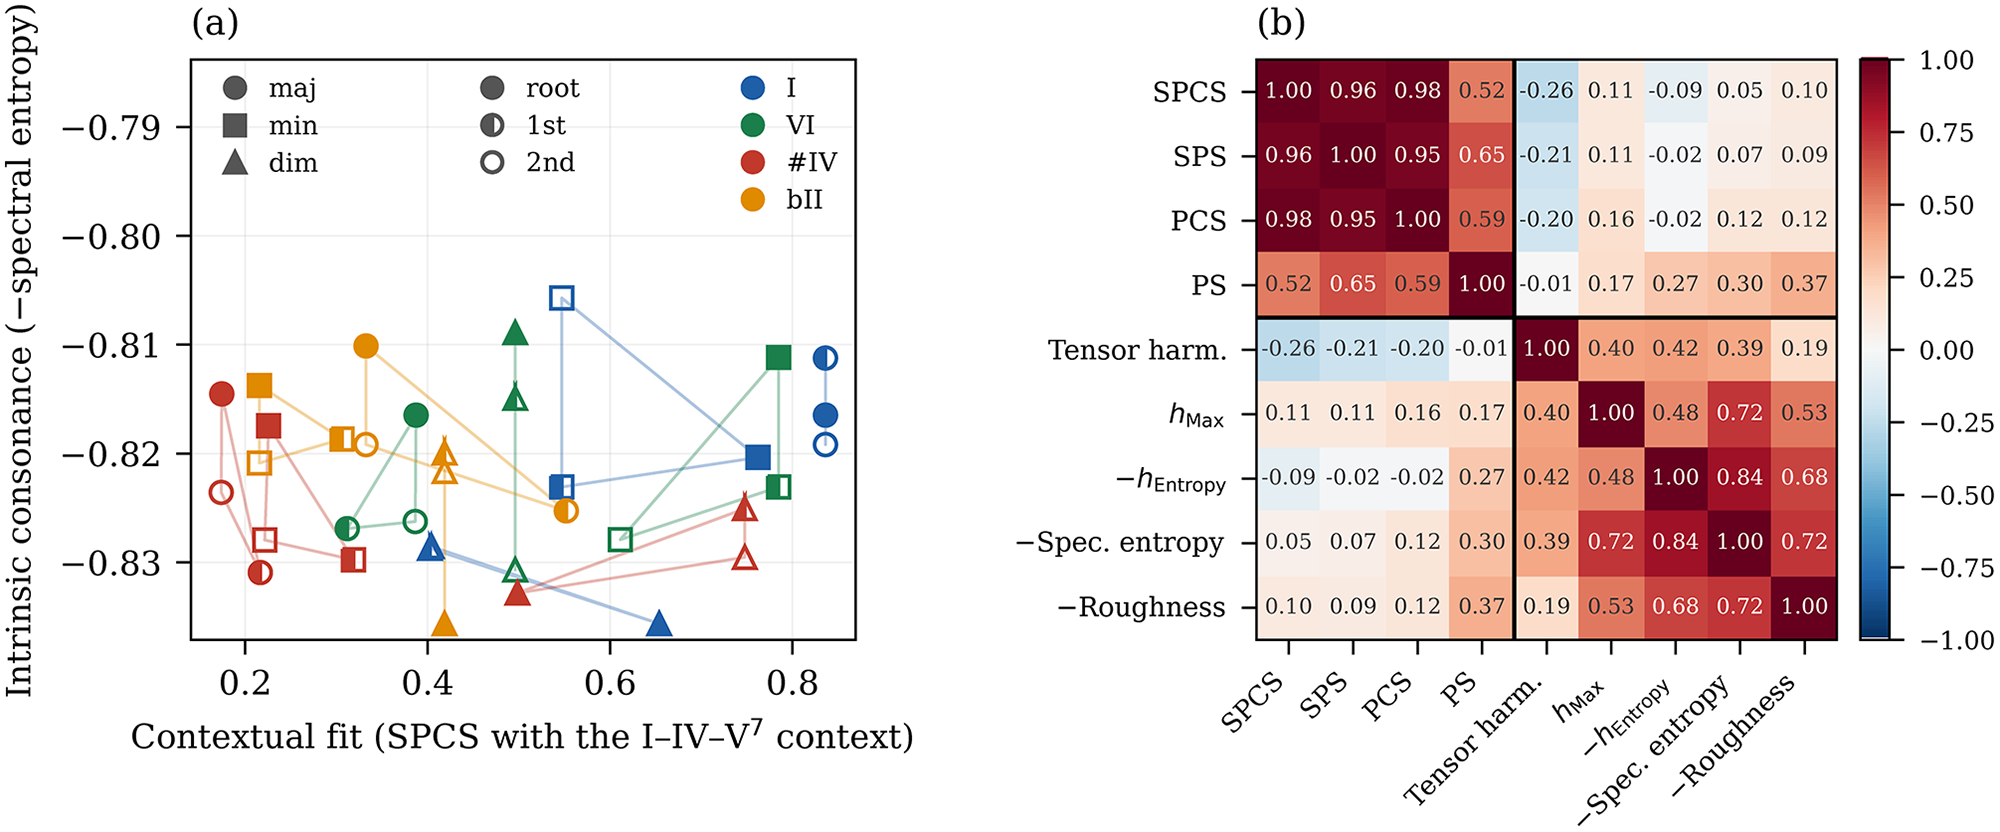
Figure 10
The worked application of Section 5. Entropies and roughness are negated throughout, so that every measure increases with consonance. (a) The 36 probes plotted by fit to the context against intrinsic consonance (spectral entropy). Marker shape gives chord quality, fill gives inversion, colour gives the root, and faint triangles join the three inversions of each chord. Since no two probes are transpositions of one another, the vertical spread reflects quality and voicing rather than the root, to which spectral entropy is invariant. (b) Spearman rank correlations among the nine predictors; the rule separates the fit measures from the consonance measures.