
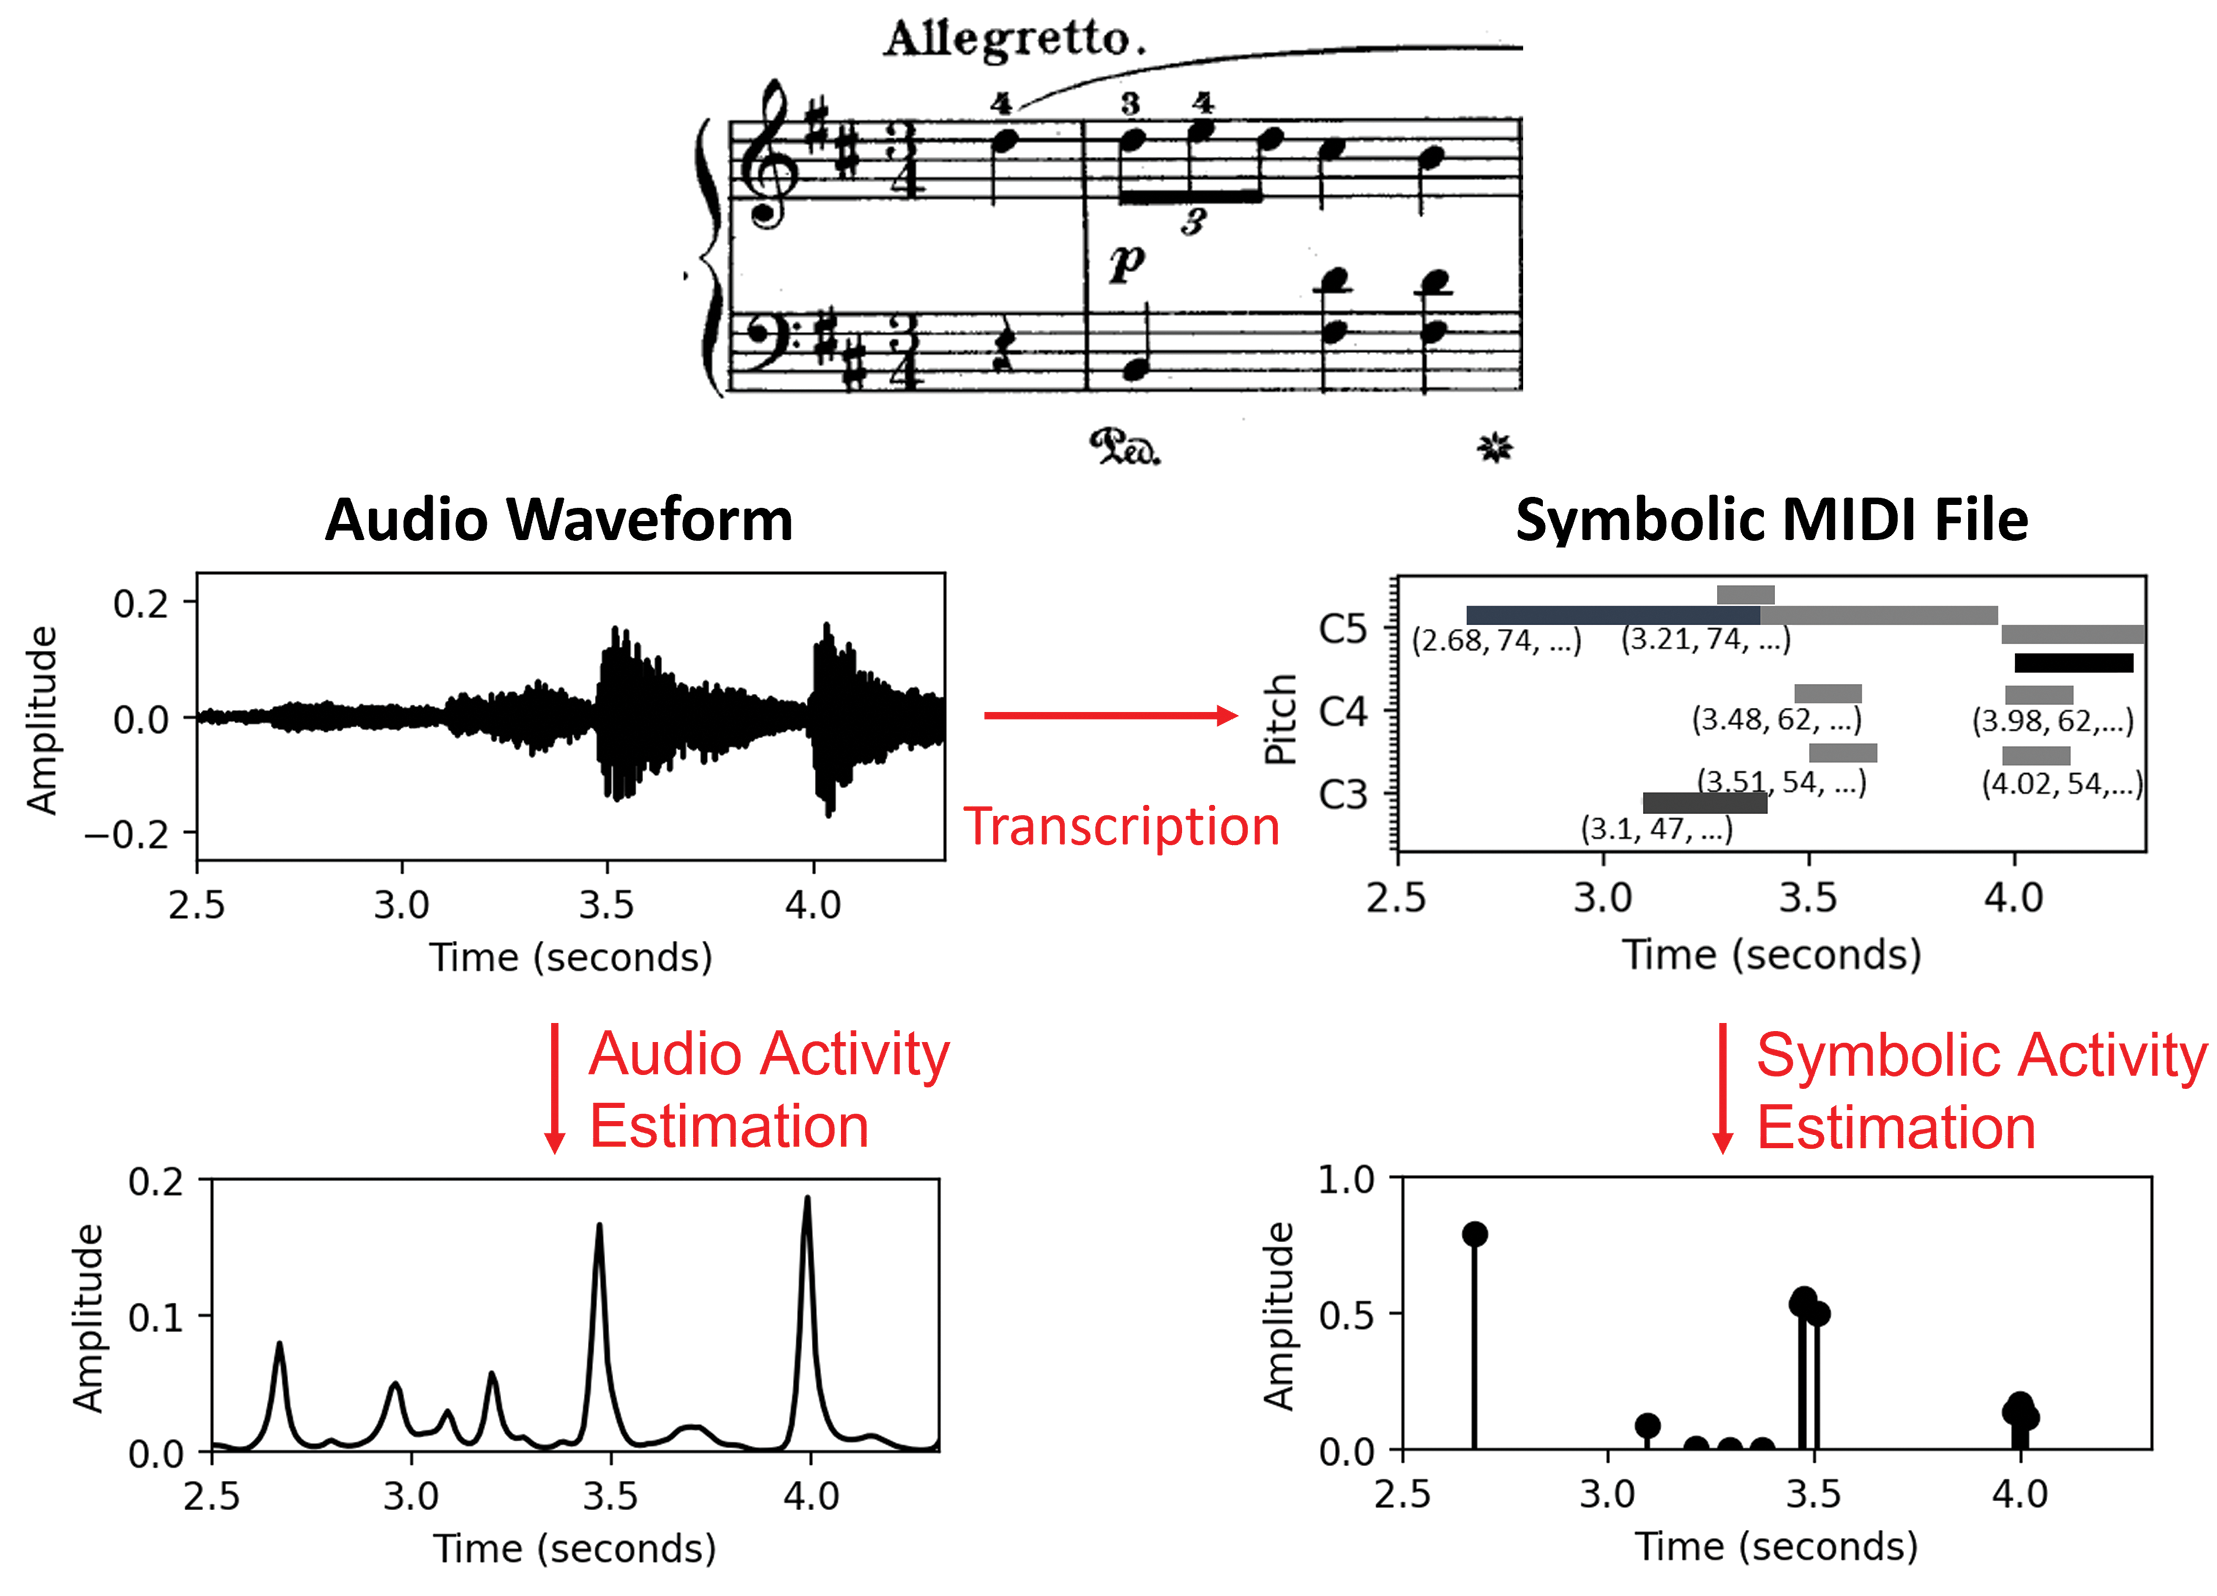
Figure 1
Beat activity estimation of an audio representation using a frame‑based approach (left) and a symbolic representation using an event‑based approach (right).

Figure 2
Overview of the system. F2E: frame‑to‑event conversion; E2F: event‑to‑frame conversion.
Table 1
The five Chopin Mazurkas and their identifiers used in our study. The last three columns indicate the number of beats, performances, and total duration (in hours) available for the respective piece. Dur.: duration; h: hours; ID: identifier; Perf.: performances; Op.: Opus.
| ID | Piece | Number (Beats) | Number (Perf.) | Dur. (h) |
|---|---|---|---|---|
| M17‑4 | Op. 17, No. 4 | 396 | 64 | 4.62 |
| M24‑2 | Op. 24, No. 2 | 360 | 64 | 2.44 |
| M30‑2 | Op. 30, No. 2 | 193 | 34 | 0.80 |
| M63‑3 | Op. 63, No. 3 | 229 | 88 | 3.15 |
| M68‑3 | Op. 68, No. 3 | 181 | 51 | 1.43 |
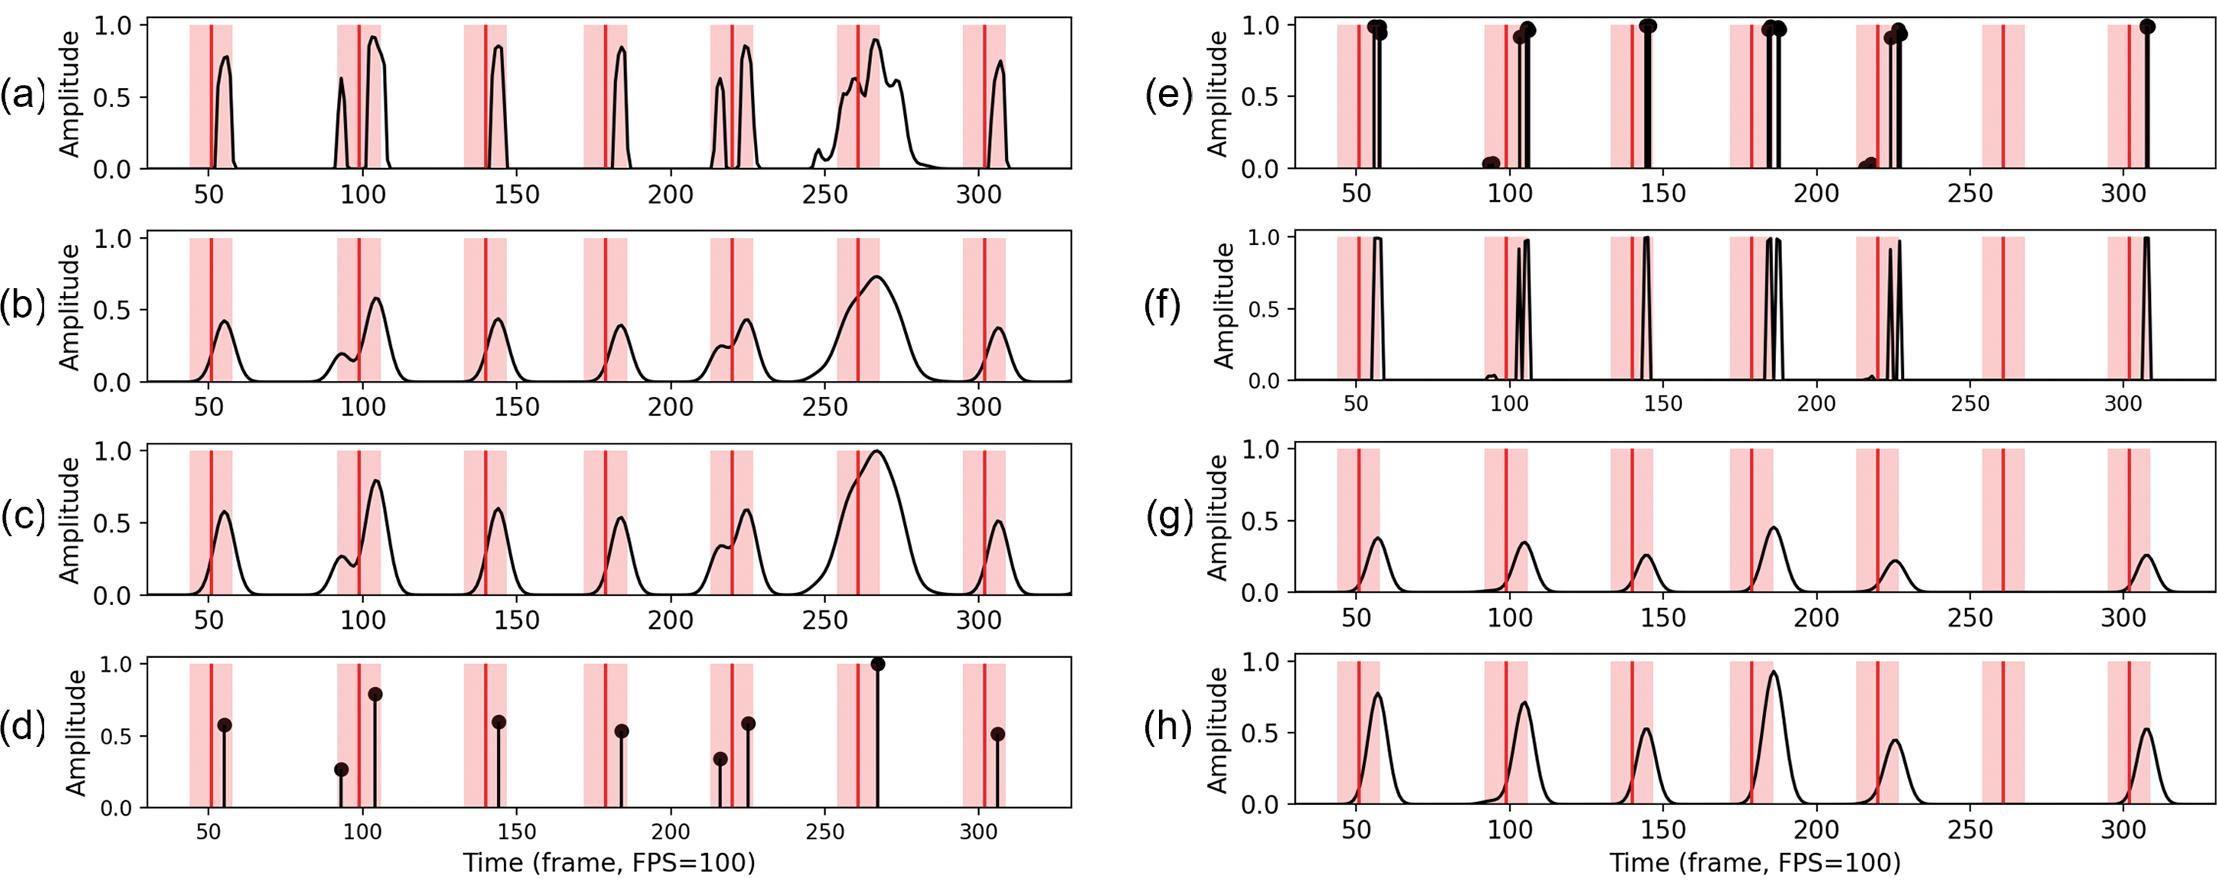
Figure 3
Processing of beat activation functions. (a) Frame‑based activation function from an audio activity estimator. (b) Gaussian smoothing of (a). (c) Max normalization of (b). (d) Peak‑picking results of (c). (e) Event‑based activation function from a symbolic activity estimator. (f) Event‑to‑frame conversion of (e). (g) Gaussian smoothing of (f). (h) Max normalization of (g). Red vertical lines indicate reference annotated beats. Red regions highlight the 70 ms tolerance window.
Table 2
Work‑wise average beat‑tracking results for pretrained models. (Top) madmom‑based audio beat trackers. (Bottom) PM2S‑based symbolic beat trackers. The best results are highlighted in bold. GLB: global; LOC: local.
| Threshold | F‑measure | L‑correct | ||||
|---|---|---|---|---|---|---|
| F1 | P | R | F‑L2 | F‑L3 | F‑L4 | |
| Audio beat trackers (ABTs) | ||||||
| GLB‑0.01 | 0.7570.054 | 0.6320.071 | 0.9680.020 | 0.5490.116 | 0.4760.130 | 0.4090.140 |
| GLB‑0.1 | 0.8250.053 | 0.7300.074 | 0.9630.021 | 0.6980.101 | 0.6390.119 | 0.5650.140 |
| GLB‑0.25 | 0.8860.048 | 0.8770.056 | 0.9010.053 | 0.8310.080 | 0.7950.098 | 0.7460.125 |
| GLB‑0.5 | 0.6600.108 | 0.9550.037 | 0.5180.118 | 0.4870.160 | 0.3720.174 | 0.2840.161 |
| Oracle | 0.8920.045 | 0.8660.061 | 0.9230.044 | 0.8420.071 | 0.8090.089 | 0.7590.120 |
| LOC‑5 | 0.8350.047 | 0.7480.066 | 0.9580.024 | 0.7450.080 | 0.6960.098 | 0.6280.121 |
| LOC‑10 | 0.8400.048 | 0.7550.067 | 0.9580.024 | 0.7460.082 | 0.6960.100 | 0.6270.124 |
| LOC‑20 | 0.8380.048 | 0.7510.068 | 0.9600.024 | 0.7370.084 | 0.6860.102 | 0.6160.125 |
| Symbolic beat trackers (SBTs) | ||||||
| GLB‑0.01 | 0.8230.045 | 0.7410.064 | 0.9370.038 | 0.7000.092 | 0.6060.123 | 0.4970.148 |
| GLB‑0.1 | 0.8360.056 | 0.8770.064 | 0.8040.072 | 0.7230.101 | 0.6480.129 | 0.5680.149 |
| GLB‑0.25 | 0.7750.070 | 0.9130.057 | 0.6790.091 | 0.5890.135 | 0.4880.161 | 0.4000.175 |
| GLB‑0.5 | 0.6620.092 | 0.9350.052 | 0.5220.107 | 0.3710.163 | 0.2580.174 | 0.2010.168 |
| Oracle | 0.8550.048 | 0.8450.072 | 0.8700.052 | 0.7670.084 | 0.6980.114 | 0.6210.138 |
| LOC‑5 | 0.8410.056 | 0.9150.055 | 0.7820.069 | 0.7450.100 | 0.6760.131 | 0.6020.152 |
| LOC‑10 | 0.8420.056 | 0.9150.055 | 0.7830.068 | 0.7460.099 | 0.6770.129 | 0.6040.152 |
| LOC‑20 | 0.8440.055 | 0.9150.055 | 0.7860.067 | 0.7500.097 | 0.6820.128 | 0.6100.150 |
Table 3
Work‑wise average of beat‑tracking results (including late‑fusion approaches). Beat‑tracking results (including late‑fusion approaches) were derived using peak‑picking with local average threshold with a window length of 20 seconds (LOC‑20). The best results are highlighted in bold.
| Activation | F‑measure | L‑correct | ||||
|---|---|---|---|---|---|---|
| F1 | P | R | F‑L2 | F‑L3 | F‑L4 | |
| Pretrained | ||||||
| 0.8380.048 | 0.7510.068 | 0.9600.024 | 0.7370.084 | 0.6860.102 | 0.6160.125 | |
| 0.8440.055 | 0.9150.055 | 0.7860.067 | 0.7500.097 | 0.6820.128 | 0.6100.150 | |
| 0.8850.044 | 0.8380.063 | 0.9470.027 | 0.8230.071 | 0.7900.086 | 0.7440.109 | |
| 0.8500.051 | 0.9590.035 | 0.7650.067 | 0.7490.093 | 0.6840.121 | 0.6100.142 | |
| Retrained | ||||||
| 0.8160.038 | 0.7160.054 | 0.9650.014 | 0.6960.068 | 0.6060.087 | 0.4680.100 | |
| 0.9270.037 | 0.9190.042 | 0.9380.037 | 0.9020.053 | 0.8820.066 | 0.8580.082 | |
| 0.8600.036 | 0.7860.054 | 0.9620.015 | 0.7720.064 | 0.7120.079 | 0.6250.107 | |
| 0.9370.034 | 0.9430.031 | 0.9330.041 | 0.9170.047 | 0.8990.059 | 0.8820.069 | |
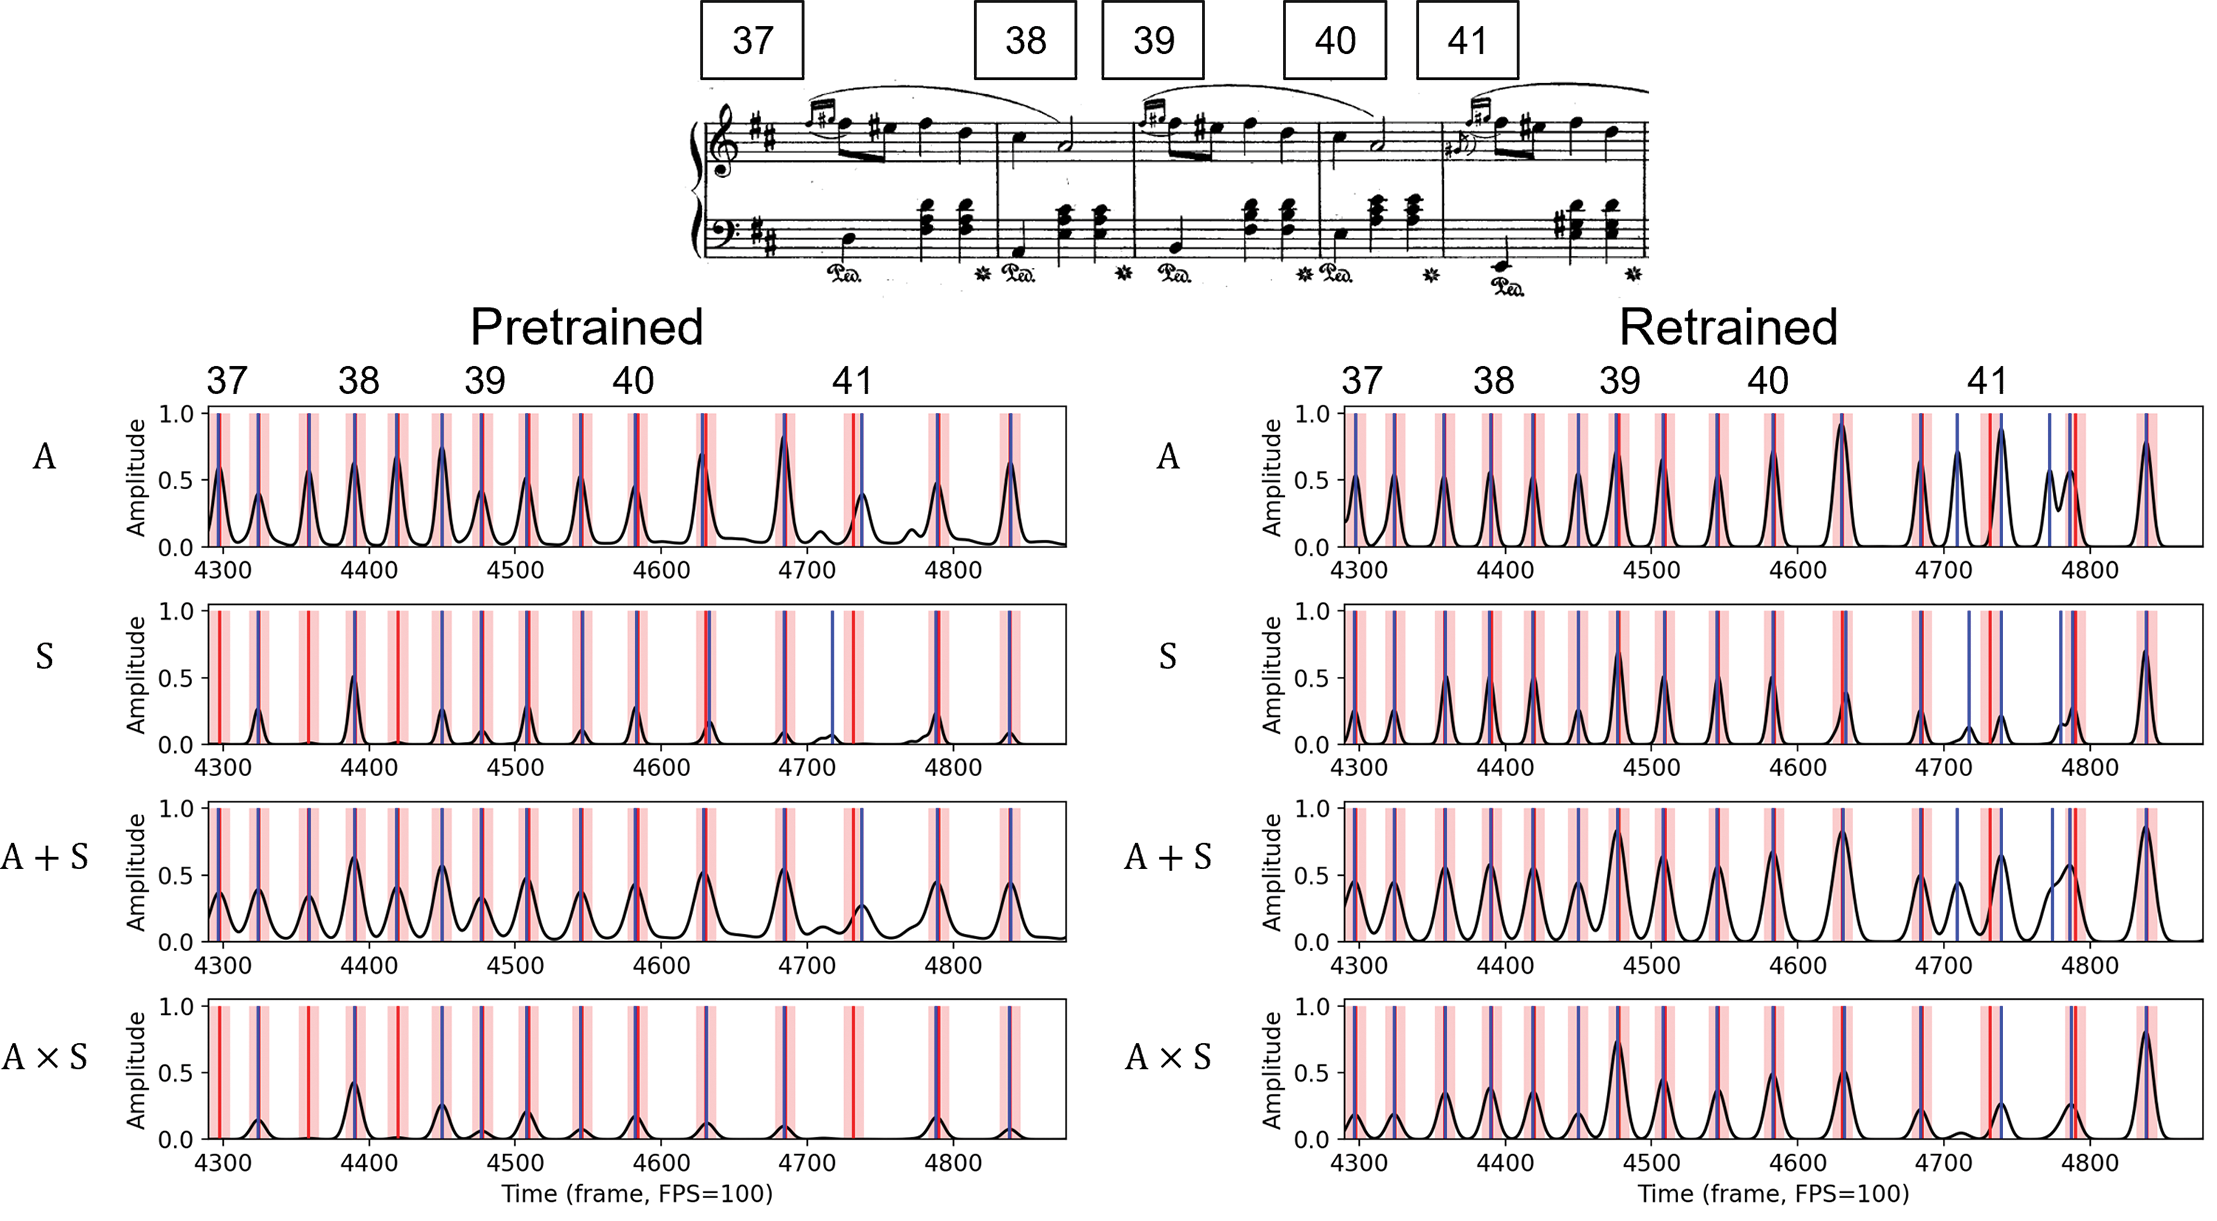
Figure 4
Comparison of four types of activations. (top) Music score of Op. 30, No.2. (left) Activation functions from pretrained models. (right) Activation functions from retrained models. Red regions highlight the 70 ms tolerance window. Blue vertical lines indicate the beat estimations derived using peak‑picking with the LOC‑20 threshold setting. Op.: Opus.
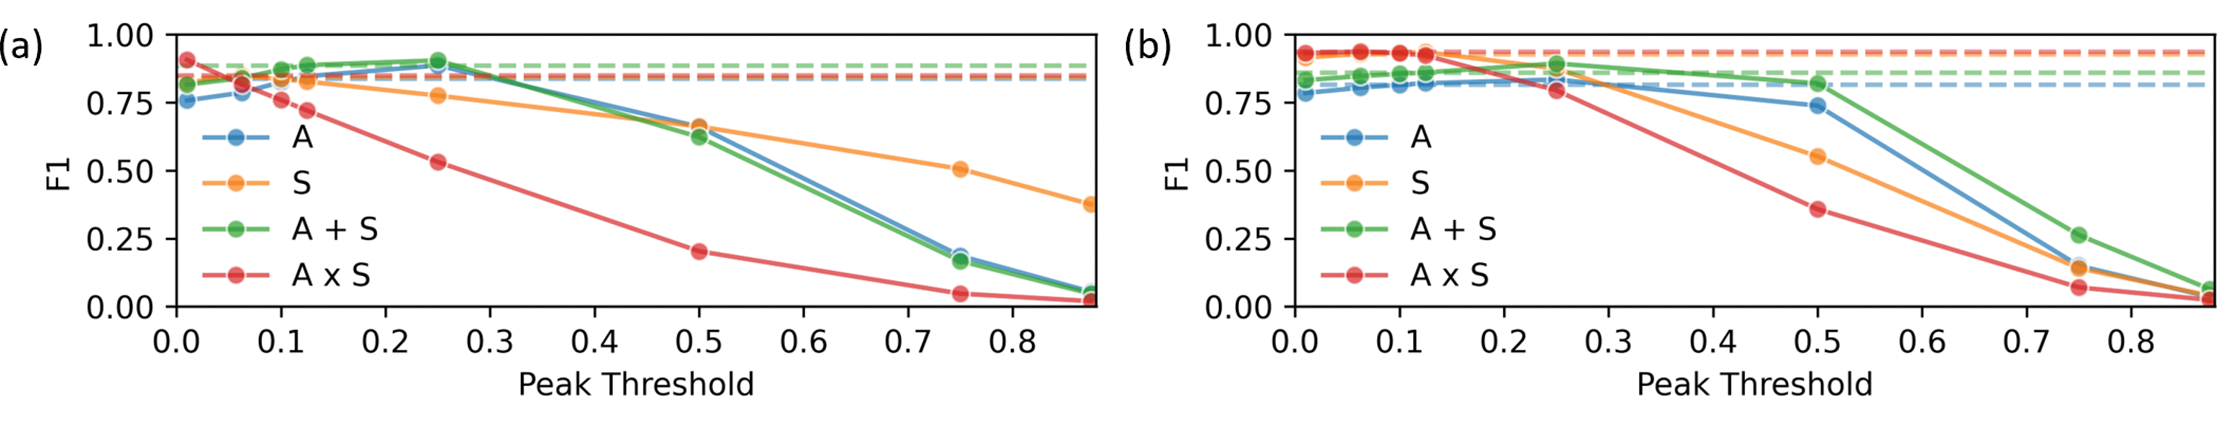
Figure 5
Effects of peak‑picking thresholds on beat‑tracking F1 scores. (a) Pretrained models. (b) Retrained models. Dashed lines indicate the F1 scores of the corresponding results derived using local average threshold (LOC‑20). Solid dots indicate the F1 scores derived using global threshold values .
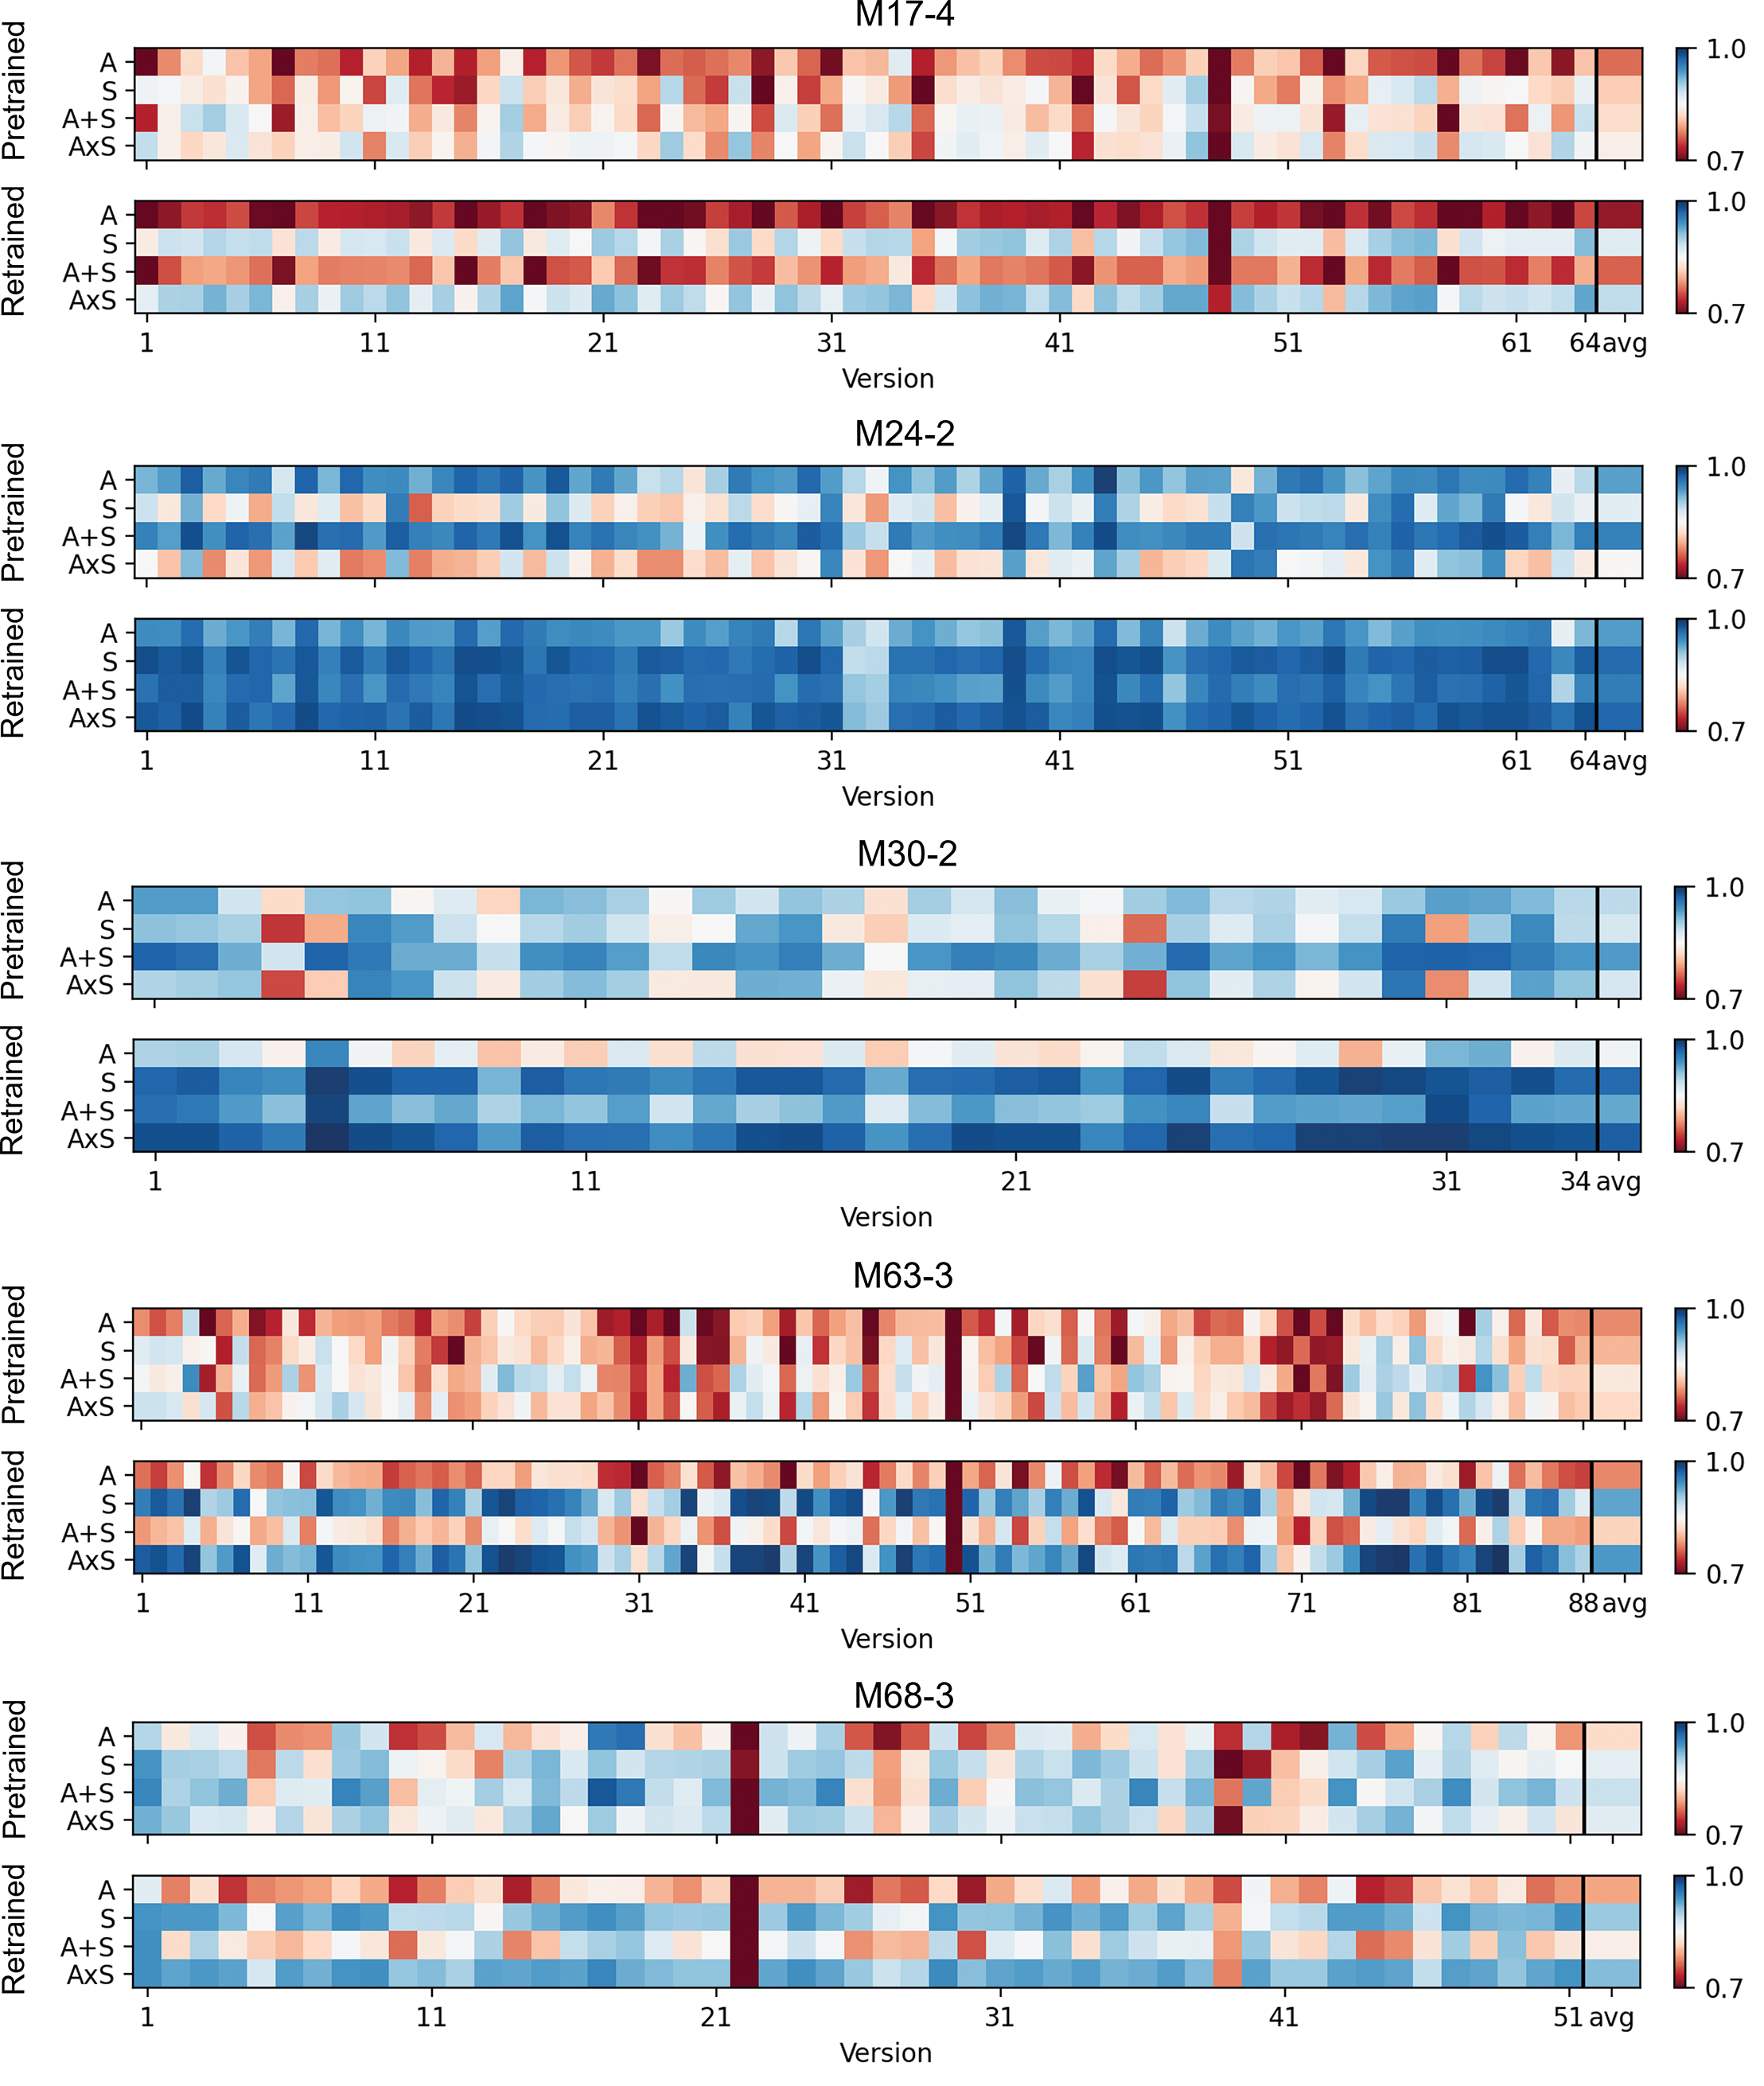
Figure 6
Beat‑tracking F1 scores of Maz‑5.
Table 4
Work‑wise average of downbeat‑tracking results (including late‑fusion approaches). Downbeat‑tracking results (including late‑fusion approaches) were derived using peak‑picking with local average threshold with a window length of 20 seconds (LOC‑20). The best results are highlighted in bold.
| Activation | F‑measure | L‑correct | ||||
|---|---|---|---|---|---|---|
| F1 | P | R | F‑L2 | F‑L3 | F‑L4 | |
| Pretrained | ||||||
| 0.4500.039 | 0.3010.030 | 0.8970.061 | 0.0190.013 | 0.0080.005 | 0.0070.002 | |
| 0.4350.049 | 0.3090.036 | 0.7440.093 | 0.0270.021 | 0.0130.014 | 0.0100.010 | |
| 0.4590.040 | 0.3120.029 | 0.8760.069 | 0.0190.012 | 0.0080.006 | 0.0070.002 | |
| 0.4480.064 | 0.3470.050 | 0.6400.105 | 0.0840.047 | 0.0320.028 | 0.0180.019 | |
| Retrained | ||||||
| 0.4010.026 | 0.2540.020 | 0.9610.029 | 0.0100.004 | 0.0050.001 | 0.0050.001 | |
| 0.6570.071 | 0.5610.072 | 0.8140.080 | 0.4800.100 | 0.4320.102 | 0.3960.101 | |
| 0.4340.026 | 0.2810.021 | 0.9710.025 | 0.0160.007 | 0.0080.004 | 0.0070.003 | |
| 0.6710.073 | 0.5910.072 | 0.7910.082 | 0.5190.103 | 0.4710.109 | 0.4330.111 | |