
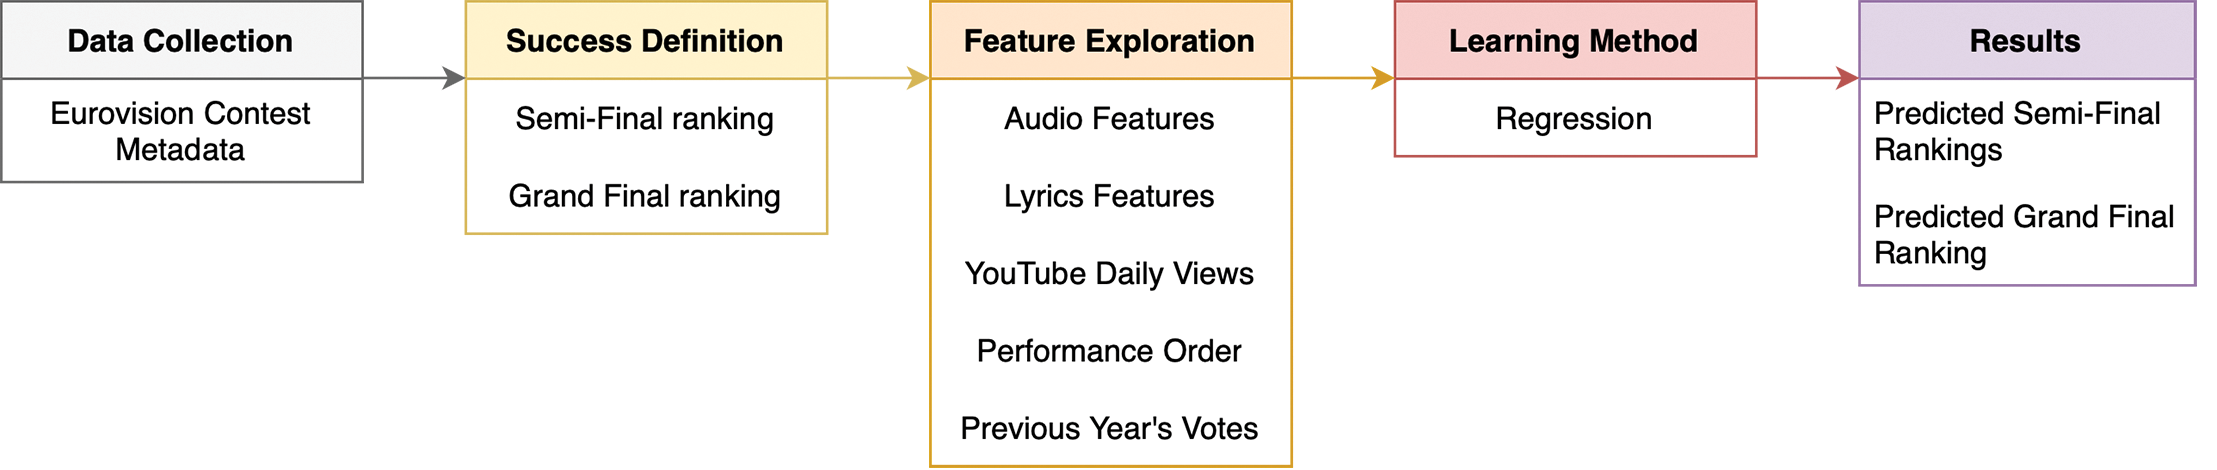
Figure 1
Workflow for the Eurovision results prediction problem.
Table 1
Intrinsic song feature categories: audio features (Essentia) and lyrics features.
| Category | Features |
|---|---|
| Low‑level audio | average loudness, loudness ebu128 int, loudness ebu128 range, dissonance, dynamic complexity, hfc, pitch salience, zero‑crossing rate, Bark bands* (crest, flatness_db, kurtosis, skewness, spread), ERB bands* (crest, flatness_db, kurtosis, skewness, spread), Mel bands* (crest, flatness_db, kurtosis, skewness, spread), spectral features* (spectral centroid, spectral complexity, spectral decrease, spectral energy, spectral energy band high, spectral energy band low, spectral energy band middle high, spectral energy band middle low, spectral entropy, spectral flux, spectral kurtosis, spectral rms, spectral rolloff, spectral skewness, spectral spread, spectral strong peak) |
| Rhythm | bpm, beats count, beats loudness, onset rate, danceability |
| Total | chords changes rate, chords number rate, chords strength, hpcp crest, hpcp entropy, tuning diatonic strength, tuning equal tempered deviation, tuning frequency, tuning nontempered energy ratio, chords key, chords scale, key edma (strength, key, scale), key krumhansl (strength, key, scale), key temperley (strength, key, scale) |
| Lyrics | type‑token ratio, compression size reduction, n‑gram repetitiveness, language (English/non‑English), language mix |
[i] *PCA dimensionality reduction was applied to these subsets of features.
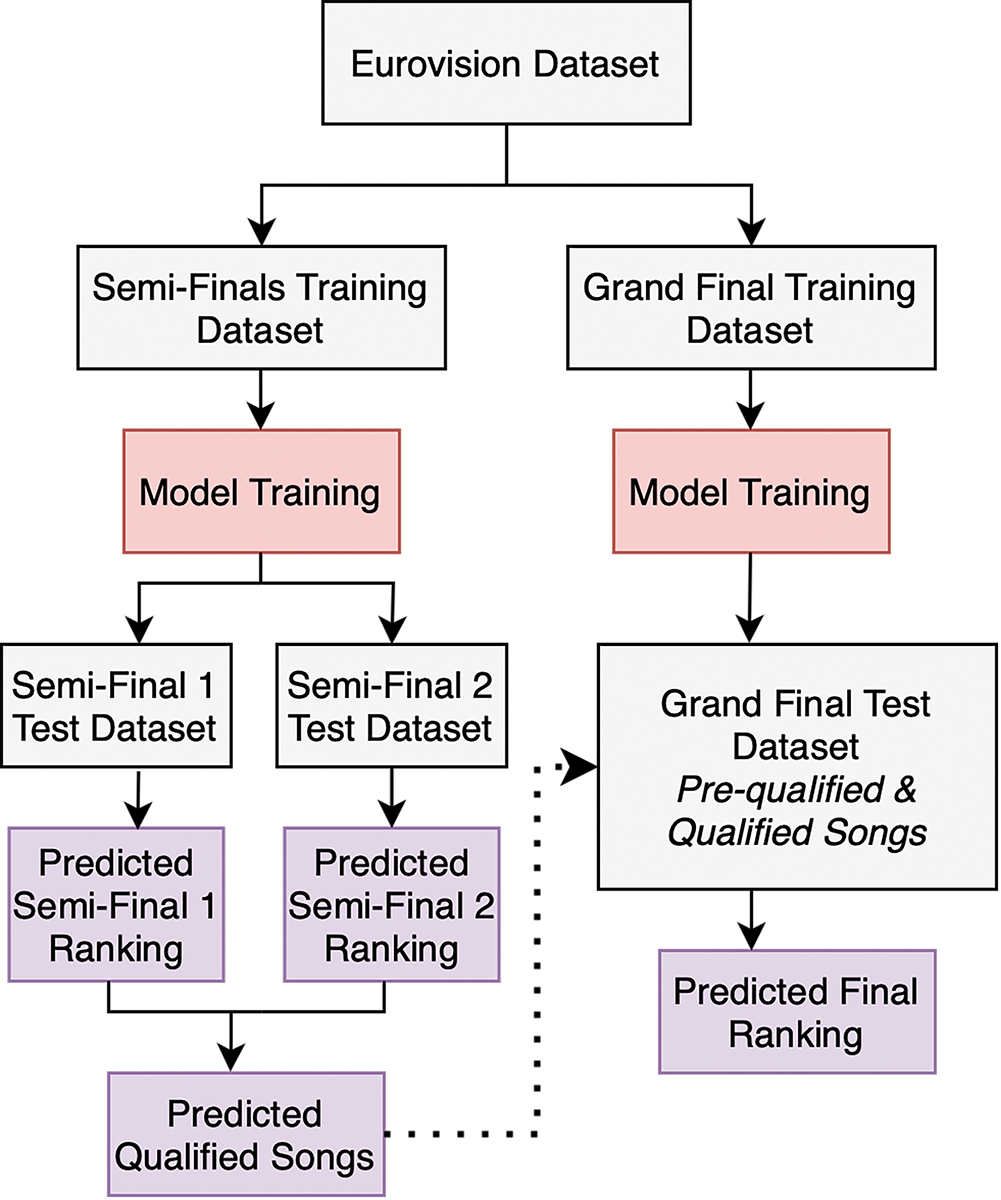
Figure 2
Eurovision prediction framework.
Table 2
Proposed feature set approaches for predicting Eurovision results.
| Approach | Features |
|---|---|
| 1. Intrinsic characteristics of songs | Audio and lyrics |
| 2. Intrinsic characteristics of songs and Eurovision data | Audio and lyrics Running order Country voting results and reciprocation |
| 3. Intrinsic characteristics of songs and public appeal | Audio and lyrics YouTube daily views |
| 4. Intrinsic characteristics of songs, public appeal, and Eurovision data | Audio and lyrics YouTube daily views Running order Country voting results and reciprocation |
| 5. Public appeal | YouTube daily views |
| 6. Eurovision data | Running order Country voting results and reciprocation |
| 7. Public appeal and Eurovision data | YouTube daily views Running order Country voting results and reciprocation |
Table 3
Average rank errors across all years for all semi‑finals and grand finals. Bold values indicate the lowest error across all feature set approaches.
| Avg. rank errors | Approach 1 | Approach 2 | Approach 3 | Approach 4 | Approach 5 | Approach 6 | Approach 7 |
|---|---|---|---|---|---|---|---|
| Semi‑finals | 5.62 | 4.60 | 4.01 | 3.70 | 4.08 | 4.79 | 3.47 |
| Grand final | 7.88 | 7.63 | 6.27 | 6.07 | 6.05 | 7.59 | 6.27 |
Table 4
Semi‑final results: Spearman’s rank correlation coefficients for all feature set approaches across each year’s semi‑final 1 (SF 1) and semi‑final 2 (SF 2). Bold values indicate the highest correlation for a given year, semi‑final, and approach.
| Year | Approach 1 Rank Corr. | Approach 2 Rank Corr. | Approach 3 Rank Corr. | Approach 4 Rank Corr. | Approach 5 Rank Corr. | Approach 6 Rank Corr. | Approach 7 Rank Corr. | |||||||
|---|---|---|---|---|---|---|---|---|---|---|---|---|---|---|
| SF 1 | SF 2 | SF 1 | SF 2 | SF 1 | SF 2 | SF 1 | SF 2 | SF 1 | SF 2 | SF 1 | SF 2 | SF 1 | SF 2 | |
| 2008 | – | – | 0.50 | – | 0.55 | – | 0.77 | – | 0.76 | – | – | – | 0.80 | – |
| 2009 | – | – | 0.79 | 0.59 | 0.66 | 0.63 | 0.63 | 0.68 | – | – | 0.66 | 0.49 | 0.59 | 0.70 |
| 2010 | – | – | – | 0.68 | – | – | – | – | – | – | – | 0.73 | 0.51 | 0.74 |
| 2011 | – | – | – | – | – | – | – | 0.50 | – | 0.55 | – | – | 0.55 | – |
| 2012 | – | – | – | – | 0.54 | 0.65 | 0.76 | 0.65 | – | – | – | – | 0.70 | 0.69 |
| 2013 | – | – | – | – | – | – | – | 0.69 | – | – | – | – | – | 0.70 |
| 2014 | – | – | – | 0.64 | 0.72 | – | 0.76 | 0.82 | 0.95 | 0.76 | – | 0.56 | 0.74 | 0.84 |
| 2015 | – | – | – | – | – | – | – | – | 0.82 | – | – | – | – | – |
| 2016 | – | – | – | – | 0.70 | 0.75 | 0.62 | 0.82 | 0.63 | – | – | 0.48 | 0.62 | 0.74 |
| 2017 | – | – | – | – | 0.75 | – | 0.68 | – | – | – | – | – | 0.78 | 0.50 |
| 2018 | – | – | – | – | 0.59 | – | 0.58 | 0.61 | – | – | – | 0.51 | 0.72 | 0.52 |
| 2019 | – | – | – | – | – | – | – | – | – | 0.65 | – | – | – | – |
| 2021 | – | – | – | – | 0.55 | 0.75 | – | – | 0.92 | – | – | – | – | 0.68 |
| 2022 | 0.53 | – | 0.52 | – | – | 0.48 | 0.54 | – | – | – | – | – | 0.55 | – |
| 2023 | – | – | – | – | 0.59 | 0.54 | 0.71 | 0.78 | 0.85 | – | – | – | 0.65 | – |
| 2024 | – | – | – | – | 0.60 | 0.65 | 0.60 | 0.62 | 0.69 | – | – | – | 0.66 | 0.65 |
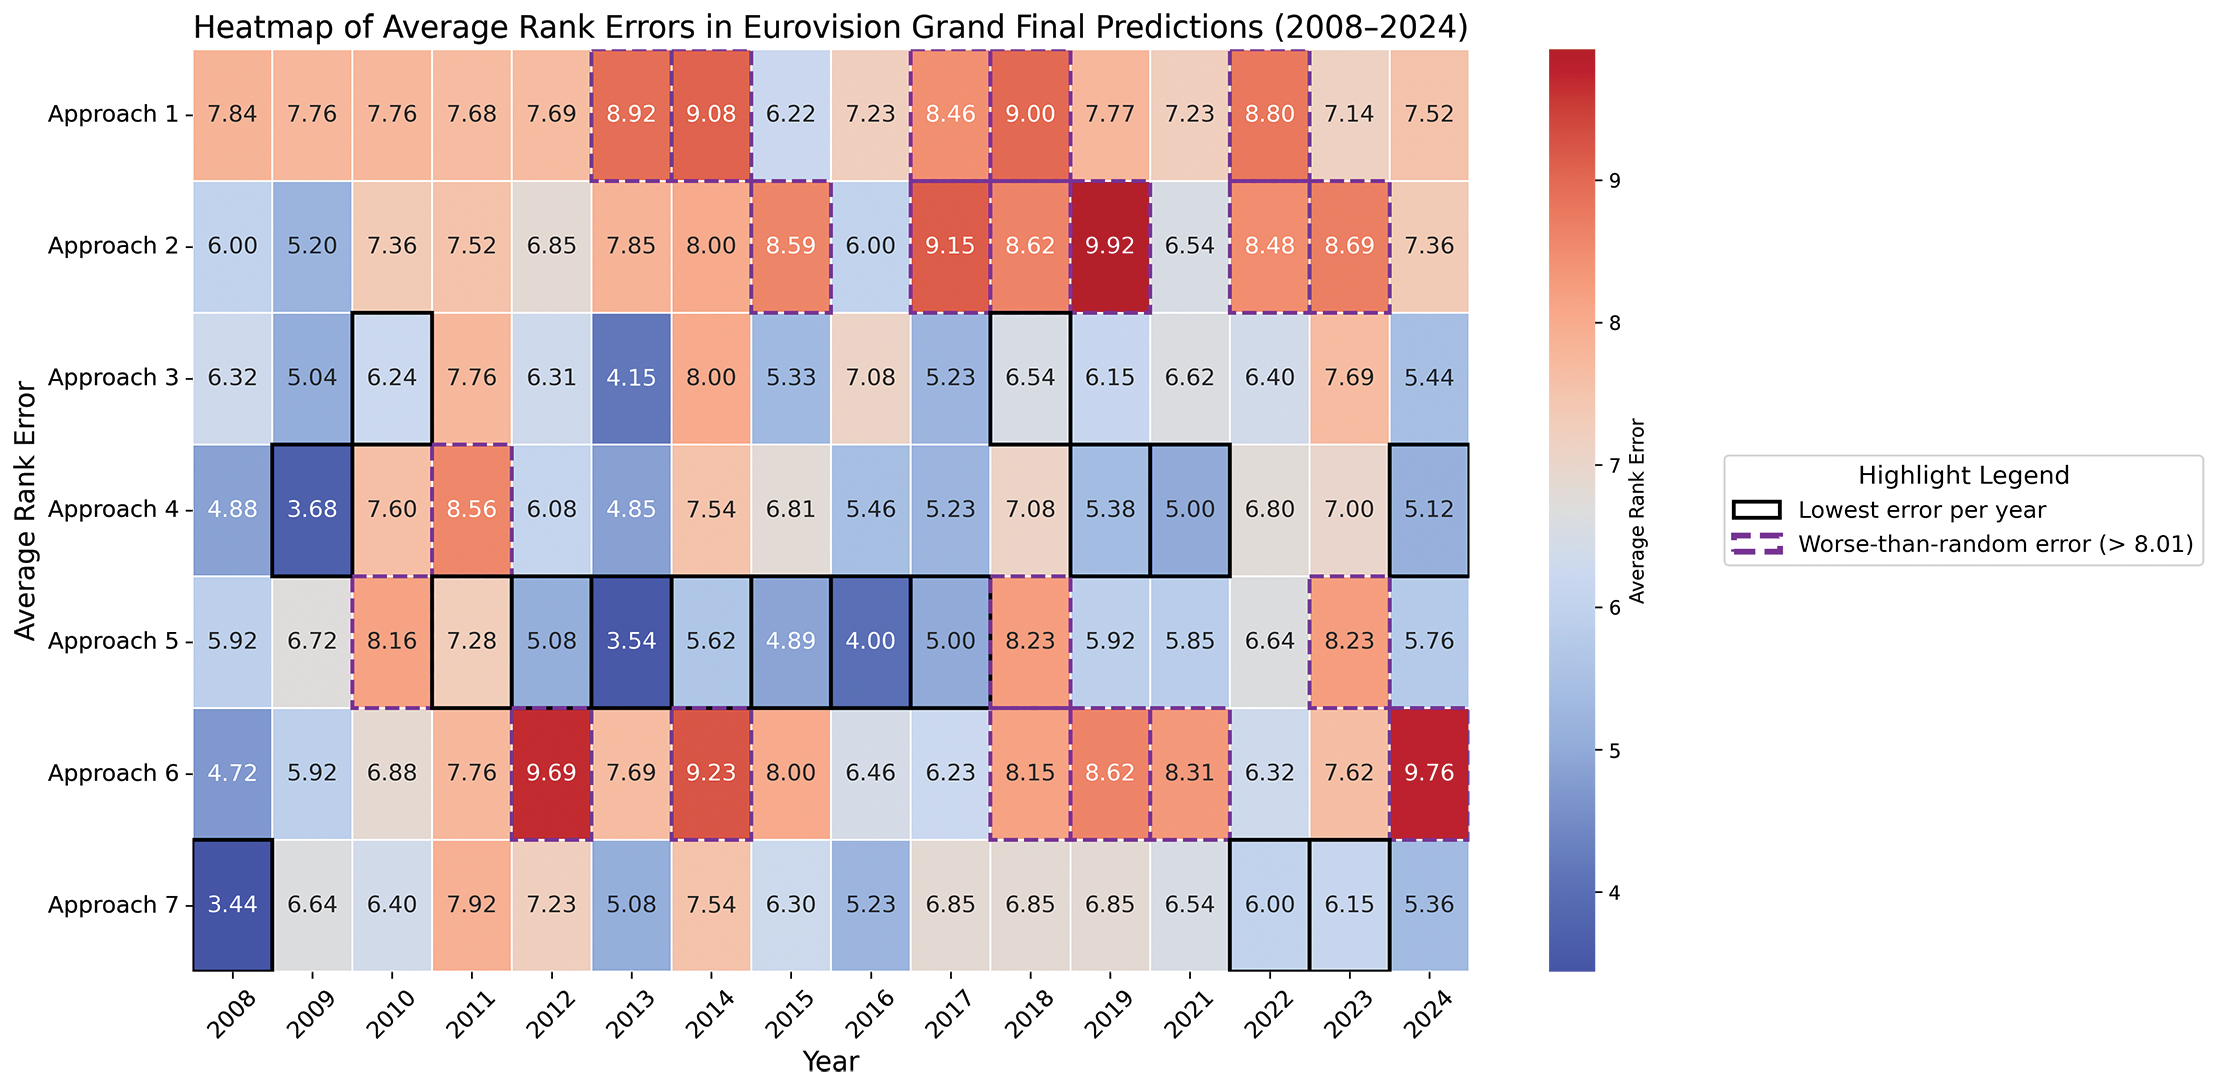
Figure 3
Grand final results: Heatmap illustrating the average rank errors for all feature set approaches. Black borders highlight the best‑performing approach (lowest error) for each year, while purple dashed borders indicate worse‑than‑random performance (errors greater than 8.01).
Table 5
Grand final results: Test values for all feature set approaches across all years.
| Year | Approach 1 R2 | Approach 2 R2 | Approach 3 R2 | Approach 4 R2 | Approach 5 R2 | Approach 6 R2 | Approach 7 R2 |
|---|---|---|---|---|---|---|---|
| 2008 | 0.02 | 0.12 | 0.17 | 0.27 | 0.32 | 0.22 | 0.48 |
| 2009 | 0.04 | 0.26 | 0.28 | 0.36 | 0.17 | 0.09 | 0.09 |
| 2010 | 0.01 | 0.03 | 0.09 | 0.08 | 0.09 | 0.09 | 0.16 |
| 2011 | 0.01 | 0.03 | –0.03 | –0.05 | 0.02 | 0.04 | –0.04 |
| 2012 | 0.04 | 0.07 | 0.16 | 0.18 | 0.25 | –0.11 | 0.14 |
| 2013 | –0.05 | 0.04 | 0.42 | 0.41 | 0.33 | 0.04 | 0.31 |
| 2014 | –0.09 | 0.01 | 0.09 | 0.06 | 0.18 | –0.06 | 0.03 |
| 2015 | 0.08 | 0.04 | 0.27 | 0.13 | 0.24 | 0.06 | 0.15 |
| 2016 | 0.03 | 0.14 | 0.14 | 0.30 | 0.37 | 0.11 | 0.37 |
| 2017 | –0.02 | –0.17 | 0.22 | 0.25 | 0.25 | 0.13 | 0.13 |
| 2018 | –0.05 | –0.02 | 0.10 | 0.09 | 0.14 | –0.02 | 0.03 |
| 2019 | 0.02 | –0.08 | 0.20 | 0.25 | 0.31 | –0.04 | 0.19 |
| 2021 | 0.06 | 0.09 | 0.12 | 0.28 | 0.20 | –0.09 | 0.19 |
| 2022 | –0.01 | –0.15 | 0.19 | 0.06 | 0.16 | 0.09 | 0.11 |
| 2023 | 0.03 | –0.03 | –0.01 | 0.06 | 0.07 | –0.01 | 0.12 |
| 2024 | 0.01 | 0.04 | 0.38 | 0.29 | 0.42 | –0.37 | 0.25 |
Table 6
Grand final results: Spearman’s rank correlation coefficients for all feature set approaches across all years. Bold values indicate the highest coefficient for a given year and approach.
| Year | Approach 1 Rank Corr. | Approach 2 Rank Corr. | Approach 3 Rank Corr. | Approach 4 Rank Corr. | Approach 5 Rank Corr. | Approach 6 Rank Corr. | Approach 7 Rank Corr. |
|---|---|---|---|---|---|---|---|
| 2008 | – | 0.42 | 0.41 | 0.53 | 0.51 | 0.61 | 0.75 |
| 2009 | – | 0.59 | 0.62 | 0.77 | – | – | – |
| 2010 | – | – | – | – | – | – | – |
| 2011 | – | – | – | – | – | – | – |
| 2012 | – | – | 0.43 | 0.47 | 0.57 | – | – |
| 2013 | – | – | 0.76 | 0.65 | 0.71 | – | 0.62 |
| 2014 | – | – | – | – | 0.47 | – | – |
| 2015 | 0.44 | – | 0.61 | 0.41 | 0.52 | – | 0.44 |
| 2016 | – | 0.50 | – | 0.54 | 0.74 | – | 0.64 |
| 2017 | – | – | 0.51 | 0.58 | 0.56 | 0.43 | – |
| 2018 | – | – | – | – | – | – | – |
| 2019 | – | – | 0.45 | 0.59 | 0.54 | – | – |
| 2021 | – | – | 0.42 | 0.62 | 0.48 | – | 0.44 |
| 2022 | – | – | 0.41 | – | – | – | – |
| 2023 | – | – | – | – | – | – | 0.43 |
| 2024 | – | – | 0.54 | 0.61 | 0.44 | – | 0.49 |