
1 Introduction
Every year in May, millions of viewers around the world tune in to the Eurovision Song Contest, which features an eclectic mix of music, captivating performances, and a celebration of national pride. Launched in 1956 by the European Broadcasting Union (EBU), Eurovision has brought together countries from all over Europe (and beyond) to not only showcase their musical talents but also build a spirit of unity among participating nations (Stockemer et al., 2017). This mission is encapsulated by the competition slogan ‘United by Music’.1
Streaming services allow fans to discover songs before the contest, leading to media discussions about potential winners. In recent years, the rise of social media has transformed music reception, allowing diverse audiences to engage with artists, making Eurovision more inclusive and immersive. As a result, the contest has gained more worldwide attention, allowing viewers from non‑participating countries to vote for their favourite songs for the first time in 2023.2 Since both public and jury votes determine the contest winner, this dynamic collective experience could introduce bias, as increasing social influences may heighten inequality and unpredictability in success, shifting the determination away from song quality (Salganik et al., 2006).
The fundamental concept of ‘Hit Song Science’ (HSS) assumes that successful songs share a set of musical, contextual, and cultural factors that make them appealing to a general audience (Pachet and Roy, 2008; Seufitelli et al., 2023). Based on this premise, this paper proposes a framework for predicting (1) the rankings in the Eurovision semi‑finals, which determine which songs qualify for the grand final, and (2) the final rankings in the grand final itself. Even though the accuracy of such predictions is inevitably constrained by the inherent unpredictability of the competition, the framework offers a structured and data‑driven methodology to statistically explore the Eurovision Song Contest.
One of the key challenges in HSS is developing generalised and comparable models for estimating song popularity (Martın‑Gutiérrez et al., 2020). A review of the existing literature reveals that no universal solution exists, as model performance varies based on subjective decisions made by researchers throughout the analysis process, including defining success metrics, selecting features, choosing learning methods, and utilising diverse song datasets (Seufitelli et al., 2023). The Eurovision Song Contest offers a unique opportunity for such analysis, as it provides a predefined list of participating songs and a clear measure of success through contest rankings. Moreover, while extensive research has been conducted on popular music and chart success, Eurovision remains relatively underexplored in the HSS literature, making this study a valuable contribution to the field.
The multi‑modal approach proposed in this experiment tries to account for some of the arbitrary aspects of Eurovision results by incorporating previous country voting patterns, the running order of performances, as well as audio features, lyrics features, and daily YouTube views to reflect both the intrinsic quality of the songs and their public appeal.
Incorporating YouTube views as a feature may appear methodologically problematic, as observed popularity is naturally correlated with contest results. However, this experiment also aims to determine whether combining YouTube views with song features and contest data provides more accurate predictions than relying solely on YouTube views as a proxy for popularity and contest success. In addition, studies in HSS often leverage supplementary indicators of popularity to enhance their main predictive tasks, such as including artist‑related metrics like prior chart success (Bischoff et al., 2009) or social media following (Martın‑Gutiérrez et al., 2020).
This study explores seven combinations of feature sets to identify the most effective indicators of competition success. Machine learning regression models are employed to predict rankings for both the semi‑finals and grand final. Given that the dataset spans the most recent 16 years of Eurovision data, a hold‑one‑out approach is adopted to conduct multiple experiments. In each experiment, a different year is designated as the test set, while the remaining years serve as training data. This method aims to produce more statistically robust results. The model predictions are then compared to the actual competition outcomes for evaluation.
2 Background
2.1 Rules of the eurovision song contest
Participating countries in the Eurovision Song Contest select an artist or group to represent them, who will then perform an original song that may be of any style or genre, provided it includes a vocal component (Stockemer et al., 2017). While there are no restrictions on the language of the lyrics, participants frequently opt to sing in either English or their native tongue (Haan et al., 2005).
Eurovision is divided into two stages, with two semi‑finals and a grand final. After each semi‑final performance, viewers vote for their favourite performances; however, they are not permitted to vote for the song representing their home country. Each semi‑final’s top 10 songs advance to the grand final. Furthermore, a few countries automatically qualify for the grand final without having to take part in the semi‑finals. These include the ‘Big Five’ (France, Germany, Italy, Spain, and the United Kingdom) and the host nation, which is typically the previous year’s winner (Haan et al., 2005). Since 2023, the semi‑final voting has been entirely public.
In the grand final, the voting mechanism includes an international public vote and national juries, each awarding points to 10 countries; these scores are tabulated separately and then added together. The winner is the song with the most overall points. The national juries award points as follows: a song deemed to be a country’s ‘favourite’ receives 12 points, the second‑favourite receives 10 points, and the remaining songs are awarded 8 to 1 point. Songs that are not in the top 10 receive 0 points from that country (Haan et al., 2005).
2.2 Related work
A recent paper introduced a comprehensive dataset combining contest metadata, historical voting data, betting odds, and audio features extracted from recorded performances. To create a stable measure of competitiveness, the authors converted raw contest scores into an interval‑scale metric called ‘cantobels’, allowing for comparisons across years. The study applied music‑understanding models to extract audio embeddings from each song’s recorded performance and employed learning models to simulate and predict contest outcomes. The results demonstrated that these audio embeddings accounted for 7.2% of the variance in the Eurovision competitiveness measure. The authors emphasised that while this percentage is relatively small, it remains meaningful, highlighting the potential of the Eurovision Song Contest as a testing ground for Music Information Retrieval (MIR) algorithms (Burgoyne et al., 2023).
Monitoring competition ‘buzz’ through press attention, fan feedback, and social platforms can gauge a song’s popularity. An analysis of 900,000 English and Spanish tweets from the 2019 Eurovision final identified overall Twitter sentiment and linked tweets to key event moments (Demergis, 2019). Excluding national pride tweets, positive tweets for each country were counted to produce a predicted ranking. Using an emoticon‑derived sentiment lexicon and a Naive Bayes model, it was found that top televised performances received more positive tweets. The study compared the predicted and actual rankings using Spearman’s and Kendall’s rank correlation coefficients, achieving 0.559 and 0.403, respectively. Another study with 1 million tweets achieved coefficients of 0.62 and 0.72 using sentiment lexicon‑based and deep learning approaches (Kumpulainen et al., 2020).
2.3 Voting patterns
Research in 1996 has already shown that biased evaluations in Eurovision voting undermine equal chances for all participating nations, with systemic preferences forming among European blocs (Yair and Maman, 1996). Although new rules, such as limiting the presence of neighbouring countries in the same semi‑final, aimed to reduce such biases (Svete et al., 2020), studies indicate that they continue to persist. Historical voting patterns reveal the existence of alliances and preferences shaped by cultural, linguistic, and political connections among nations.
Analysis of Eurovision data from 1998 to 2008 identified key factors driving favouritism, including religion, language, geographical proximity, shared borders, semi‑final participation, GDP disparities, and immigration (Luković et al., 2019). ‘Patriotic voting’, where migrants vote for their home country, highlights cultural attachments. In addition, affluent nations often vote for economically poorer and culturally distinct countries, while poorer regions favour nations with similar demographics and cultures. In addition to geographical, cultural, and socio‑economic factors (Blangiardo and Baio, 2014; Dekker, 2007; Ochoa et al., 2008), one‑way relationships (Svete et al., 2020) and exchange partnerships (Mantzaris et al., 2018) have also been identified.
A 2007 study concluded that collusive voting stems from quasi‑political motivations rather than shared musical tastes (Gatherer, 2007). While some nations promote regional musical styles, songs from wholly unrelated genres are also regularly introduced. The study also highlighted the impact of familiarity, as exposure resulting from semi‑final success often boosts voting outcomes in the final.
2.4 Order effects
The order of appearance of participants in the competition is random; yet it has been found that it can influence the final results. Contestants who perform towards the end of the event tend to achieve higher ranks (Antipov and Pokryshevskaya, 2017; Arroyo‑Barrigüete et al., 2022; Ginsburgh and Moreno‑Ternero, 2023; Haan et al., 2005). Moreover, a relatively strong performance is likely to score more points if it is surrounded by poorer performances (Ginsburgh and Moreno‑Ternero, 2023).
A 2022 study examining voting outcomes from 2014 to 2019 concludes that the order of performance can have a substantial impact on decision‑making, particularly in public voting (Arroyo‑Barrigüete et al., 2022). To mitigate this order bias, the paper calls for expert judges who can evaluate performances more objectively. This is in agreement with a 2005 investigation of the difference between expert and audience voting. It contends that juries are less influenced by external factors, such as the performance order, when evaluating performances (Haan et al., 2005).
2.5 Voting motivation
A 2016 Eurovision survey investigated voting behaviours and influences (Stockemer et al., 2017). An online questionnaire with over 500 responses revealed that 26% voted based on personal preference, while another 26% voted for the song they thought would win. Strategic voting was employed by 11% to select the likely winner among favourites. In addition, language affinity, ethnic similarities, positive sentiments, bloc voting, political concerns, and cultural expectations accounted for 37% of the votes. The survey indicates that people may vote for likely winners over personal favourites, reflecting popular sentiment and contestant recognition. This highlights that a song’s appeal extends beyond its musical merits, which is crucial for predicting contest results.
2.6 Multi‑Modal approaches to HSS
The scope of modalities considered for predicting hit songs has expanded significantly over time. Early efforts focused on feature sets and high‑level audio features (Pachet and Roy, 2008), while more recent approaches have incorporated lyrics analysis (Raza and Nanath, 2020) and the integration of diverse extrinsic factors—elements that may directly or indirectly influence musical success (Seufitelli et al., 2023). The literature highlights the advantages of supplementing high‑level audio features with attributes such as artist collaboration networks (Silva et al., 2022) and listener behaviour data (Herremans and Bergmans, 2017).
Including the release year as a feature has also proven to enhance song popularity prediction by capturing temporal musical trends (Zangerle et al., 2019). In an experiment classifying songs as hits or non‑hits using both low‑level and high‑level audio features from the Essentia toolkit (Bogdanov et al., 2013), the release year improved model performance by providing essential temporal context.
A notable study employing an end‑to‑end multi‑modal deep learning architecture demonstrated that combining audio, lyrics, and metadata significantly enhanced the model’s predictive accuracy (Martin‑Gutiérrez et al., 2020). The audio features included high‑level attributes extracted from Spotify and low‑level features derived from audio representations such as Mel‑spectrograms, Chroma features, and spectral centroids. Lyrics were analysed for factors such as vocabulary richness and sentence‑similarity coefficients, while the metadata incorporated metrics such as artist popularity, follower count, and the number of markets where the artist’s music was available.
2.7 Considerations
Predicting Eurovision results requires a multi‑modal approach. From an HSS perspective, incorporating contextual attributes beyond audio and lyrics modalities is essential for improving model performance. In Eurovision, certain variables are known to influence a song’s success, including performance order, voting patterns between countries, and the familiarity gained from semi‑final appearances or pre‑contest exposure. Accounting for these factors is crucial for effectively contextualising songs within the competition’s framework.
This task also presents inherent challenges, including the evolving preferences of judges and audiences and the competition’s changing format. Political events throughout the year can influence voting behaviour, leading countries to support or oppose one another. In addition, the competition showcases a wide variety of genres and styles—from pop and rock to traditional regional sounds—which differ significantly among participating countries and vary from year to year.
3 Methodology
The methodology follows a standard approach used in hit song prediction problems, as shown in Figure 1 (Seufitelli et al., 2023). The MIRoVision dataset (Spijkervet, 2020) served as the primary data source, which includes data from the official Eurovision website3 and the Eurovision World fan website.4 The success measure was defined as the ranking positions of songs in both semi‑finals and grand final for each year. Feature exploration involved extracting audio features from participating songs, computing lyrics features, and calculating YouTube daily views as a measure of popularity. Additional features included the order of performances, country labels, and historical voting patterns from previous years to capture potential biases or trends. Regression models were employed to predict the rankings of songs in the semi‑finals and grand final.
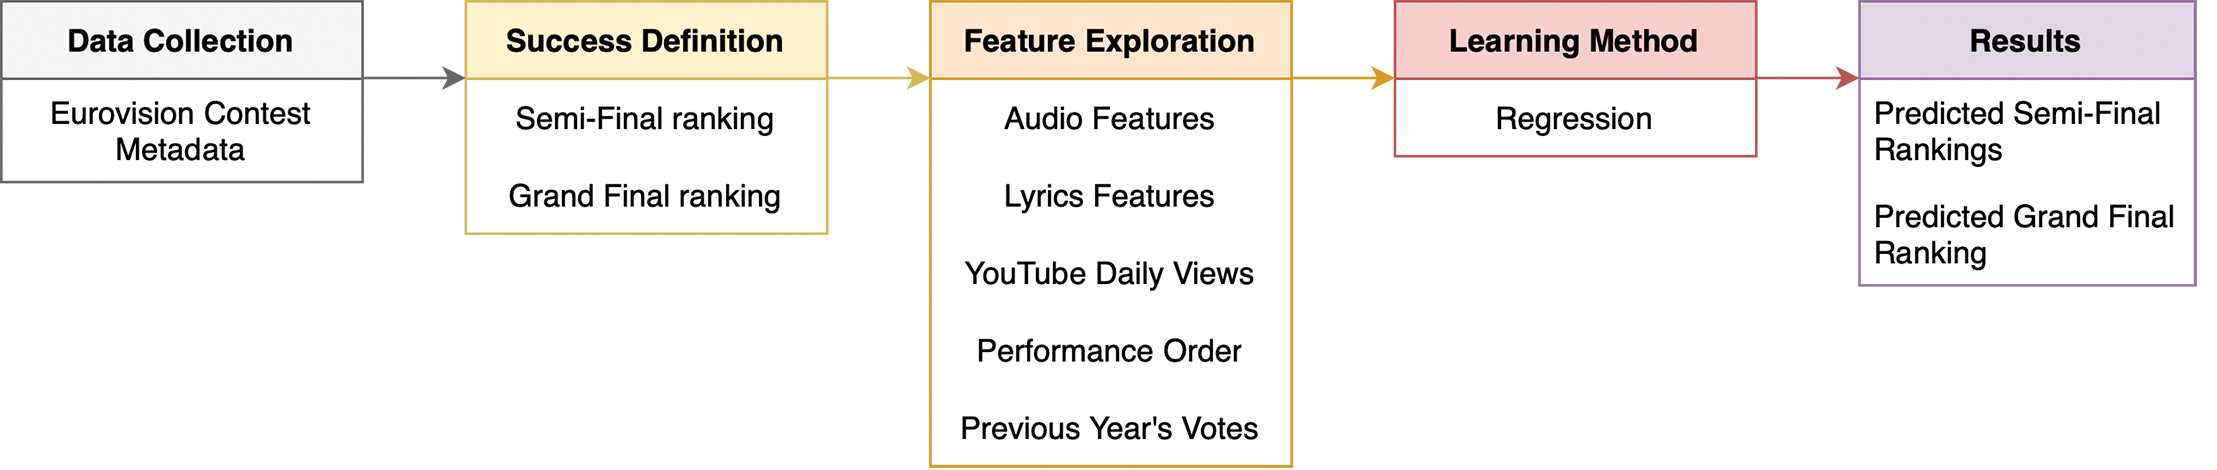
Figure 1
Workflow for the Eurovision results prediction problem.
3.1 Dataset collection
This study encompasses contest data from 2008 to 2024, a period without major competition format changes. The dataset comprises 646 Eurovision songs, with data for the year 2020 excluded due to the cancellation of the contest in response to the global COVID‑19 pandemic.
The following metadata was collected: song artist and title, represented country, year, final contest placement, semi‑final placement, running order in both the semi‑finals and final, the specific semi‑final in which the song was performed, and the song lyrics. In addition, three YouTube links were collected for each song: (1) the studio recording, (2) the live performance, and (3) the official music video uploaded by the Eurovision Song Contest’s YouTube channel5 prior to the competition. Songs were labelled based on whether they qualified for the final, did not qualify, or were pre‑qualified as part of the Big Five.
3.2 Features
3.2.1 Running order and voting patterns
The running order of performances was included in the analysis to account for the order effects bias, as discussed in the literature (Arroyo‑Barrigüete et al., 2022).
To address strategic voting between countries or patterns related to geographical, cultural, linguistic, or socio‑economic factors, the study incorporated country labels and historical voting data obtained from the MIRoVision dataset. Each song entry was assigned its country’s previous year’s voting result, expressed as:
The ratio of countries that voted for the given country to the total number of participating countries.
The ratio of vote reciprocation between a country and its supporters.
These voting features were calculated separately for the semi‑finals and grand final, reflecting the number of countries allowed to vote in each event. Songs that did not participate in the previous year’s semi‑finals were assigned a value of 0 for the semi‑final vote ratio and semi‑final vote reciprocation features. Similarly, songs that failed to qualify for the final in the previous year were assigned a value of 0 for the final vote ratio and final vote reciprocation features. Voting reciprocation between countries helps establish alliances, and these features help capture the historical presence or absence of such support.
3.2.2 YouTube daily views
The YouTube daily views metric, a measure of public appeal, accounts for several extrinsic factors, including audience engagement with the song due to genuine enjoyment, attention directed at a participating country for political or other reasons, showmanship, charisma, or any controversy surrounding the act.
This feature is calculated using videos published on the official Eurovision Song Contest YouTube channel. Official music videos have been uploaded prior to the contest since 2009, but for 2008, the dataset predominantly includes rehearsal performances uploaded before the live events or videos released on the artists’ channels prior to the competition. The YouTube daily views metric is determined by dividing the total number of views by the number of days between its publication date and the data collection point in January 2025.
Calculating daily views instead of total views standardises performance across different upload times, allowing for a more accurate comparison of long‑term success. For instance, if two songs have the same total views but different publication times, the newer song is likely to perform better on a per‑day basis.
However, obtaining historical YouTube view data for all songs prior to the contest is challenging, meaning this feature reflects both pre‑contest and post‑contest exposure. This introduces a bias, as post‑contest views tend to surge, particularly for winning songs. Therefore, caution is needed when interpreting predictions based on YouTube daily views, as they may be influenced by post‑contest popularity rather than genuine pre‑contest interest.
3.2.3 Lyrics features
Although many Eurovision songs are performed in English, some countries prefer songs in their official languages or a mix of English and the home language. This linguistic diversity limits comprehensive lyrics‑based feature analysis.
However, measuring variety is still possible by expressing words as tokens. For each song, the total word count, unique word count, and type‑token ratio (an indicator of vocabulary richness) were computed. The type‑token ratio is a ratio of unique tokens over the total number of tokens present in the text. Vocabulary richness is also a feature used in the multi‑modal hit song prediction study (Martın‑Gutiérrez et al., 2020).
Lyrics repetitiveness, an indicator of a song’s catchiness, can be assessed without translation and is supported by existing research. A study has found that more repetitive songs are more likely to top the charts (Nunes et al., 2015). Increased lyrical repetition may also shorten the time it takes for a song to reach the top position. Over time, pop music lyrics have become simpler, with reduced vocabulary richness and increased repetition, reflecting a decrease in complexity (Parada‑Cabaleiro et al., 2024).
The first repetitiveness metric, the compression reduction rate, uses the Lempel–Ziv–Welch (LZW) algorithm (Ziv and Lempel, 1978) to measure lyrical repetition by replacing repetitive sequences with unique codes and calculating the size difference between the original and compressed text. A higher rate indicates more repetition. The second metric, the n‑gram repetitiveness score, evaluates repetition across sequences of 2–10 words by counting repeated n‑grams in the lyrics and averaging the proportions of repetitions for each n‑gram size.
In addition, labels were assigned to indicate whether the song lyrics were in English, a non‑English language, or a combination of English and another language.
3.2.4 Audio features
In this study, Essentia’s Music Extractor toolkit (Bogdanov et al., 2013) was used to extract a comprehensive set of audio features for all Eurovision songs in the dataset.6 Essentia is an open‑source library for audio and music analysis, often used in academic research, including studies in HSS (Zangerle et al., 2019). The extractor provided detailed low‑level, rhythm, and tonal features, totalling 65 attributes, in addition to song duration in seconds.
Low‑level features provide a minimal level of abstraction, capturing the raw characteristics of an audio signal, including spectral attributes, loudness, energy‑related features, and frequency band analyses in Bark, Mel, and equivalent rectangular bandwidth (ERB) scales. The Bark and ERB scales approximate the bandwidths of auditory filters in human hearing, while the Mel scale is specifically designed for speech and music processing, mapping frequency bands to a scale that aligns with human pitch perception. Rhythm features describe the tempo and beat patterns, including beats per minute (BPM), beats count, onset rate, and danceability. Tonal features focus on the harmonic and melodic aspects, such as key, mode, chord change rate, and Harmonic Pitch Class Profile (HPCP) attributes. The extracted features are listed in Table 1.
Table 1
Intrinsic song feature categories: audio features (Essentia) and lyrics features.
| Category | Features |
|---|---|
| Low‑level audio | average loudness, loudness ebu128 int, loudness ebu128 range, dissonance, dynamic complexity, hfc, pitch salience, zero‑crossing rate, Bark bands* (crest, flatness_db, kurtosis, skewness, spread), ERB bands* (crest, flatness_db, kurtosis, skewness, spread), Mel bands* (crest, flatness_db, kurtosis, skewness, spread), spectral features* (spectral centroid, spectral complexity, spectral decrease, spectral energy, spectral energy band high, spectral energy band low, spectral energy band middle high, spectral energy band middle low, spectral entropy, spectral flux, spectral kurtosis, spectral rms, spectral rolloff, spectral skewness, spectral spread, spectral strong peak) |
| Rhythm | bpm, beats count, beats loudness, onset rate, danceability |
| Total | chords changes rate, chords number rate, chords strength, hpcp crest, hpcp entropy, tuning diatonic strength, tuning equal tempered deviation, tuning frequency, tuning nontempered energy ratio, chords key, chords scale, key edma (strength, key, scale), key krumhansl (strength, key, scale), key temperley (strength, key, scale) |
| Lyrics | type‑token ratio, compression size reduction, n‑gram repetitiveness, language (English/non‑English), language mix |
[i] *PCA dimensionality reduction was applied to these subsets of features.
For Essentia audio features, computations were performed over the full length of each song using input audio files in MP3 format sampled at 44,100 Hz. For applicable features, statistical aggregation was applied using the mean value.
Dimensionality reduction was performed using principal component analysis (PCA) to simplify predefined subsets of features while retaining at least 95% of the variance. Each subset was normalised before applying PCA, which identified the optimal number of components: four for Bark bands and ERB bands, three for Mel bands, and seven for spectral features. Originally, Bark, ERB, and Mel bands had five features each, while spectral features had 16. These were transformed into principal components and replaced in the dataset.
To ensure consistent audio feature extraction, only studio‑recorded versions of the songs were used, thereby minimising unwanted sounds from the audience and other elements in live performances.
3.3 Prediction framework
Developing a framework for predicting Eurovision results involved accounting for the contest format, as not all participating songs compete in the same event. Therefore, the dataset was adjusted into two versions: the semi‑finals dataset and the grand final dataset, which included only songs that qualified from the semi‑finals and those that pre‑qualified. This is shown in Figure 2. The semi‑finals dataset included 554 songs, while the grand final dataset included 411 songs, covering contests between 2008 and 2024.
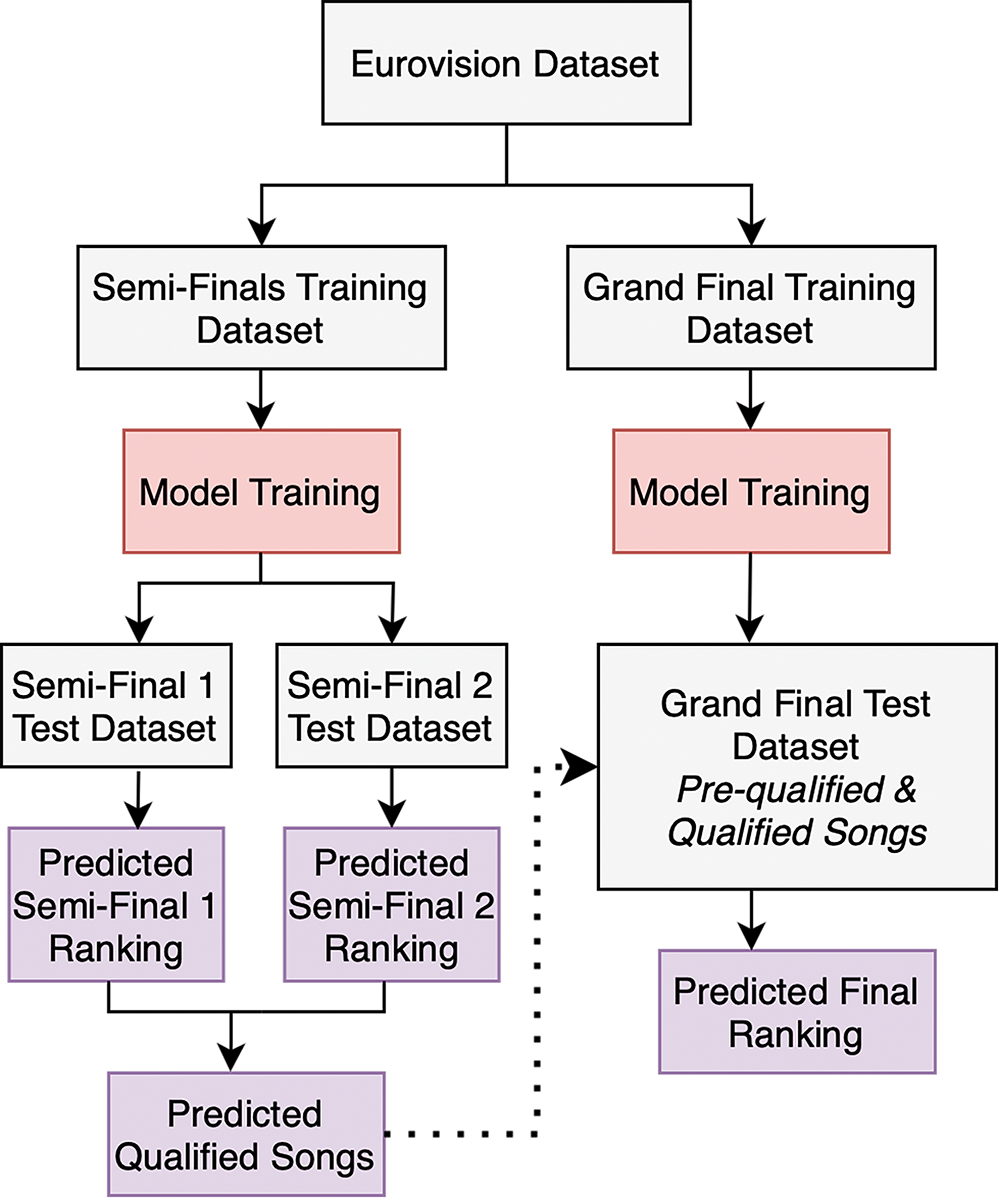
Figure 2
Eurovision prediction framework.
For each dataset, a hold‑one‑out approach was employed to conduct multiple experiments. In each experiment, a different year from 2008 to 2024 was designated as the test year, with all other available years used as training data. This strategy aims to produce more statistically meaningful results and insights that can be generalised across contests, rather than focusing solely on the rankings of a single recent contest. When interpreting the results of a model tested on only one year, it is unclear whether the performance reflects the model’s overall ability to estimate contest results or if it is influenced by that year being an outlier. While it may appear that some future events are used to predict the past, this approach assumes that patterns learnt across multiple years—such as voting behaviours, public appeal trends, and musical characteristics—remain relevant.
For the grand final dataset, the model was tested on the final ranking of the selected contest year. For the semi‑final dataset, two test sets were used per year, corresponding to the rankings of both semi‑finals.
The study experimented with all possible combinations of feature sets, proposing seven approaches, outlined in Table 2.
Table 2
Proposed feature set approaches for predicting Eurovision results.
| Approach | Features |
|---|---|
| 1. Intrinsic characteristics of songs | Audio and lyrics |
| 2. Intrinsic characteristics of songs and Eurovision data | Audio and lyrics Running order Country voting results and reciprocation |
| 3. Intrinsic characteristics of songs and public appeal | Audio and lyrics YouTube daily views |
| 4. Intrinsic characteristics of songs, public appeal, and Eurovision data | Audio and lyrics YouTube daily views Running order Country voting results and reciprocation |
| 5. Public appeal | YouTube daily views |
| 6. Eurovision data | Running order Country voting results and reciprocation |
| 7. Public appeal and Eurovision data | YouTube daily views Running order Country voting results and reciprocation |
By comparing the differences in predictions between these feature sets, the study evaluates the relevance of each feature group as predictors and accounts for any differences that may arise, particularly when contrasting models that include YouTube daily views with those that do not.
4 Results
4.1 Exploratory analysis
Correlation analysis using Spearman’s correlation, with scaled ranking positions from the semi‑finals and grand finals as target variables, revealed that the attribute most strongly correlated with Eurovision rankings is YouTube daily views, with correlation coefficients of (–0.34) for the semi‑finals and (–0.29) for the final rankings. Semi‑final rankings also correlate with the previous year’s final vote reciprocation (–0.29), final vote ratio (–0.28), and running order of performances (–0.21). Grand final rankings have a lower correlation with the running order (–0.16) and the previous year’s final vote reciprocation (–0.16). The negative correlations indicate that higher YouTube daily views, better previous results, and later performance slots are associated with higher rankings in the contest.
Correlation coefficients between audio features and Eurovision rankings are very low, with dynamic complexity showing (–0.11) for semi‑finals and (–0.16) for grand final rankings, the 1st principal component of ERB bands features at (–0.13) for semi‑finals and (–0.14) for grand final rankings, and average loudness at (0.11) for semi‑finals and (0.13) for grand final rankings. Dynamic complexity, which measures fluctuations in loudness, and certain spectral characteristics may slightly influence rankings, whereas the weak positive correlation with average loudness suggests that louder performances might have a small tendency to rank higher.
Interestingly, audio features exhibit more significant correlations with YouTube daily views than with Eurovision rankings. For the songs in the semi‑finals, YouTube daily views correlate with the 1st principal component of Mel bands features (0.43), the 1st principal component of Bark bands features (0.41), and the 2nd principal component of spectral features (–0.32). For the songs in the grand finals, the correlation coefficients are (0.42), (0.40), and (–0.30), respectively. These correlations suggest that some spectral characteristics, particularly those related to perceived pitch and timbre, may be related to increased public appeal. Since both Mel and Bark scales are designed to approximate human auditory perception, this could indicate that songs with particular harmonic content or specific frequency distributions are more likely to resonate with audiences. This suggests a relationship between song qualities and public appeal that is not related to contest success.
In addition, computing the vote reciprocation rate for participating countries revealed relevant voting relationships, such as the Nordic voting bloc (Sweden, Norway, Finland, Denmark, and Iceland) and the bloc encompassing Ukraine, Azerbaijan, and Russia. Other notable pairs with frequent vote exchanges include Armenia–France, Greece–Azerbaijan, Moldova–Ukraine–Romania, Israel– France, and Armenia–Russia. These voting relationships reflect geographical, linguistic, and cultural proximities, as discussed in the literature.
4.2 Experimental setup
XGBoost was selected as the regression model for its robustness, efficiency, and strong performance in handling structured datasets (Chen and Guestrin, 2016). To further optimise the model, AutoML for XGBoost from the Fast and Lightweight AutoML (FLAML) library7 was implemented in Python. FLAML was chosen for its lightweight and efficient approach to automated machine learning, which minimises the computational cost of hyperparameter tuning while maintaining high model performance.
For each experiment and test year, PCA was applied separately to the train and test sets for all feature sets containing audio features, ensuring no data leakage. Afterward, each feature set was normalised, and the XGBoost model was tuned using the R2 metric as the primary evaluation metric with a time budget of 120 seconds. The tuned models were saved, and predictions were subsequently made on the respective test sets.
The target variables, which represent the ranking positions achieved by songs in the semi‑finals and grand final, have been standardised between 0 and 1 in the training data, with 0 corresponding to the highest‑ranked song and 1 corresponding to the lowest‑ranked song. The regression models produced predictions within the same range. These values were then sorted from smallest to largest to create a predicted Eurovision ranking. This methodology was applied to each event: semi‑final 1, semi‑final 2, and the grand final. Typically, 15– to 19 countries compete in eacha semi‑final, and 25– to 27 participate in the grand final, including the automatic qualifiers.
The regression results were interpreted using the R2 metric to understand how well the data fit the model. R2 measures the proportion of variance in the dependent variable that is predictable from the independent variables.
The predicted rankings of the Eurovision semi‑finals and grand final were evaluated using Spearman’s () and Kendall’s () rank correlation coefficients. These coefficients were employed to assess the similarity in the ordering of the rankings by determining how closely they resembled the actual results (Demergis, 2019).
Average rank errors were also computed for each predicted ranking to evaluate the accuracy of predictions by measuring the average deviation between the true rankings and predicted rankings. In practice, an average rank error of 0 signifies perfect predictions, while higher values reflect larger discrepancies between predicted and actual ranks, indicating less accurate predictions.
The results are summarised in Tables 3–6 and Figure 3. Table 3 presents the average rank errors across all experiments for the semi‑finals and grand finals. For the semi‑finals, averages are computed first across both events (semi‑final 1 and semi‑final 2) within each year and then across all years. Table 4 reports Spearman’s rank correlation coefficients for all feature set approaches across all years of semi‑finals, with separate values for the first and second semi‑finals. Only coefficients with statistically significant correlations (p‑value < 0.05) are included. A dash in these cells indicates that the coefficient was not statistically significant. Figure 3 displays the average rank errors, while Table 5 provides the test values for all feature sets across all experiments using grand final data. Finally, Table 6 presents Spearman’s rank correlation coefficients for all feature set approaches across all years of grand final data, again including only significant correlations (p‑value < 0.05).
Table 3
Average rank errors across all years for all semi‑finals and grand finals. Bold values indicate the lowest error across all feature set approaches.
| Avg. rank errors | Approach 1 | Approach 2 | Approach 3 | Approach 4 | Approach 5 | Approach 6 | Approach 7 |
|---|---|---|---|---|---|---|---|
| Semi‑finals | 5.62 | 4.60 | 4.01 | 3.70 | 4.08 | 4.79 | 3.47 |
| Grand final | 7.88 | 7.63 | 6.27 | 6.07 | 6.05 | 7.59 | 6.27 |
Table 4
Semi‑final results: Spearman’s rank correlation coefficients for all feature set approaches across each year’s semi‑final 1 (SF 1) and semi‑final 2 (SF 2). Bold values indicate the highest correlation for a given year, semi‑final, and approach.
| Year | Approach 1 Rank Corr. | Approach 2 Rank Corr. | Approach 3 Rank Corr. | Approach 4 Rank Corr. | Approach 5 Rank Corr. | Approach 6 Rank Corr. | Approach 7 Rank Corr. | |||||||
|---|---|---|---|---|---|---|---|---|---|---|---|---|---|---|
| SF 1 | SF 2 | SF 1 | SF 2 | SF 1 | SF 2 | SF 1 | SF 2 | SF 1 | SF 2 | SF 1 | SF 2 | SF 1 | SF 2 | |
| 2008 | – | – | 0.50 | – | 0.55 | – | 0.77 | – | 0.76 | – | – | – | 0.80 | – |
| 2009 | – | – | 0.79 | 0.59 | 0.66 | 0.63 | 0.63 | 0.68 | – | – | 0.66 | 0.49 | 0.59 | 0.70 |
| 2010 | – | – | – | 0.68 | – | – | – | – | – | – | – | 0.73 | 0.51 | 0.74 |
| 2011 | – | – | – | – | – | – | – | 0.50 | – | 0.55 | – | – | 0.55 | – |
| 2012 | – | – | – | – | 0.54 | 0.65 | 0.76 | 0.65 | – | – | – | – | 0.70 | 0.69 |
| 2013 | – | – | – | – | – | – | – | 0.69 | – | – | – | – | – | 0.70 |
| 2014 | – | – | – | 0.64 | 0.72 | – | 0.76 | 0.82 | 0.95 | 0.76 | – | 0.56 | 0.74 | 0.84 |
| 2015 | – | – | – | – | – | – | – | – | 0.82 | – | – | – | – | – |
| 2016 | – | – | – | – | 0.70 | 0.75 | 0.62 | 0.82 | 0.63 | – | – | 0.48 | 0.62 | 0.74 |
| 2017 | – | – | – | – | 0.75 | – | 0.68 | – | – | – | – | – | 0.78 | 0.50 |
| 2018 | – | – | – | – | 0.59 | – | 0.58 | 0.61 | – | – | – | 0.51 | 0.72 | 0.52 |
| 2019 | – | – | – | – | – | – | – | – | – | 0.65 | – | – | – | – |
| 2021 | – | – | – | – | 0.55 | 0.75 | – | – | 0.92 | – | – | – | – | 0.68 |
| 2022 | 0.53 | – | 0.52 | – | – | 0.48 | 0.54 | – | – | – | – | – | 0.55 | – |
| 2023 | – | – | – | – | 0.59 | 0.54 | 0.71 | 0.78 | 0.85 | – | – | – | 0.65 | – |
| 2024 | – | – | – | – | 0.60 | 0.65 | 0.60 | 0.62 | 0.69 | – | – | – | 0.66 | 0.65 |
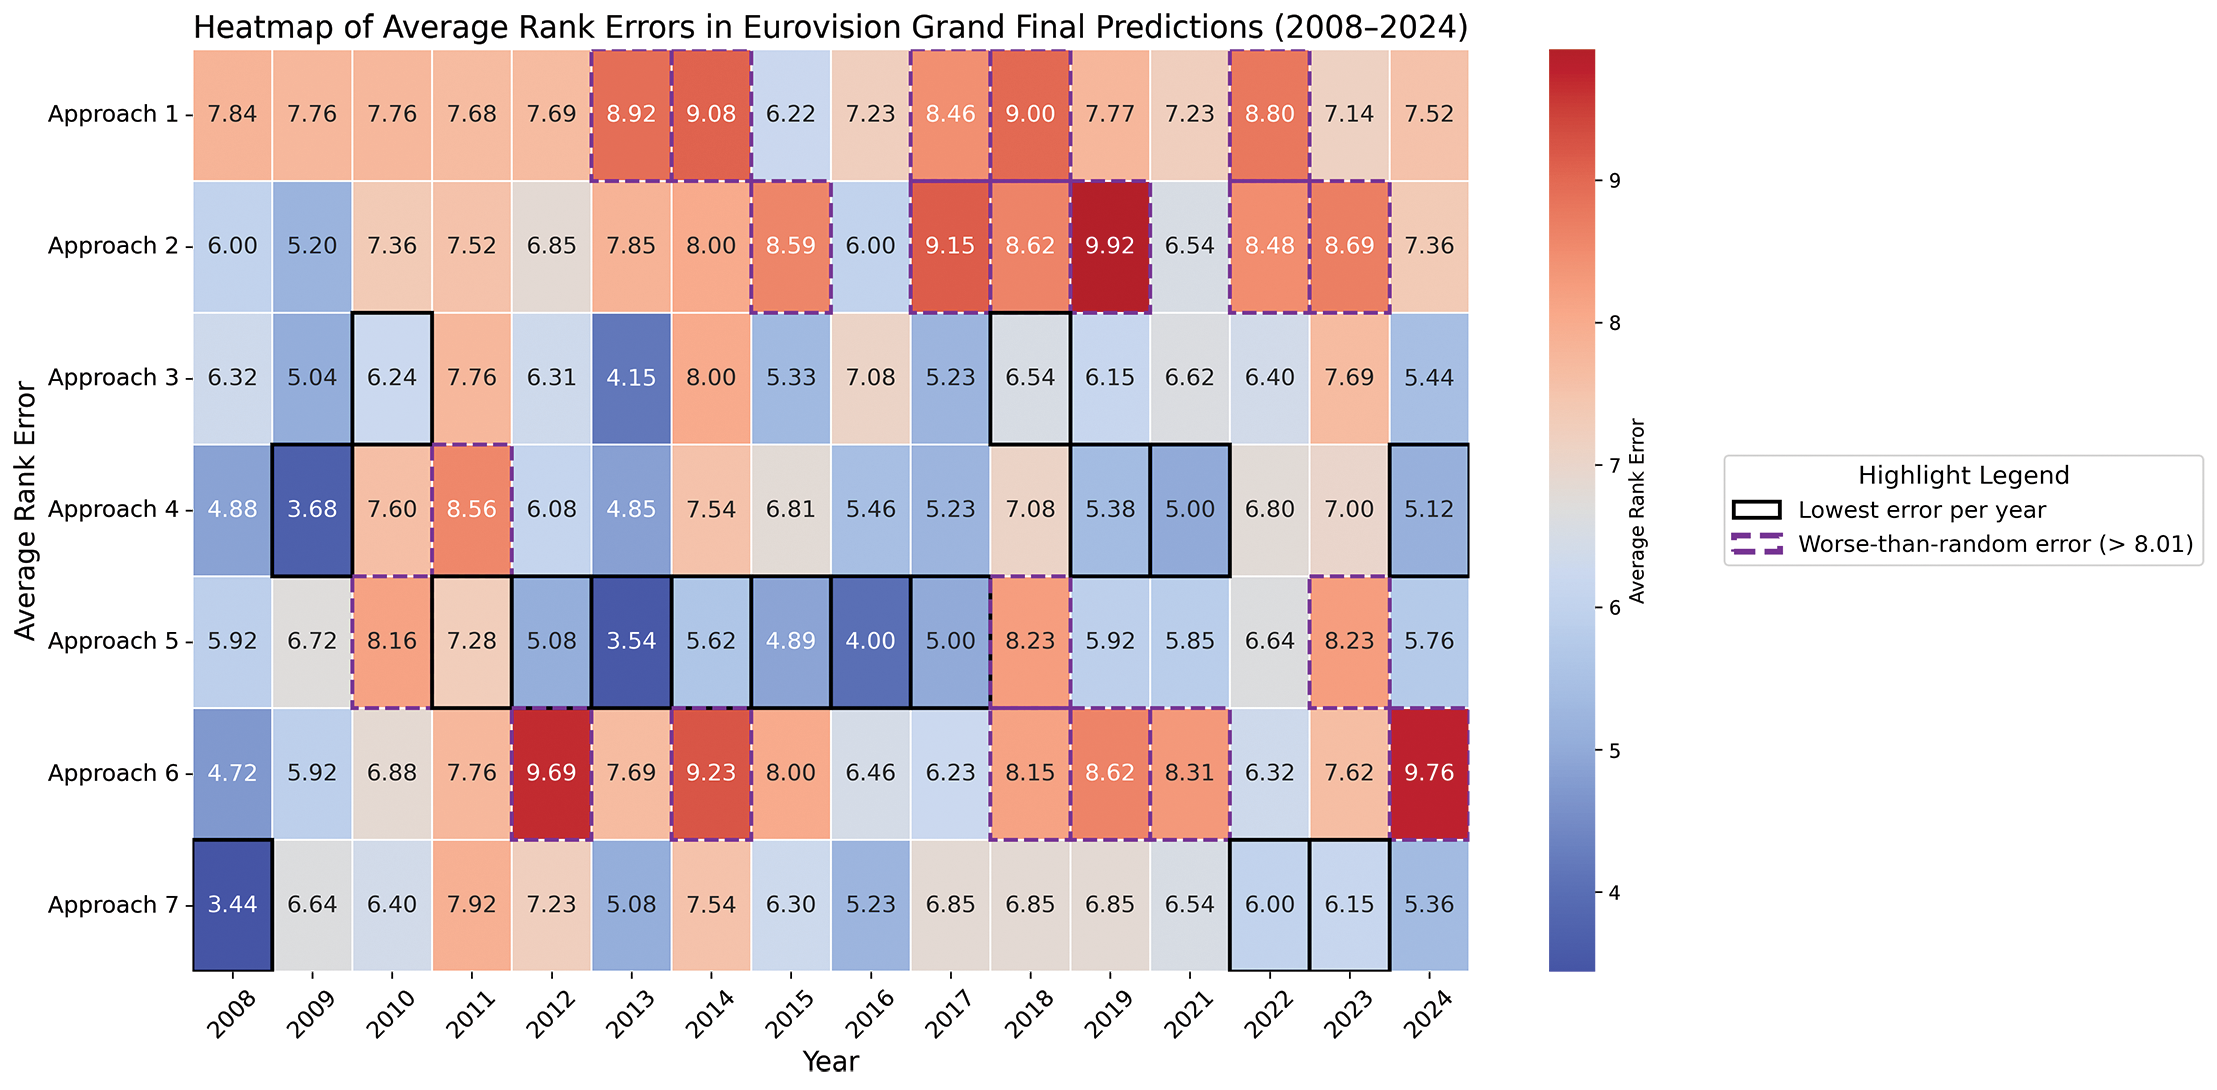
Figure 3
Grand final results: Heatmap illustrating the average rank errors for all feature set approaches. Black borders highlight the best‑performing approach (lowest error) for each year, while purple dashed borders indicate worse‑than‑random performance (errors greater than 8.01).
Table 5
Grand final results: Test values for all feature set approaches across all years.
| Year | Approach 1 R2 | Approach 2 R2 | Approach 3 R2 | Approach 4 R2 | Approach 5 R2 | Approach 6 R2 | Approach 7 R2 |
|---|---|---|---|---|---|---|---|
| 2008 | 0.02 | 0.12 | 0.17 | 0.27 | 0.32 | 0.22 | 0.48 |
| 2009 | 0.04 | 0.26 | 0.28 | 0.36 | 0.17 | 0.09 | 0.09 |
| 2010 | 0.01 | 0.03 | 0.09 | 0.08 | 0.09 | 0.09 | 0.16 |
| 2011 | 0.01 | 0.03 | –0.03 | –0.05 | 0.02 | 0.04 | –0.04 |
| 2012 | 0.04 | 0.07 | 0.16 | 0.18 | 0.25 | –0.11 | 0.14 |
| 2013 | –0.05 | 0.04 | 0.42 | 0.41 | 0.33 | 0.04 | 0.31 |
| 2014 | –0.09 | 0.01 | 0.09 | 0.06 | 0.18 | –0.06 | 0.03 |
| 2015 | 0.08 | 0.04 | 0.27 | 0.13 | 0.24 | 0.06 | 0.15 |
| 2016 | 0.03 | 0.14 | 0.14 | 0.30 | 0.37 | 0.11 | 0.37 |
| 2017 | –0.02 | –0.17 | 0.22 | 0.25 | 0.25 | 0.13 | 0.13 |
| 2018 | –0.05 | –0.02 | 0.10 | 0.09 | 0.14 | –0.02 | 0.03 |
| 2019 | 0.02 | –0.08 | 0.20 | 0.25 | 0.31 | –0.04 | 0.19 |
| 2021 | 0.06 | 0.09 | 0.12 | 0.28 | 0.20 | –0.09 | 0.19 |
| 2022 | –0.01 | –0.15 | 0.19 | 0.06 | 0.16 | 0.09 | 0.11 |
| 2023 | 0.03 | –0.03 | –0.01 | 0.06 | 0.07 | –0.01 | 0.12 |
| 2024 | 0.01 | 0.04 | 0.38 | 0.29 | 0.42 | –0.37 | 0.25 |
Table 6
Grand final results: Spearman’s rank correlation coefficients for all feature set approaches across all years. Bold values indicate the highest coefficient for a given year and approach.
| Year | Approach 1 Rank Corr. | Approach 2 Rank Corr. | Approach 3 Rank Corr. | Approach 4 Rank Corr. | Approach 5 Rank Corr. | Approach 6 Rank Corr. | Approach 7 Rank Corr. |
|---|---|---|---|---|---|---|---|
| 2008 | – | 0.42 | 0.41 | 0.53 | 0.51 | 0.61 | 0.75 |
| 2009 | – | 0.59 | 0.62 | 0.77 | – | – | – |
| 2010 | – | – | – | – | – | – | – |
| 2011 | – | – | – | – | – | – | – |
| 2012 | – | – | 0.43 | 0.47 | 0.57 | – | – |
| 2013 | – | – | 0.76 | 0.65 | 0.71 | – | 0.62 |
| 2014 | – | – | – | – | 0.47 | – | – |
| 2015 | 0.44 | – | 0.61 | 0.41 | 0.52 | – | 0.44 |
| 2016 | – | 0.50 | – | 0.54 | 0.74 | – | 0.64 |
| 2017 | – | – | 0.51 | 0.58 | 0.56 | 0.43 | – |
| 2018 | – | – | – | – | – | – | – |
| 2019 | – | – | 0.45 | 0.59 | 0.54 | – | – |
| 2021 | – | – | 0.42 | 0.62 | 0.48 | – | 0.44 |
| 2022 | – | – | 0.41 | – | – | – | – |
| 2023 | – | – | – | – | – | – | 0.43 |
| 2024 | – | – | 0.54 | 0.61 | 0.44 | – | 0.49 |
4.3 Approach 1: Intrinsic characteristics of songs
On average, models trained on audio and lyrics features yielded the highest average rank errors for both the semi‑finals and grand final, making this the least accurate approach. The very low R2 values in Table 5 indicate that these models struggle to capture the relationship between intrinsic song attributes and final rankings. An examination of the ordinal correlations in Tables 4 and 6 reveals that the predictions generally did not align with the true rankings. The observed correlations for the 2022 first semi‑final and the 2015 grand final appear to be outliers.
4.4 Approach 2: Intrinsic characteristics of songs and eurovision data
While the incorporation of Eurovision contest data slightly reduced the average rank errors, the models still struggled to estimate rankings accurately, as indicated by the R2 values in Table 5. However, when examining the results for the earliest years in the dataset, 2008 and 2009, the improvement was more substantial. This is reflected in Spearman’s ordinal correlations for the grand finals, which were (0.42) and (0.59), respectively. A similar trend was observed for 2008’s first semi‑final and both semi‑finals in 2009. This pattern, however, was not observed in the later years, suggesting that contest‑specific data may have been more relevant in the past.
4.5 Approach 3: Intrinsic characteristics of songs and public appeal
The inclusion of a feature set combining intrinsic song features and YouTube daily views further improved predictions by reducing average rank errors. This approach often yielded moderate‑to‑strong Spearman’s correlations, particularly in the semi‑finals (Table 4), where audience engagement plays a significant role. For the grand finals, model performance, as represented by R2, improved, indicating a better data fit. Significant ordinal correlations were achieved in 10 out of the 16 years tested, with 2013 and 2015 outperforming other approaches. The public appeal feature, represented by YouTube daily views, emerges as a critical factor for enhancing prediction accuracy.
4.6 Approach 4: Intrinsic characteristics of songs and public appeal and eurovision data
This approach, which combines all available features, further reduced average rank errors in both the semi‑finals (3.70) and grand finals (6.07) (Table 3). Spearman’s rank correlations were significant in most years for both the semi‑finals and the grand final, often outperforming other approaches—particularly in the grand finals of 2024, 2021, 2019, 2017, and 2009. Integrating intrinsic song characteristics, public appeal, and contest‑specific data provides a promising prediction model which performs relatively consistently across semi‑finals and grand finals over the years.
4.7 Approach 5: Public appeal
As the YouTube daily views metric has been identified as a prominent predictor of Eurovision success, it is important to evaluate how well this feature performs independently, without intrinsic song features or contest data.
On average, this approach resulted in higher average rank errors in the semi‑finals (4.08) compared to Approach 4, which combines all features. It also produced fewer ordinal correlations across both semi‑finals, indicating less consistent predictions across the two events each year. However, in some cases, the correlations for the first semi‑finals were exceptionally high, such as (0.95) in 2014, (0.82) in 2015, (0.92) in 2019, and (0.85) in 2023, outperforming other approaches in those years.
Focusing on semi‑final predictions for 2023 and 2024, the first two years when rankings were determined entirely by public vote, Approach 4, which incorporates all features, achieves rankings that significantly correlate with actual results for both semi‑finals. However, this approach does not achieve significant correlations for the second semi‑finals (Table 4).
According to the average rank errors for grand finals (Figure 3), this approach outperformed others between 2011 and 2017, achieving the lowest average rank error across all years (6.05). However, in grand final predictions, this approach only outperformed others in terms of Spearman’s rank correlation in 2012, 2014, and 2016, falling short compared to approaches that combine public appeal with additional features.
While public appeal alone can be a strong predictor in some cases, its inconsistency makes it less reliable. The post‑contest exposure effect plays a significant role; while more successful songs often attract greater attention, as reflected in daily view counts, popularity can also stem from factors unrelated to contest performance. Moreover, YouTube daily views might be insufficient for grand final ranking predictions, where jury votes play a significant role alongside public voting.
4.8 Approach 6: Eurovision data
This approach showed reduced performance across all metrics compared to Approaches 3, 4, and 5. Although useful for understanding Eurovision‑specific dynamics, relying solely on performance order and country voting patterns proved insufficient for accurate predictions.
When compared to Approach 2, which combines intrinsic song features with contest data, the limited number of ordinal correlations, particularly for the second semi‑final across multiple years, underscores the importance of historical voting patterns.
4.9 Approach 7: Public appeal and eurovision data
This approach, which excludes intrinsic song features, ranked among the top‑performing methods, particularly in the semi‑finals, achieving the lowest average rank error (3.47). It also demonstrated the most consistent ordinal correlations, predicting both semi‑finals in 8 out of 16 years with moderate‑to‑strong correlations.
However, its performance on grand final data was weaker than that of other approaches. This is evident in its average rank error (6.27), R2 values (Table 5), and fewer ordinal correlations, outperforming other feature approaches only in 2008. Combining public appeal with Eurovision data offers a robust model, particularly in the semi‑finals, but it remains insufficient for grand final predictions.
Baseline comparison: Random rankings vs. model predictions
4.10
Random rankings for both semi‑finals and grand finals were generated in a 1,000‑run simulation, considering the contest years in the dataset and the number of participating songs each year. These random rankings serve as a baseline to compare against predictions, assessing how well the models perform relative to chance and how effectively meaningful patterns are captured. The simulation produced an average rank error of (8.55) for the grand final, with a 95% confidence interval of (8.01, 9.08). For the semi‑finals, the average rank error was (5.76), with a 95% confidence interval of (5.44, 6.07).
Comparing the random rank errors with the average rank errors across all years in Table 3, predictions outperformed chance in all cases except Approach 1 for the semi‑finals. In Figure 3, which displays average rank errors across all years for grand final results, predictions of Approaches 3, 4, and 7 consistently performed better than random.
5 Discussion
When interpreting results in scenarios like the Eurovision Song Contest, it is crucial to select an approach that consistently delivers the best and most stable outcomes across all events, including both semi‑finals and the grand final. Based on the analysis of results, this study identifies Approach 4 as the most comprehensive and well‑rounded method, highlighting the importance of integrating intrinsic song features, public appeal, and Eurovision‑specific features.
However, the predictions under Approach 4 may be affected by post‑contest exposure bias. Considering YouTube views over a fixed period of time prior to the competition would mitigate such bias while also providing valuable insights, especially as a measure of audience familiarity and pre‑contest exposure; nevertheless, accessing historical views at specific points in time poses a challenge.
There are further risks associated with using a feature like YouTube daily views. While it reflects the public’s enjoyment of a song over time, it also depends on the level of media attention a song receives, which can be influenced by genuine appeal, appreciation, or public controversies. In addition, if an artist chosen to represent their country is already well‑known, either domestically or internationally, their song may receive more attention regardless of its quality. Moreover, YouTube views can be misleading because the location of the viewers is always unknown. Since Eurovision fans cannot vote for their home country, high YouTube viewership concentrated in the artist’s home country may not accurately reflect success in the contest.
The particular intrinsic song characteristics tested in this study alone were not sufficient for accurate ranking predictions, suggesting the need for additional contextual or public appeal data. This outcome aligns with expectations, given the low correlation between audio features and contest rankings and the virtually non‑existent correlation with lyrics features. The low‑level audio attributes used in this study are also challenging to interpret due to their low level of abstraction. Even attributes such as dynamic complexity, average loudness, and the 1st principal component of ERB band features, which showed slightly higher relevance compared to other audio features, offer limited insight into the specific qualities that contribute to Eurovision’s success. Furthermore, lyrics repetitiveness may have appeared less relevant due to the generally repetitive nature of Eurovision songs.
Analysing Eurovision voting history aids in estimating results for countries that have a history of consistent success in the contest, particularly those that receive and reciprocate support from their strategic friend countries. However, not all countries have been historically successful, including some that have recently returned to participation after a hiatus. Therefore, in a prediction task, incorporating past voting features may disadvantage some participating countries, even if they enter with a song that is well received by the public.
Finally, Approaches 5, 6, and 7 demonstrated that excluding intrinsic song attributes from the low level did not necessarily lead to improved predictions with the XGBoost model. Focusing solely on public appeal, running order, and country voting patterns does not capture the essence of Eurovision, which is characterised by musical surprises and enjoyment that transcend country borders.
6 Conclusion and Future Work
The novelty of this study lies in applying a hit song prediction framework to forecast the outcomes of the Eurovision Song Contest—a methodology that has not been explicitly explored in peer‑reviewed research. When comparing these findings with the broader literature on music representations’ modest but meaningful ability to explain variance in Eurovision competitiveness (Burgoyne et al., 2023), the results are consistent. Approach 1, which models intrinsic song features alone, explains little of the variance in contest outcomes, accounting for just 1%–8% in some of the evaluated yearly grand final rankings.
Additionally, ordinal correlations with Eurovision rankings achieved through social media sentiment analysis in prior studies (Demergis, 2019; Kumpulainen et al., 2020) were matched or exceeded by several approaches in this study. Notably, while these previous studies focused on predicting rankings for a single contest year, this study provides a broader evaluation across multiple years.
In the future, this methodology could be further discussed in the context of broader approaches for predicting hit songs. However, the overall conclusion that additional contextual features are essential aligns with the multi‑modal theme of HSS, reinforcing the importance of combining diverse data sources for robust prediction models.
In future work, emphasis should be placed on identifying features that represent intrinsic characteristics of songs to better understand what makes a song appealing to the public. Expanding the scope of audio feature analysis to cover more descriptive and sophisticated musical aspects—for example, through temporal analysis—could provide deeper insights. Leveraging more advanced audio features, potentially through a deep neural network (DNN) pre‑trained on audio, might also enhance predictive accuracy. One promising approach involves self‑supervised music representation learning models to extract embeddings for all song entries, as demonstrated in the previous study (Burgoyne et al., 2023). In order to enhance explainability, which is often challenging to achieve with DNNs, it would be beneficial to maintain a method that identifies individual features and explores their relationships with success.
In this paper, the YouTube daily views metric is considered biased due to the post‑contest exposure effect. Public appeal estimation from YouTube views could be improved by modelling popularity using a logarithmic growth function, which reflects the typical pattern of viral video views: rapid initial growth followed by a gradual slowdown and eventual plateau.
Additionally, exploring other data modalities presents a promising direction for future research. For instance, artist popularity prior to the contest and social media discussions could serve as valuable indicators of public sentiment and Eurovision success. Similarly, video features might help capture performance elements that are difficult to quantify, such as showmanship, stage presence, choreography, and artist charisma—factors that play a significant role in engaging audiences. While these elements might seem inherently unpredictable, video data could provide a structured way to access such information, making it an exciting avenue for future exploration.
In hit song prediction tasks, the target variable related to a song’s success typically reflects the song’s popularity accumulated over time, defining success as a long‑term achievement attained through actual artistic merit. On the other hand, the Eurovision prediction framework interprets success as a short‑term outcome, determined by the immediate results of public and jury votes.
This study revealed that the YouTube daily views metric correlates more strongly with the particular audio features than Eurovision rankings do. This finding opens up an interesting research direction: exploring the success of contest songs beyond the Eurovision framework.
A win in Eurovision does not guarantee that the song will be a long‑term hit once the competition is over. Similarly, finishing in the bottom ranks can be the beginning of a successful international career. Predicting Eurovision results and forecasting the long‑term success of Eurovision songs are, of course, two distinct problems that require different considerations. Yet, there may be undiscovered confounding variables that affect a song’s success, highlighting that different factors contribute to short‑term and long‑term success.
7 Reproducibility
To ensure research reproducibility, this study made use of the MIRoVision dataset (Spijkervet, 2020), which contains the metadata, lyrics, contest ranking, and voting data of songs from Eurovision Song Contests, and is freely available for anyone wishing to conduct similar research. The GitHub repository linked to the dataset also offers tools for audio feature extraction from YouTube links.8
The data used in this study, including both the semi‑final and grand final versions of the dataset, as well as feature extraction notebooks and scripts for analysis, model training, and evaluation, are available in this GitHub repository: https://github.com/kasiadamska/eurovision-song-science.
Acknowledgements
The first author conducted the analysis and wrote the paper under the guidance and with feedback from the second author, the PhD supervisor.
Funding Information
The first author is a research student at the UK Research and Innovation (UKRI) Centre for Doctoral Training in Artificial Intelligence and Music, supported jointly by UK Research and Innovation (grant number EP/S022694/1) and Queen Mary University of London.
Competing Interests
The authors declare that they have no competing interests.
Notes
[2] Link to Eurovision news item: https://eurovision.tv/story/united-by-music-permanent-slogan
[3] Link to Eurovision news item: https://eurovision.tv/story/eurovision-2024-breaks-new-records
[4] Link to the official Eurovision website: https://eurovision.tv/
[5] Link to Eurovision World fan website: https://eurovisionworld.com
[6] Link to Eurovision Song Contest YouTube channel: http://www.youtube.com/@EurovisionSongContest
[7] Link to Essentia Music Extractor documentation: https://essentia.upf.edu/streaming_extractor_music.html
[8] Link to FLAML AutoML for XGBoost documentation: https://microsoft.github.io/FLAML/docs/Examples/AutoML-for-XGBoost/
[9] Link to MIRoVision dataset GitHub repository: https://github.com/Spijkervet/eurovision-dataset