
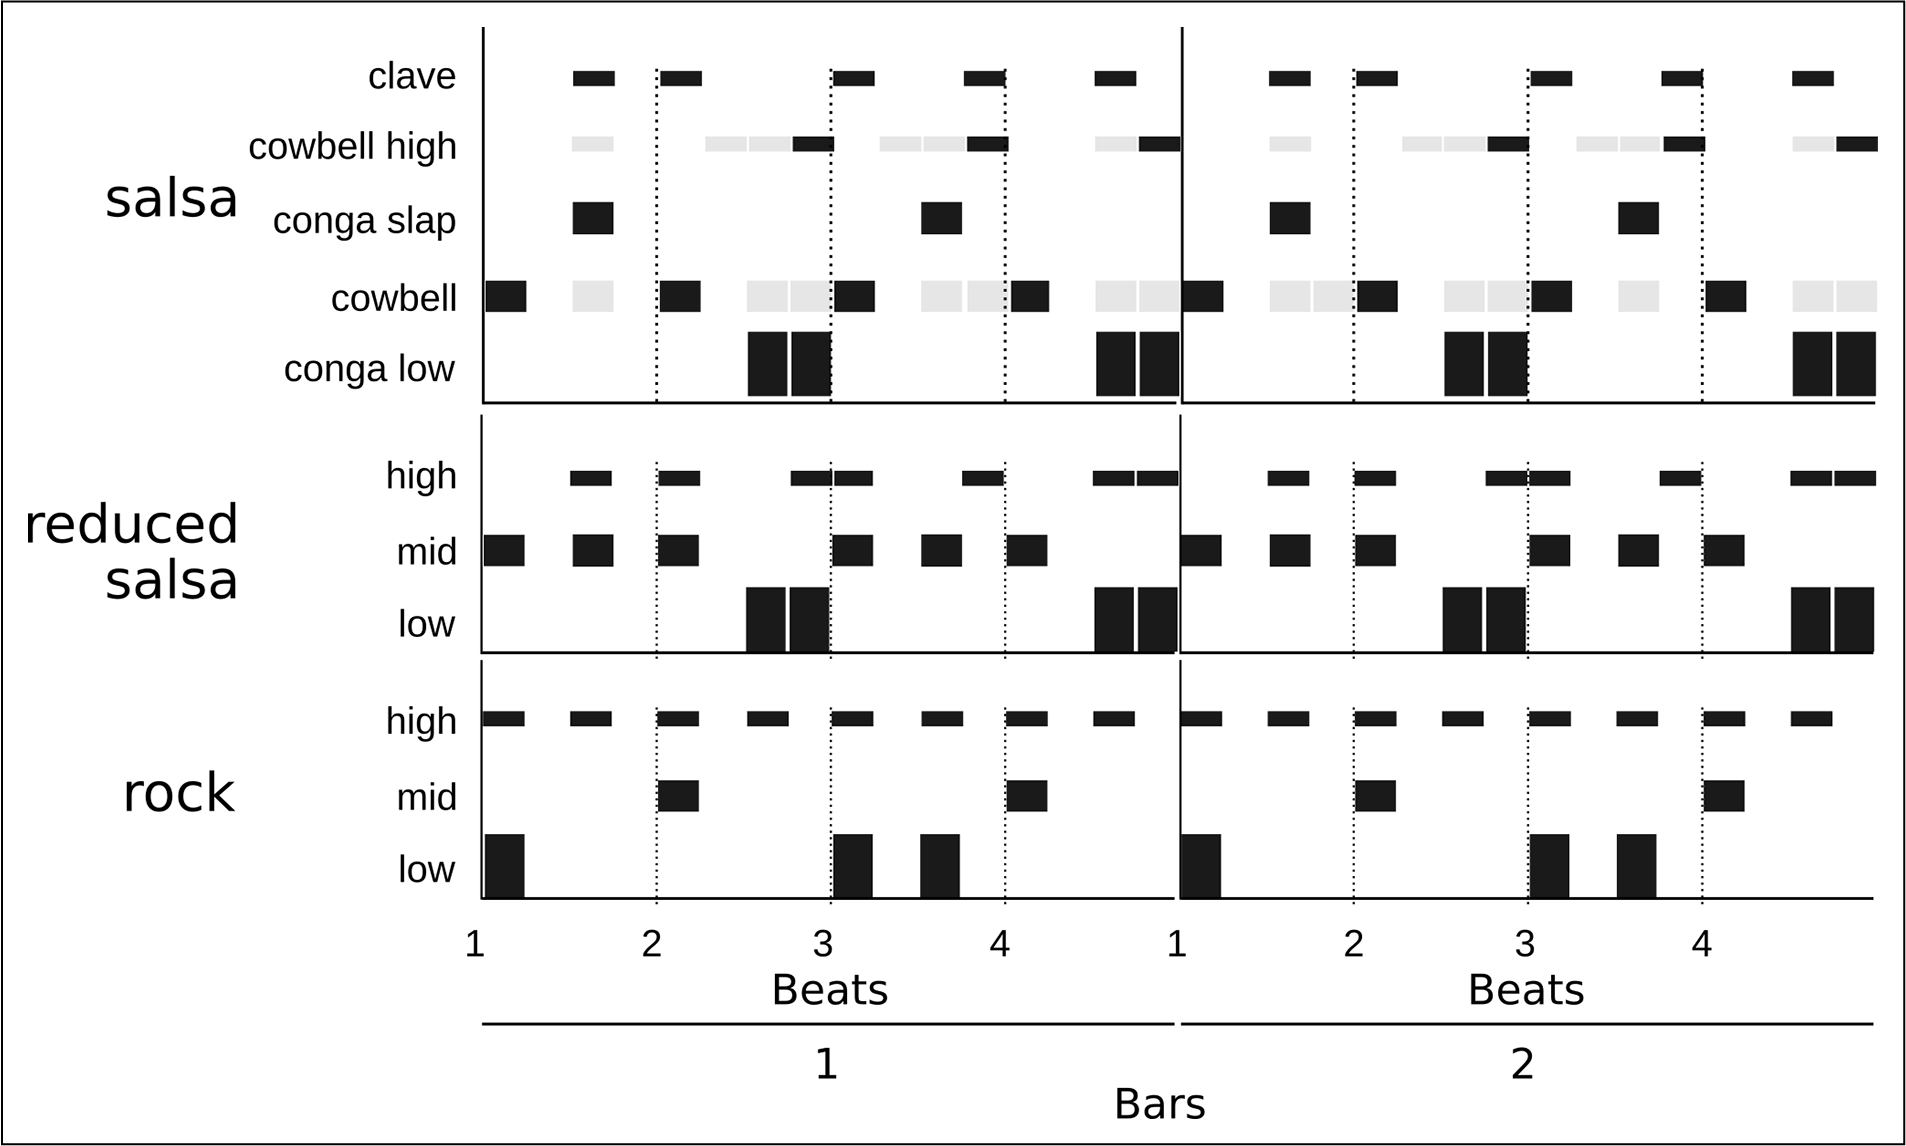
Figure 1
Salsa pattern (top) and three‑instrument reductions of salsa and rock (center and bottom). The salsa pattern (top) presents accentuated onsets in a dark color and unaccentuated onsets in grey.
Table 1
List of published datasets (including salsa) focused on beat estimation including their year of publication, total music time, total beat annotations, genres, and number of songs per style
| Name | Year | Time (s) | Beats | Genres | Pieces |
|---|---|---|---|---|---|
| Hainsworth | 2004 | 11,940 | n/r | Multiple | 221 |
| Klapuri | 2005 | 30,240 | 60,600 | Multiple | 505 |
| Simac | 2005 | 11,960 | n/r | Multiple | 595 |
| Mirex06 | |||||
| Train | 2006 | 600 | n/r | n/r | 20 |
| QMUL: | |||||
| Beatles | 2009 | 29,333 | 52,729 | Rock | 180 |
| QMUL: | |||||
| Zweieck | 2009 | 3,200 | 6,553 | Pop | 18 |
| SMC Mirex | 2012 | 8,680 | 10,700 | Multiple | 217 |
| Hardcore | |||||
| HJDB | 2012 | 11,940 | n/r | jungle | 236 |
| drum ’n’ bass | |||||
| Ballroom | 2013 | 20,940 | 44,605 | Multiple | 698 |
| RobbieW. | 2013 | 16,200 | 6,787 | Pop | 62 |
| CarnaticR | 2014 | 57,600 | 89,627 | Indian | 176 |
| Candombe | 2015 | 7,200 | 4,700 | Candombe | 26 |
| GTZAN | 2015 | 30,000 | 204,784 | Blues, | 1,000 |
| Classical | |||||
| Jazz | |||||
| Audio‑Alig. | 2018 | 25,200 | 68,570 | Jazz | 113 |
| Harmony | |||||
| Dataset | |||||
| BRID | 2018 | 8̃200 | N/A | Brazilian | 274 |
| Cuban son | 2019 | 1,990 | 738 | Salsa, son | 5 |
| and salsa | |||||
| Harmonix | 2019 | 27,360 | 379,065 | Western | 912 |
| Set | pop | ||||
| Sambaset | 2019 | 144,000 | n/r | Samba | 486 |
| Dagstuhl | |||||
| ChoirSet | 2020 | 2,600 | 3,242 | n/r | 20 |
| ASAP | 2020 | 331,200 | 692,633 | Western | |
| classical | 519 | ||||
| piano | |||||
| Acmus‑mir | 2020 | N/A | 10,270 | Bambuco | 337 |
| Salsa | 2024 | 35,488 | 50,511 | Salsa | 124 |

Figure 2
Number of songs in the dataset per decade.

Figure 3
Frequency histogram for song 316’s inter‑beat intervals. Note the unimodal distribution.
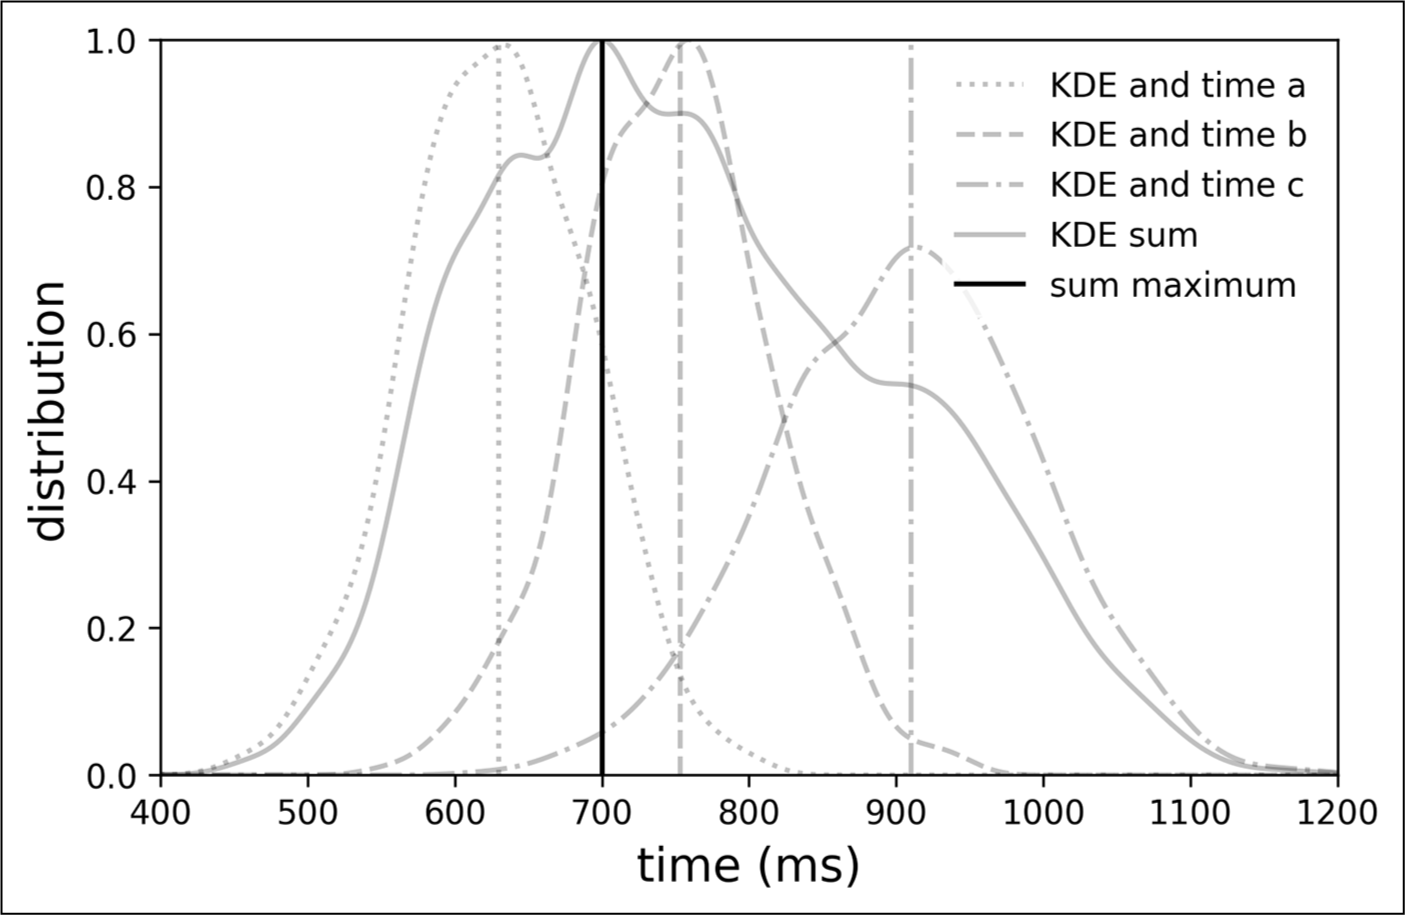
Figure 4
Consolidation of one annotation. Three annotations by subjects a, b, and c and their respective precision KDEs are indicated by gray lines (dotted, dashed, and dash‑dot). The sum of the KDEs is indicated by a continuous gray line. The maximum value of the sum is indicated by a continuous black vertical line.