
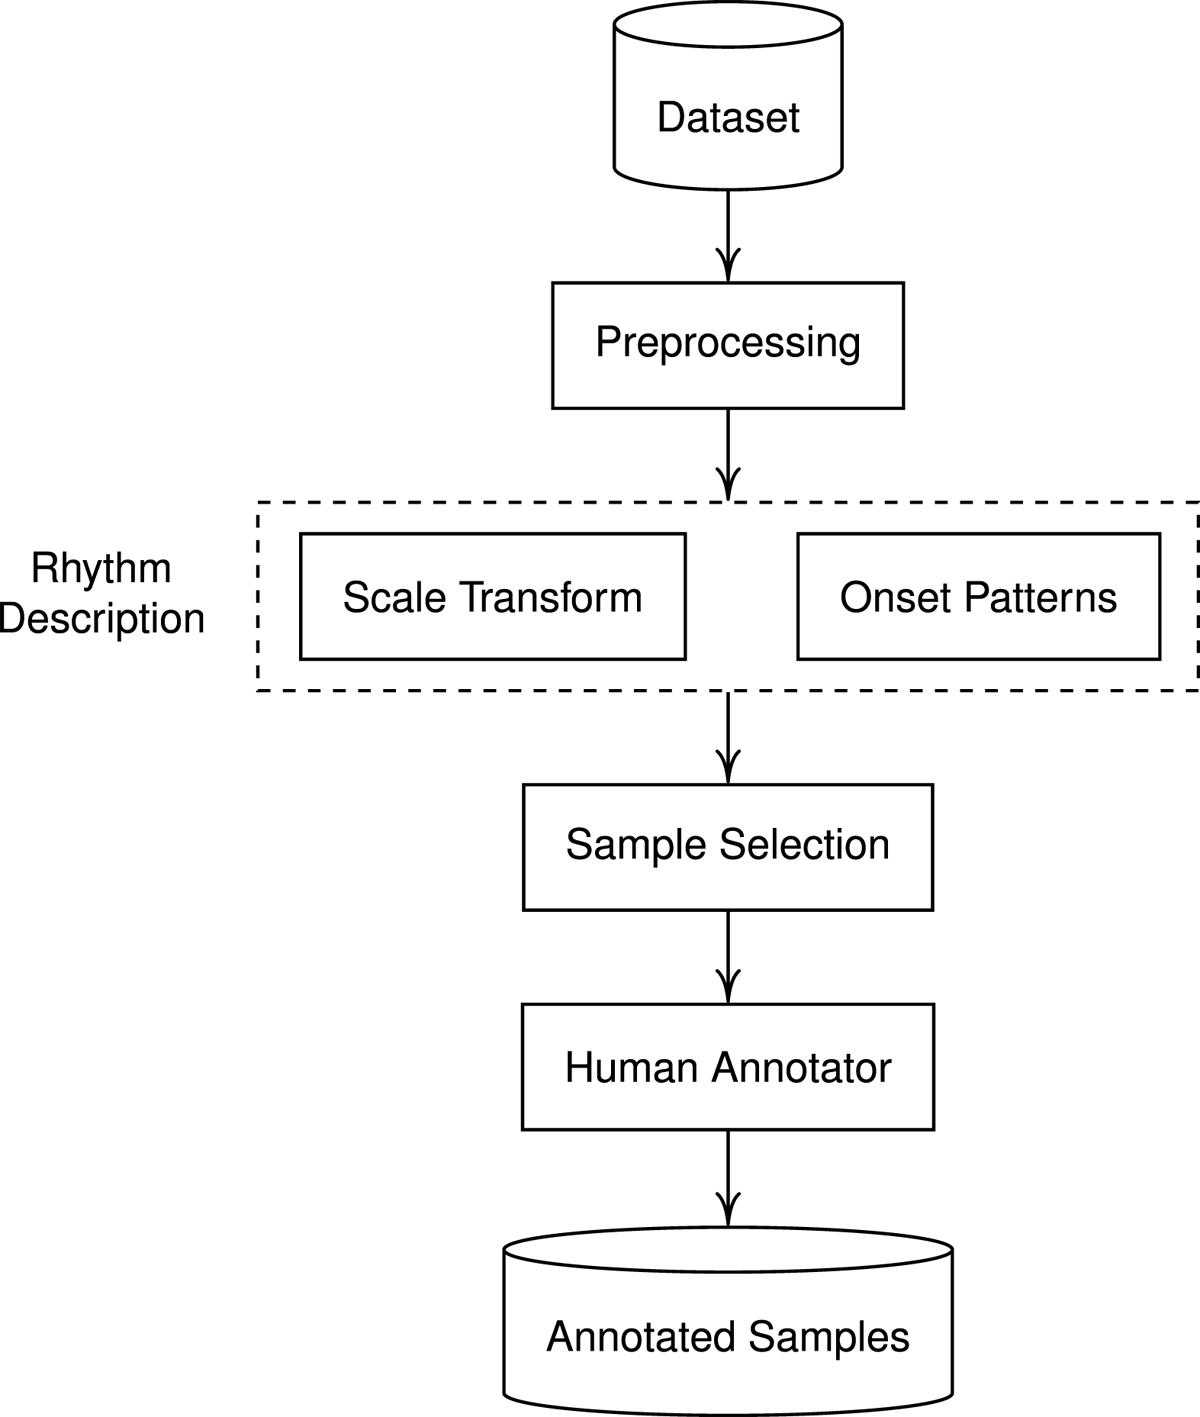
Figure 1
Construction of a set of annotated samples.
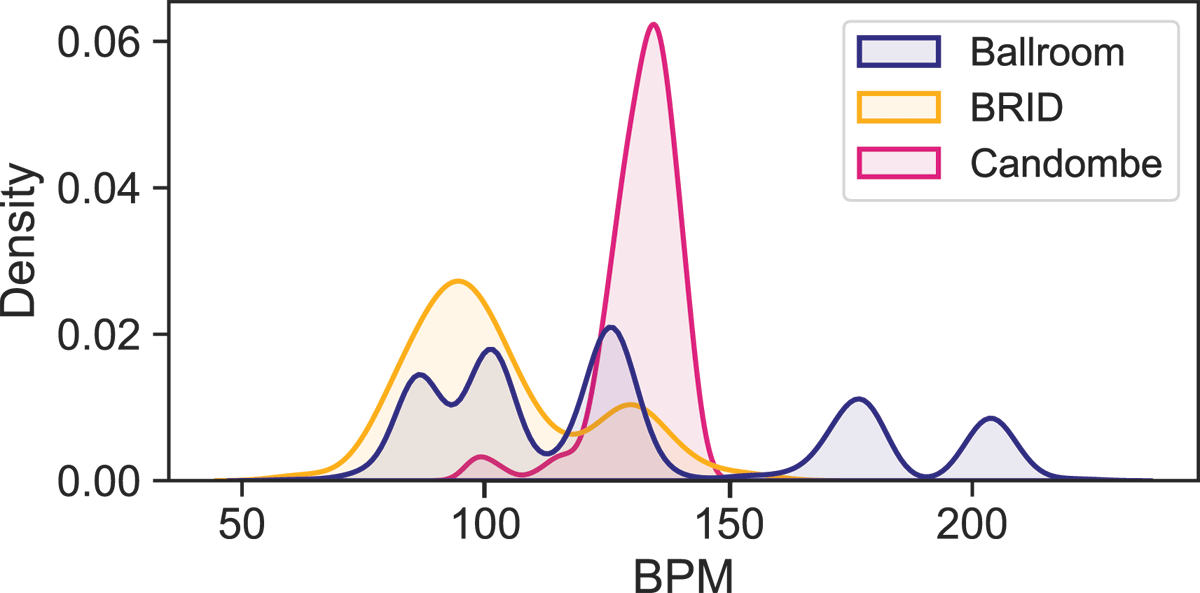
Figure 2
Global tempo distributions.
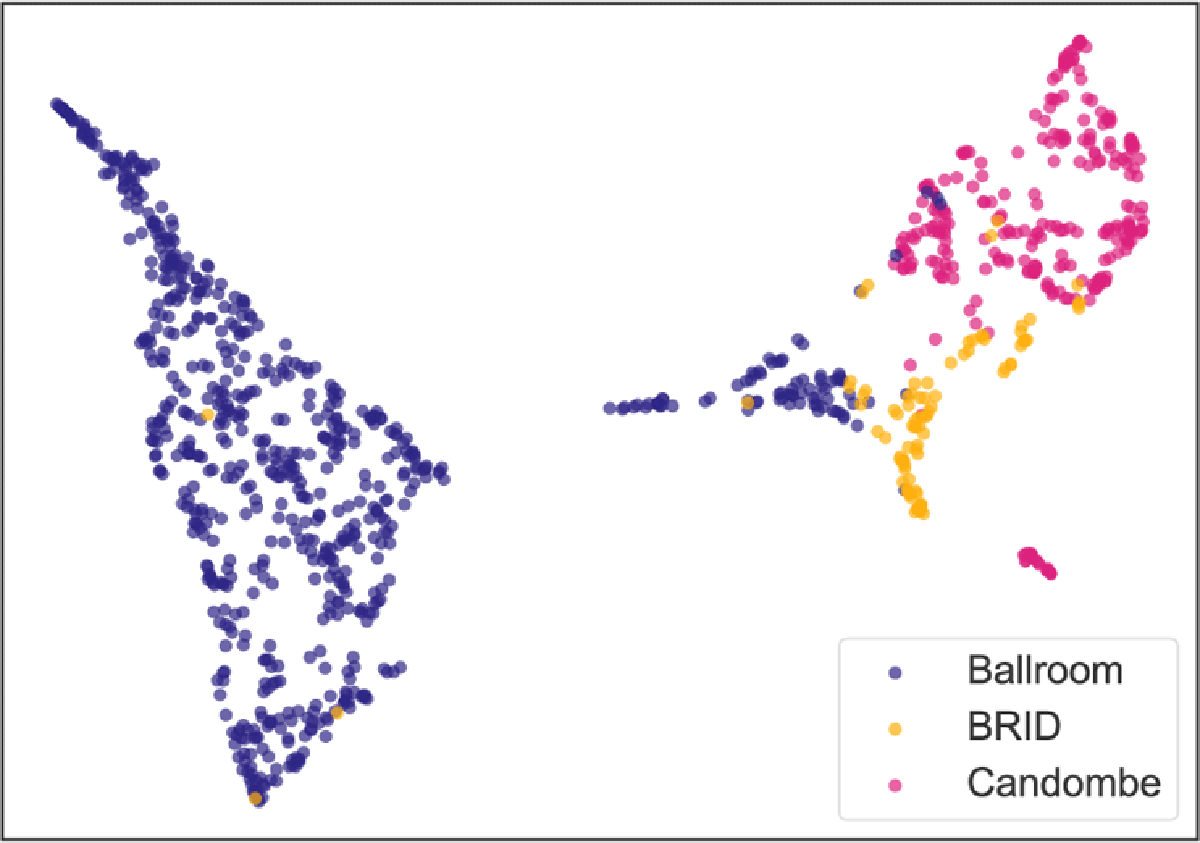
Figure 3
STM features embedded by UMAP (cosine metric, n-neighbors = 15, min-dist = 0.1).
Table 1
Performances of the state of the art (without data selection): mean (standard deviation) in %.
| BEAT F-MEASURE (%) | ||
|---|---|---|
| MODEL | BRID | CANDOMBE |
| Pre-trained (Maia et al., 2022) | 60.0 | 15.9 |
| Fine-tuned (3 min) | 93.4 (3.4) | 98.2 (1.1) |
| Trained from scratch (all) | 98.9 (1.2) | 99.8 (0.3) |
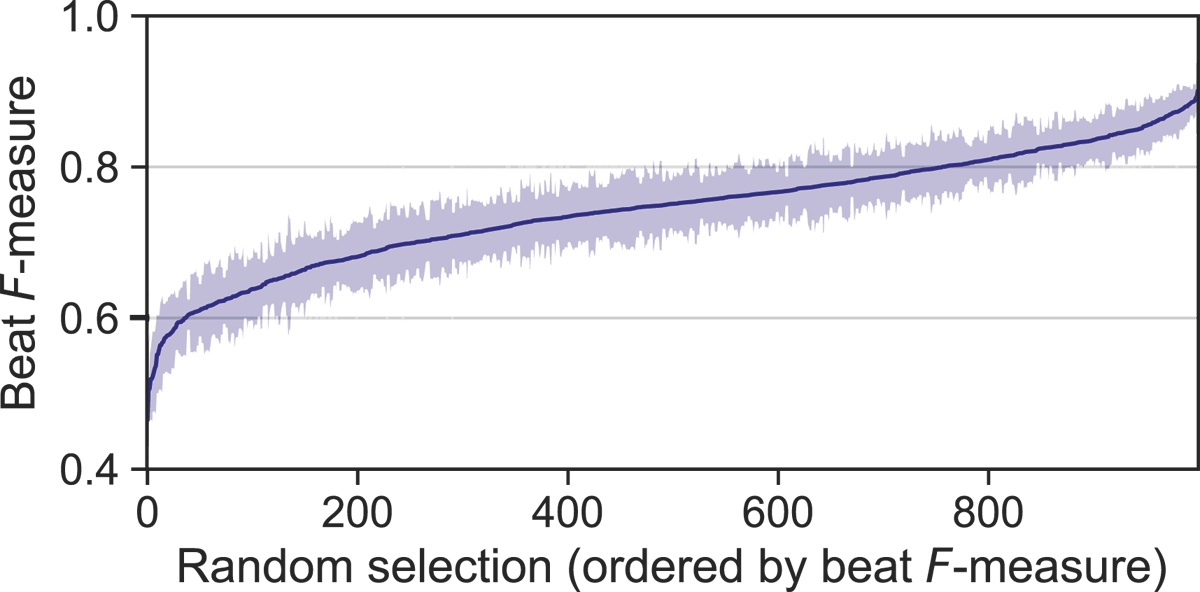
Figure 4
Results for Experiment 1. Random data selections on the BRID dataset ordered by mean F-measure, showing standard deviations (shaded area).
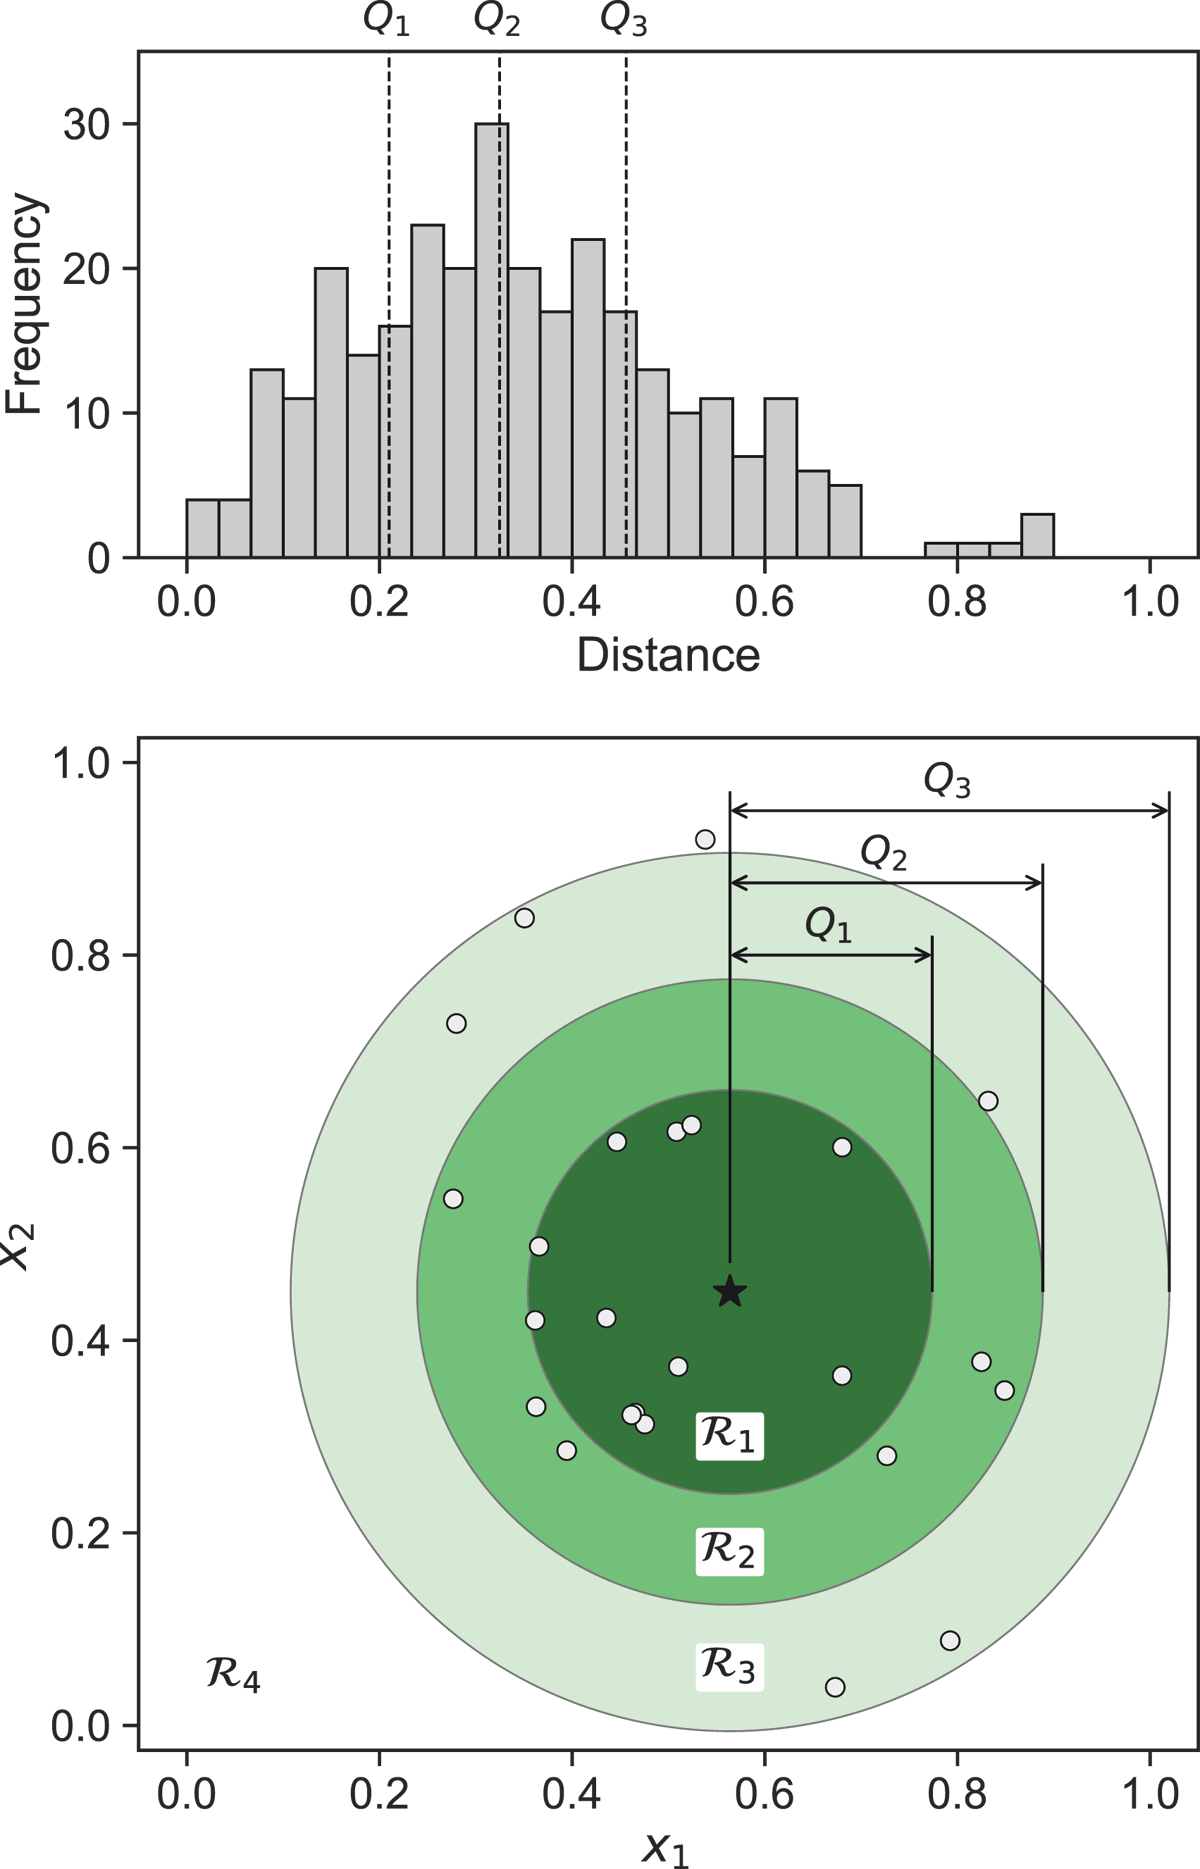
Figure 5
Example of pairwise feature distance frequencies and regions surrounding a single test sample (star) from a normal data distribution. The distance distribution (top) defines quartile regions in the feature domain (bottom).
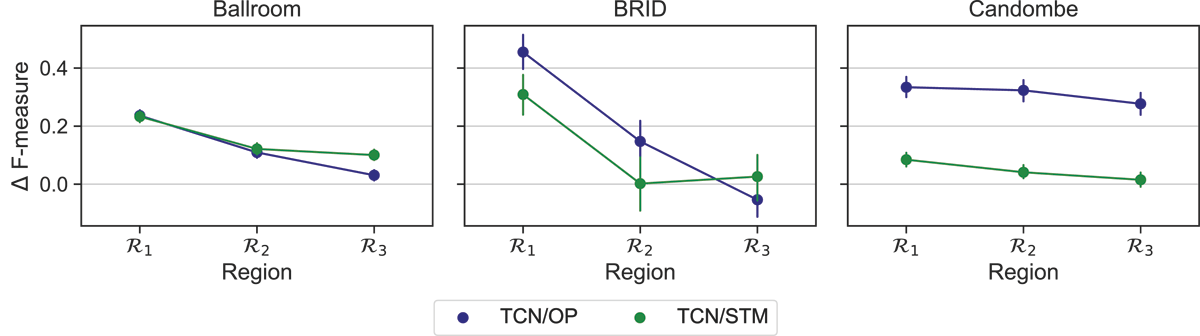
Figure 6
Results for Experiment 2. Average beat F-measure gains (95% confidence interval) w.r.t. sampling from .
Table 2
Results for Experiment 3: mean value (standard deviation) in %. In boldface, the best-performing selective sampling technique given M (budget) and feature, for each dataset; in gray, the best-performing setup in each dataset–budget pair. Sampling techniques: diversity (DIV), k-medoids (MED), maximum facility location (MFL), vote-k (VTK), random (RND).
| BEAT F-MEASURE (%) | |||||||||||
|---|---|---|---|---|---|---|---|---|---|---|---|
| ONSET PATTERNS (OP) | SCALE TRANSFORM MAGNITUDES (STM) | RND | |||||||||
| DATASET | M | DIV | MED | MFL | VTK | DIV | MED | MFL | VTK | ||
| Ballroom | 10 | 69.5 (2.3) | 77.2 (2.0) | 76.7 (2.5) | 74.8 (3.0) | 66.0 (2.9) | 77.4 (2.0) | 75.5 (1.9) | 75.2 (1.8) | 72.5 (4.5) | |
| 16 | 72.3 (2.7) | 81.1 (1.1) | 78.4 (2.3) | 77.9 (3.6) | 76.7 (1.9) | 80.4 (1.1) | 82.1 (1.1) | 78.8 (0.9) | 76.9 (3.2) | ||
| 22 | 74.1 (1.5) | 82.2 (1.1) | 82.0 (1.2) | 79.7 (1.0) | 79.8 (2.3) | 84.1 (0.7) | 85.4 (0.6) | 81.3 (1.4) | 81.1 (2.8) | ||
| 28 | 79.0 (1.5) | 83.8 (0.7) | 83.0 (1.2) | 81.0 (0.9) | 77.8 (2.4) | 84.7 (0.8) | 85.9 (0.5) | 83.2 (0.8) | 83.5 (1.5) | ||
| 34 | 79.8 (1.0) | 85.6 (0.8) | 84.3 (0.9) | 83.0 (1.2) | 78.1 (2.0) | 85.7 (0.8) | 85.8 (0.6) | 85.3 (0.8) | 84.6 (1.4) | ||
| 40 | 81.1 (1.4) | 85.2 (0.9) | 84.9 (1.0) | 83.5 (0.9) | 79.3 (1.8) | 84.8 (1.0) | 85.2 (1.3) | 85.2 (0.5) | 85.2 (1.4) | ||
| BRID | 4 | 83.9 (4.4) | 91.0 (2.2) | 88.7 (3.8) | 81.8 (3.3) | 66.7 (8.2) | 86.0 (2.7) | 76.3 (9.5) | 75.0 (4.1) | 72.7 (8.4) | |
| 6 | 75.9 (5.3) | 90.9 (2.8) | 89.2 (4.2) | 86.7 (1.7) | 72.5 (4.9) | 88.2 (5.7) | 82.9 (3.4) | 84.2 (4.6) | 76.3 (8.3) | ||
| 8 | 81.4 (5.0) | 89.9 (3.8) | 89.6 (3.0) | 90.6 (2.1) | 87.4 (3.1) | 82.8 (4.3) | 89.4 (2.4) | 91.2 (1.9) | 78.2 (8.4) | ||
| 10 | 84.3 (4.6) | 93.7 (1.9) | 94.9 (1.4) | 89.1 (1.2) | 79.6 (3.7) | 91.3 (2.5) | 89.2 (2.6) | 94.3 (1.7) | 82.7 (8.7) | ||
| 12 | 90.5 (1.7) | 93.3 (1.7) | 94.0 (6.0) | 91.0 (1.7) | 80.7 (4.7) | 89.6 (4.8) | 90.7 (2.6) | 94.1 (1.5) | 85.5 (6.9) | ||
| 14 | 87.9 (2.3) | 92.7 (2.0) | 94.1 (1.9) | 91.2 (1.4) | 80.7 (3.3) | 91.4 (3.2) | 91.5 (2.2) | 95.8 (1.1) | 89.3 (4.7) | ||
| Candombe | 4 | 81.2 (7.4) | 91.6 (2.5) | 82.8 (3.7) | 90.3 (2.5) | 89.5 (2.8) | 90.5 (4.5) | 94.9 (0.8) | 93.7 (1.1) | 94.0 (3.7) | |
| 6 | 83.7 (13.7) | 95.2 (2.6) | 91.7 (1.7) | 93.2 (1.8) | 90.3 (2.4) | 96.4 (0.6) | 95.1 (0.7) | 95.7 (1.0) | 95.0 (1.8) | ||
| 8 | 97.0 (1.3) | 96.1 (1.7) | 92.5 (1.9) | 92.5 (1.0) | 94.6 (2.6) | 96.0 (0.7) | 95.2 (0.8) | 96.0 (0.7) | 95.2 (1.5) | ||
| 10 | 98.2 (1.2) | 96.5 (1.2) | 94.4 (1.5) | 93.0 (0.7) | 96.8 (0.7) | 96.2 (0.6) | 96.3 (0.5) | 96.0 (0.8) | 95.9 (1.7) | ||
| 12 | 99.0 (0.3) | 95.4 (2.6) | 96.8 (1.0) | 93.8 (0.9) | 98.2 (0.7) | 96.1 (0.6) | 96.3 (0.6) | 96.1 (0.6) | 96.5 (1.5) | ||
| 14 | 99.2 (0.2) | 98.8 (0.1) | 97.1 (1.0) | 93.8 (0.5) | 98.4 (0.4) | 96.1 (0.6) | 96.2 (0.5) | 96.1 (0.5) | 96.8 (1.5) | ||