
Table 1
Summary of existing symbolic datasets of popular music.
| Dataset Name | Summary | Contents | Available Metadata | Manually Created/Reviewed? |
|---|---|---|---|---|
| BiMMuDa | Melodic transcriptions of the top five songs on the Billboard year-end singles chart from 1950 to 2022 | 1,133 single-track MIDI files and 371 MuseScore files | Extensive metadata per song and song section | Yes |
| POP909 | Transcriptions of popular Chinese songs | 909 multitrack MIDI files and annotations | Song title, artist, and key signature information | Yes |
| Lakh MIDI | 170k files scraped from the Internet | 176,581 multitrack MIDI files | No consistent metadata | No |
| RWC | 80 original songs in the style of Japanese popular music, plus 20 songs in the style of Western popular music | 100 multitrack MIDI files | Song title and length, artist, tempo, and instrumentation | Yes |
| CoCoPops | Melodic transcriptions of a random sample of the Billboard Hot 100 from 1960 to 2010 | 200 HumDrum files (project still ongoing) | Song title, artist, and year | Yes |
Table 2
BiMMuDa and CoCoPops transcription differences.
| Song ID | Title | Artist | Dissimilarity Value | Transcription Differences |
|---|---|---|---|---|
| 1959_01 | The Battle of New Orleans | Johnny Horton | 4.4 | The song’s swing is encoded in BiMMuDa transcription but not CoCoPops’. Disagreements on pitches in bar five of the verse and at the end of melodic phrases in the chorus and bridge. |
| 1963_04 | He’s So Fine | The Chiffons | 5.3 | CoCoPops includes more rhythmic and pitch detail in the final bars of the verse. Disagreement on pitches in bar fifteen, beat one of the chorus. |
| 1964_03 | Hello, Dolly! | Louis Armstrong | 3.3 | The vocals have very expressive timing, leading to different interpretations of the rhythms. |
| 1968_04 | (Sittin’ On) The Dock of the Bay | Otis Redding | 4.3 | CoCoPops includes more pitch detail in the verse. |
| 1969_04 | Honky Tonk Women | The Rolling Stones | 1.7 | Occasional pitch disagreements throughout. The CoCoPops transcription tends towards accidentals when the vocals are slightly flat. |
| 1970_05 | War | Edwin Starr | 2.9 | BiMMuDa leaves out the vocalist’s adlibs between the main phrases, while CoCoPops includes them. |
| 1973_05 | My Love | Paul McCartney and Wings | 4.5 | The two transcriptions have different interpretations of the expressive timing in the bridge. |
| 1978_01 | Shadow Dancing | Andy Gibb | 4.7 | Good agreement throughout, besides small differences in the repetitions of sections. |
| 1980_02 | Another Brick in the Wall, Part II | Pink Floyd | 6.4 | The pitches in BiMMuDa transcription are one octave higher than those in the CoCoPops transcription. |
| 1983_05 | Beat It | Michael Jackson | 4.0 | Main melody identification disagreements at the end of the chorus. |
| 1984_02 | What’s Love Got to Do With It | Tina Turner | 7.3 | CoCoPops’ transcription includes much more pitch detail in the verse and chorus. |
| 1985_03 | Wake Me Up Before You Go-Go | Wham! | 4.3 | BiMMuDa transcription encodes the swing, while CoCoPops does not. |
| 1988_03 | Got My Mind Set On You | George Harrison | 3.9 | Slightly different interpretations of the rhythms throughout; CoCoPops tends towards triplets while BiMMuDa uses an eighth note followed by two sixteenth notes. |
| 1990_01 | Hold On | Wilson Phillips | 3.2 | Good agreement throughout, besides small differences in the repetitions of sections. |
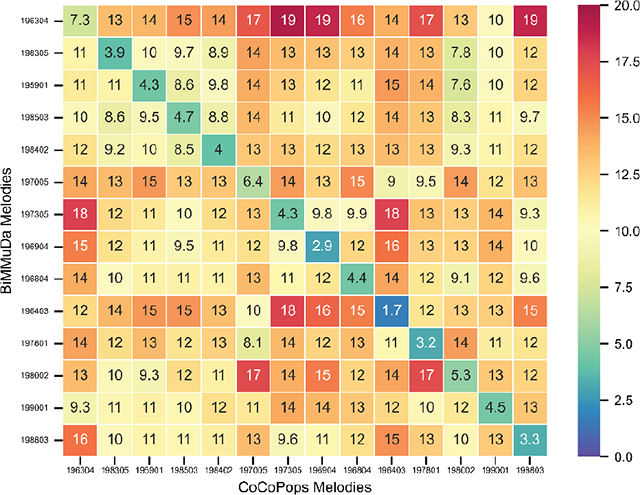
Figure 1
Dissimilarity matrix between BiMMuDa and CoCoPops transcriptions.
Table 3
Number of songs, melodies, minutes, and note events in BiMMuDa, per decade and in total.
| Subset | Songs | Melodies | Minutes | Note Events |
|---|---|---|---|---|
| 1950–1959 | 52 | 129 | 53.59 | 5,342 |
| 1960–1969 | 50 | 128 | 47.43 | 4,883 |
| 1970–1979 | 52 | 158 | 62.14 | 6,956 |
| 1980–1989 | 50 | 152 | 54.50 | 6,485 |
| 1990–1999 | 52 | 149 | 59.56 | 6,885 |
| 2000–2009 | 50 | 185 | 70.08 | 11,115 |
| 2010–2022 | 65 | 232 | 80.78 | 13,562 |
| Total | 371 | 1133 | 428.08 | 55,258 |
Table 4
Description of attributes per song in BiMMuDa.
| Attribute | Description |
|---|---|
| Title | Title of the song |
| Artist | Artist(s), including any featured artists |
| Year | Year in which the song appeared in the top five of the Billboard year-end singles chart |
| Position | Song’s position on the Billboard year-end singles chart |
| Tempo one–three | Tempo of the song in beats per minute, as estimated by Tunebat. BPM one is the starting tempo, while BPMs two and three account for up to two tempo changes. |
| Link to Audio | Spotify or YouTube link to the song |
| Tonics one–six | Tonic of the song, as estimated by Tunebat. Tonic one is the tonic at the beginning of the song, while Tonics two–six account for up to five key changes. |
| Modes one–six | Mode (major/minor), as estimated by Tunebat. Mode one is the mode at the beginning of the song, while Modes two–six account for up to five mode changes. |
| Number of Parts | Number of melodies in the song |
| Number of Words | Number of words in the lyrics file, including repeated words and sections |
| Number of Unique Words | Number of unique words in the lyrics file |
| Unique Word Ratio | Number of unique words in the lyrics divided by the total number of words |
| Number of Syllables | Number of syllables in the lyrics file |
Table 5
Summary statistics for BiMMuDa per-song attributes.
| Attribute | Mean | Median | Std Dev. | Range |
|---|---|---|---|---|
| Number of Parts | 3.12 | 3.00 | 1.13 | 0–8 |
| Tempo one | 105.72 | 104.00 | 24.76 | 57–174 |
| Number of Words | 335.49 | 303.00 | 169.59 | 12–896 |
| Number of Unique Words | 104.25 | 93.00 | 47.10 | 11–312 |
| Unique Word Ratio | 0.35 | 0.33 | 0.12 | 0.10–1.00 |
| Number of Syllables | 413.17 | 372.00 | 208.58 | 57–174 |
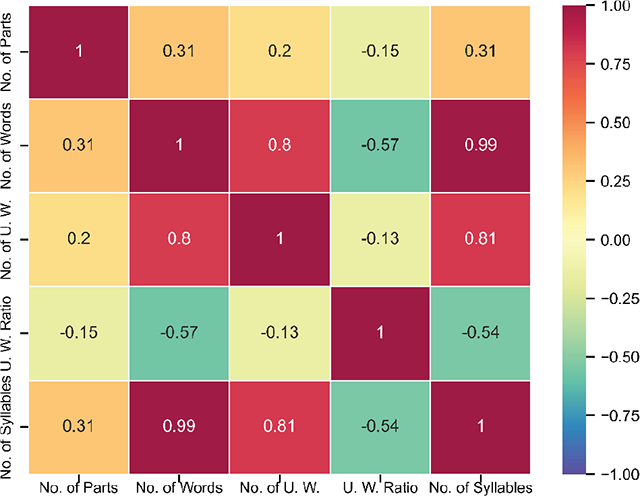
Figure 2
Correlation matrix for per-song attributes.
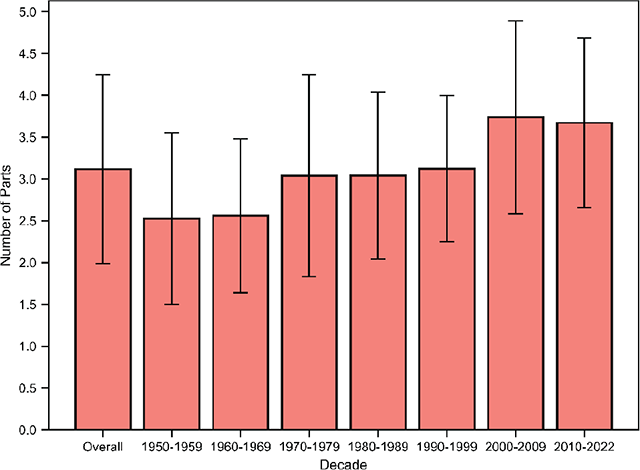
Figure 3
Mean number of melodies per song, overall and by decade, with error bars denoting standard deviations.
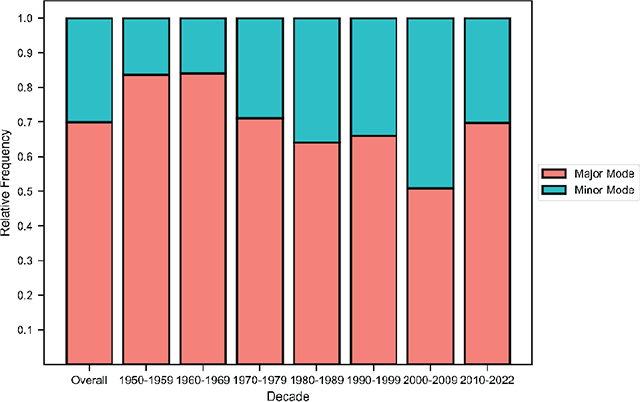
Figure 4
Frequency of major and minor modes by decade.
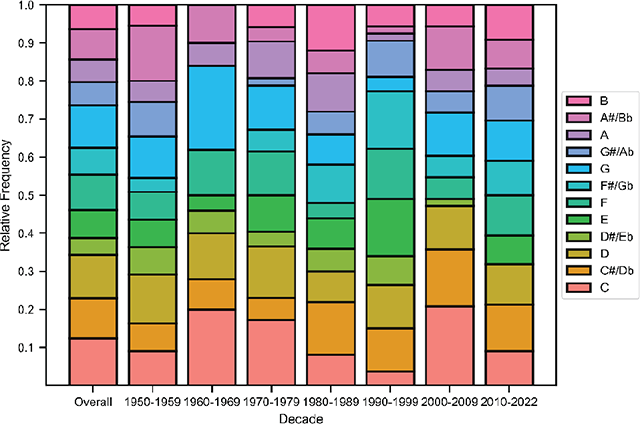
Figure 5
Distribution of tonics, overall and by decade.
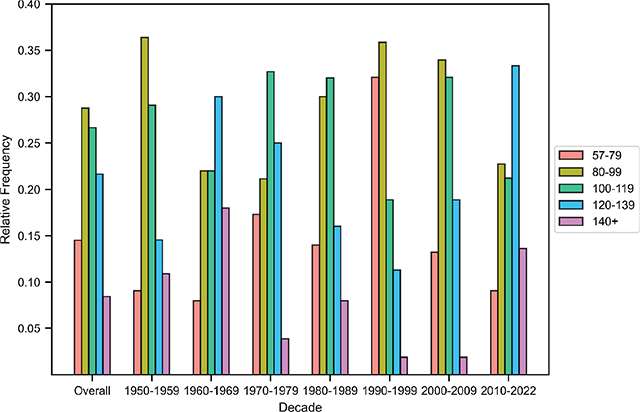
Figure 6
Distribution of tempos (BPM), overall and by decade.
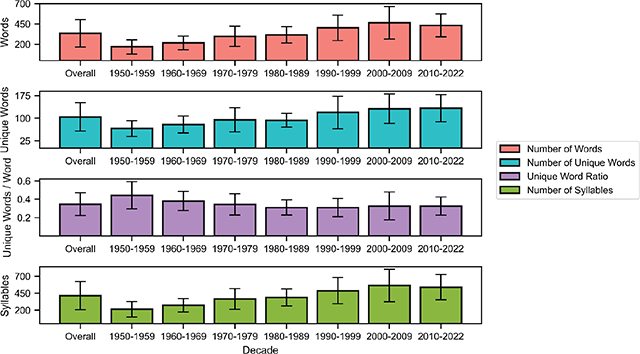
Figure 7
Means of the Number of Words, Number of Unique Words, Unique Word Ratio, and Number of Syllables attributes, overall and per decade, with error bars denoting standard deviation.
Table 6
Attribute descriptors per melody in BiMMuDa.
| Attribute | Description |
|---|---|
| ID | Unique identifier and filename of melody (e.g., “1960_01_1”) |
| Length | Length of the MIDI file in seconds |
| Number of Note Events | Number of Note Events in the melody |
| Section Label | The melody’s function regarding the global structure of the song (e.g., verse, chorus) |
| Tonality | Degree of conformity to one of the 24 keys in Western music, as determined by the Krumhansl-Schmuckler key-finding algorithm (Krumhansl, 1990). The algorithm outputs the key most highly correlated with the melody, with the correlation coefficient representing the degree of conformity to the key. |
| Melodic Information Content (MIC) | Information-theoretic unpredictability of the melody’s pitches according to a probabilistic model of auditory expectation (Pearce, 2018, 2005). Information content values of pitches are computed step-wise and then averaged. |
| Melodic Interval Size (MIS) | Average distance in semitones between consecutive pitches |
| Pitch STD | Standard deviation of the melody’s pitches |
| Onset Density | Average number of notes per second |
| Normalized Pairwise Variability Index (nPVI) | Durational contrast between consecutive notes (Patel and Daniele, 2003) |
| Rhythmic Information Content (RIC) | Information-theoretic unpredictability of the melody’s rhythmic structure according to the model of Pearce (2018, 2005). Information content values of onset times are computed step-wise and then averaged. |
Table 7
Summary statistics for BiMMuDa per-melody attributes.
| Attribute | Mean | Median | Std. Dev | Range |
|---|---|---|---|---|
| Length | 22.68 | 20.71 | 9.67 | 2.29–65.26 |
| Number of Note Events | 48.74 | 44 | 24.14 | 4–168 |
| Tonality | 0.73 | 0.75 | 0.10 | 0.41–0.98 |
| MIC | 3.54 | 3.49 | 0.99 | 0.28–6.04 |
| Pitch STD | 2.99 | 2.87 | 1.14 | 0.00–9.72 |
| MIS | 2.11 | 2.09 | 0.84 | 0.00–0.85 |
| Onset Density | 2.25 | 2.13 | 0.84 | 0.44–5.69 |
| nPVI | 40.71 | 39.21 | 19.79 | 0.00–128.74 |
| RIC | 2.23 | 2.16 | 0.75 | 0.23–7.06 |
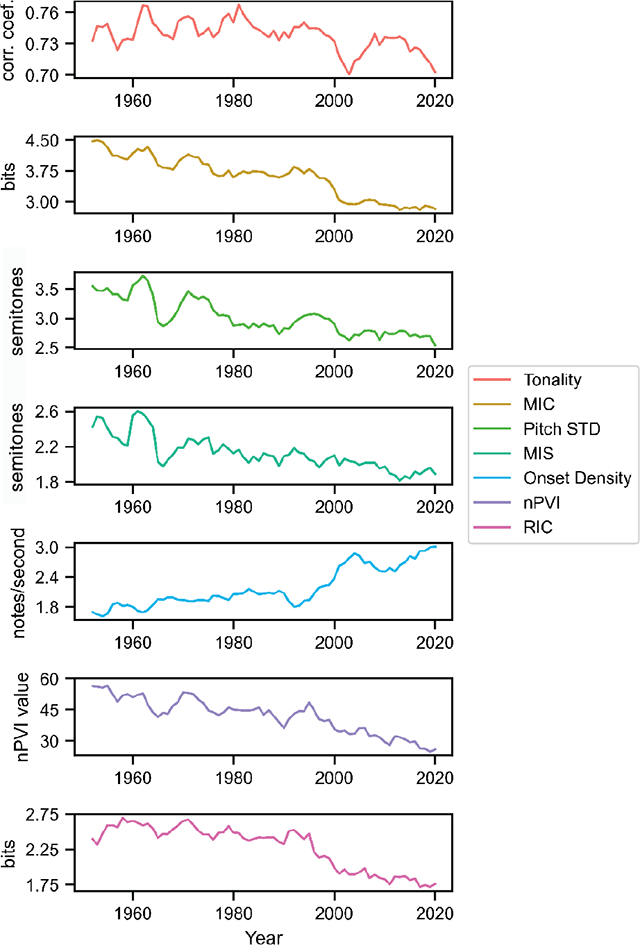
Figure 8
Annual averages of per-melody attributes. The time series are smoothed with a two-forward, two-backward averaging window to make trends more visible, so there are no values for the years 1950, 1951, 2020, and 2021.
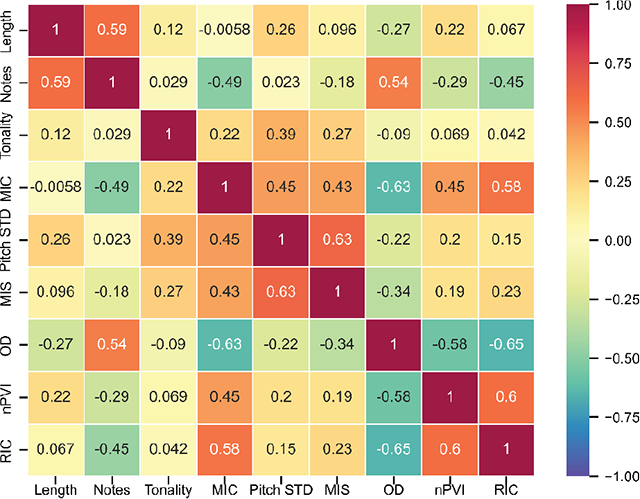
Figure 9
Correlation matrix for per-melody attributes.
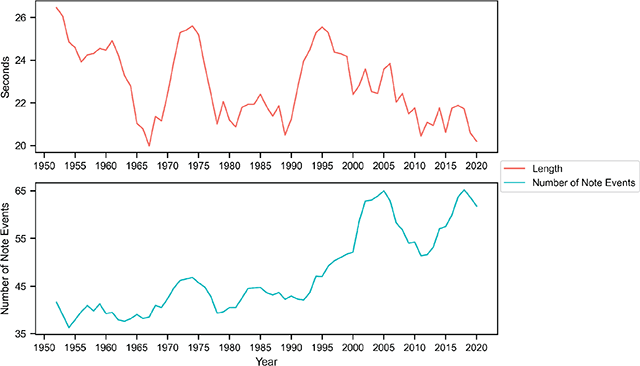
Figure 10
Annual averages of the Length and Number of Note Events attributes. The time series are processed the same way as in Figure 8.
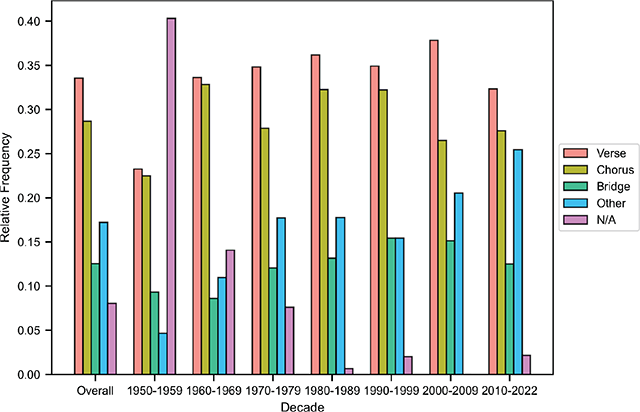
Figure 11
Distribution of section labels, overall and per decade. The labels Pre-Chorus, Post-Chorus, Outro, Intro, Break, and Hook are aggregated into the Other category due to their relatively low frequencies.