
1. Introduction
The Billboard Melodic Music Dataset (BiMMuDa)1 is a collection of MIDI files representing the main melodies of top five Billboard year-end singles from 1950 to 2022. This paper describes the compilation, structure, and attributes of the dataset in detail. We first explain the motivation behind BiMMuDa’s compilation and choosing the Billboard year-end singles charts as the delimiter of its scope. The Methods section explains the compilation process, which includes, for each song, identifying which instrument carries the main melody, transcribing the main melody in full, segmenting the transcription according to the song’s structure, and recording metadata. Section 3 reports the procedure for quality assurance, which involves quantitatively and qualitatively comparing the overlapping transcriptions of BiMMuDa with a related dataset. The Summary Statistics section provides summary statistics and graphical representations of BiMMuDa’s attributes. We then present an example analysis using the dataset, examining the structural differences between the verse and chorus melodies in BiMMuDa in Section 5. The potential applications of the dataset are discussed in Section 6, and the final section contains the conclusions.
1.1 Motivation
The primary motivation for compiling BiMMuDa was to create a high-quality dataset of Western pop melodies. Most large MIDI datasets consist only of classical music (Kong et al., 2020; Hawthorne et al., 2019; Dorfer et al., 2018; Müller et al., 2011) or video-game music (Donahue et al., 2018). Existing symbolic datasets of popular music are summarized in Table 1. The existing high-quality datasets, POP909 (Wang et al., 2020) and RWC (Goto et al., 2002) are of non-Western popular music. The most notable MIDI dataset for Western popular music is the Lakh MIDI dataset (Raffel, 2016), a corpus of over 175,000 MIDI files scraped from various websites. However, there are several issues with the Lakh MIDI dataset. Metadata is not consistently available for files, so filtering the dataset by genre, year, or any other criterion is impossible. The quality of MIDI transcription within these datasets is inconsistent, and MIDI files of popular songs likely to be familiar to many are heavily outnumbered by less-familiar music (Ji et al., 2020), which may be an issue if one is attempting to conduct analyses or train models that simulate the experience of the average Western listener. Thus, there is a general lack of high-quality symbolic datasets of Western popular music.
Table 1
Summary of existing symbolic datasets of popular music.
| Dataset Name | Summary | Contents | Available Metadata | Manually Created/Reviewed? |
|---|---|---|---|---|
| BiMMuDa | Melodic transcriptions of the top five songs on the Billboard year-end singles chart from 1950 to 2022 | 1,133 single-track MIDI files and 371 MuseScore files | Extensive metadata per song and song section | Yes |
| POP909 | Transcriptions of popular Chinese songs | 909 multitrack MIDI files and annotations | Song title, artist, and key signature information | Yes |
| Lakh MIDI | 170k files scraped from the Internet | 176,581 multitrack MIDI files | No consistent metadata | No |
| RWC | 80 original songs in the style of Japanese popular music, plus 20 songs in the style of Western popular music | 100 multitrack MIDI files | Song title and length, artist, tempo, and instrumentation | Yes |
| CoCoPops | Melodic transcriptions of a random sample of the Billboard Hot 100 from 1960 to 2010 | 200 HumDrum files (project still ongoing) | Song title, artist, and year | Yes |
To overcome these issues, we compiled BiMMuDa, a dataset of more than 1,000 MIDI melodies from the Billboard top five singles of every year from 1950 to 2022. The MIDI files consist of accurate, manual transcriptions by highly experienced musicians, accompanied by precise metadata (see Section 4). The melodies are from the most popular songs of each year, so the dataset as a whole, or particular time ranges within it, can represent the lifetime melodic exposure of a Western individual. Because the scope of the dataset is well defined, it can easily be extended to create a larger dataset (e.g., by extending to the top ten rather than the top five, covering more years, extracting audio features) or abridged if necessary (e.g., by selecting MIDI files only from songs released during a particular decade). A more detailed discussion of the dataset’s possible applications is presented in Section 6.
1.2 The billboard charts
BiMMuDa is intended to be a compilation of melodies from the five most popular songs of each year, from 1950 to 2022. The Billboard year-end singles chart emerges as the most suitable measure of popularity for two reasons. Firstly, it is the only aggregate measure of song popularity that exists both today and as far back as 1950. Billboard magazine started publishing weekly song-popularity charts in 1940 based on record sales, airplay, and jukebox activity data; in 1946 they began aggregating this weekly data into annual, or year-end, charts (Trust, 2021). Chart positions on the weekly and year-end Billboard charts are still considered the standard measures of a song’s popularity in the United States today. Secondly, Billboard has adjusted its formula for determining chart positions several times over its history to reflect the changing ways music is and can be enjoyed. In the 2000s, their charts started incorporating data on paid digital downloads and streams, and in the 2010s they began including YouTube video streaming data (Molanphy, 2013). This makes the Billboard year-end chart a more comprehensive indicator of popularity than any singular measure of a song’s performance.
However, it must be noted that Billboard’s charts are limited as a measure of popularity. First, the charts consulted for this dataset track year-end popularity only in the United States, which may not be an adequate indicator of global popularity or popularity in other Western countries. Artists and record labels have found ways to manipulate the charts throughout the years (Andrews, 2018). Conversely, Billboard policy has kept some extremely popular songs from ranking highly on the year-end charts or even appearing on them at all. Before 1991, due to how chart positions were calculated, cumulative points for songs released towards the end of the year were often split over two year-ends, causing them to rank lower than they would have if all points were cumulated over a single year. In the 1990s, some songs achieved massive success but were not eligible for Billboard’s year-end singles chart because they were not available for purchase as singles. For example, in 1998 the Goo Goo Dolls’ “Iris” was number one for 18 weeks on Billboard’s Hot 100 Airplay chart but did not appear on the year-end singles chart. These issues must be considered. Nonetheless, Billboard’s singles charts are still the most widespread measure of a song’s popularity in US culture, and the top five year-end singles from each year can provide insight into trends in popular Western music. The list of singles represented in BiMMuDa can be found in the metadata.
2. Methods
The structure of BiMMuDa is as follows: the top level contains folders for each of the 73 years between 1950 and 2022. Each folder contains five more folders labelled 1–5, in decreasing order of chart position. Within each of these folders are the .mid (MIDI) and .mcsz (MuseScore) files containing the transcriptions of the corresponding track.2 If the song has lyrics, these are also included as a .txt file.
It is worth explaining the compilation process,3 which involves: identifying which of one or more instruments carry the main melody of the song, either transcribing the melodies or extracting them from an existing MIDI file, segmenting the transcription according to the song’s structure, and recording the song’s metadata. The details of each step are given below.
2.1 Main melody identification
The vast majority of popular music consists of a salient or main melody accompanied by various supporting melodies, chords, and rhythms. “Main melody identification” in this article refers to the process of determining which instrument of those featured in a song is carrying the song’s main melody. This was the first step of the transcription process for each song in BiMMuDa. For over 95% of the songs, either the entirety of the main melody is sung by a lead vocalist, or a lead vocalist alternates with one or more featured vocalists. There are a few exceptions. Some top singles are orchestral pieces where the main melody is played by one or more instruments and often switches between instruments. For some songs, there is no main melody, and therefore no melody transcription or correction was performed. Lists of songs with non-vocal main melodies and no main melody are provided in the GitHub repository.
If a multitrack MIDI file for the song was available (see Section 2.2), main melody identification simply meant isolating the track corresponding to the lead vocalist’s part. If no MIDI file was available, main melody identification and transcription occurred simultaneously.
Main melody identification can be a source of error for several reasons. First, sometimes there are two equally salient melodies playing simultaneously (e.g., duets). The dataset is strictly monophonic, so in these cases the melody that began first was selected as the main melody. Often the end of the main melody of one section in a song overlaps with the beginning of the main melody of the next section. In these cases, the melodies had to be clipped to remove overlap. Finally, vocal harmonies can be very close in volume to the main melody, making the main melody difficult to isolate.
2.2 Melody transcription and correction
Many websites provide free MIDI files of pop songs. These were searched thoroughly before undergoing the transcription process to minimize the amount of manual transcription that would be required to complete the dataset. MIDI files were found for about 90% of the songs, but very few were usable for this project. Many were karaoke MIDIs, so the main melody was not present. Others were type 0 MIDI files in which all voices resided on a single track. It was found that manually transcribing the main melody was faster than attempting to isolate it from such files.
High-quality MIDI files were found for seven of the 371 songs in the dataset. The files and their sources can be found in the GitHub repository. In these files, each instrument or voice corresponded to a single MIDI track, so that those which corresponded to the main melody could be easily extracted. In such cases, after main melody identification it was only necessary to thoroughly check the melodies by comparing the audio of the song with the transcribed melody bar by bar and making corrections as needed. Spotify was used to find the audio for all tracks.
If no high-quality MIDI file for the song was available, the main melodies were manually transcribed via repeated listening of the song. All MIDI files were transcribed and checked using FL Studio 20 and MuseScore. The MIDI files were encoded using Program 0, which is usually mapped to a piano sound on most MIDI playback devices. All velocity values of MIDI notes are normalized to a “medium-loud” value of 85, about two-thirds of the maximum possible velocity value, 127. Minor differences between repetitions of the same section (e.g., repetitions of the verse or chorus; see Section 2.3) are generally disregarded for consistency and for respecting the nature of a symbolic transcription. However, the durations of transitions between melodic sections are accurately represented, as are tempo and key changes, which are annotated via the typical musical notation in the MuseScore files. The full transcriptions have not been aligned with the audio tracks.
2.3 Segmentation
Most popular songs consist of unique sections arranged according to a common format, or song structure. For example, many early-20th-century jazz and pop standards utilized “AABA” form: the first (usually 8-bar) section, or “A” section, is played and then repeated once before the “B” section and a final repetition of the A section (von Appen and Frei-Hauenschild, 2015). Other prevalent song structures in Western popular music include ABAB, AABB, and ABABCB (Watson, 2003). There are also common types of song sections. The A sections are often called verses, whose lyrics advance the narrative the song is conveying. Repetitions of verses usually feature different lyrics, though the melody through which the lyrics are sung typically stays consistent across repetitions (Davidson and Heartwood, 1996). A chorus typically follows the verse, and therefore is often the B section. Some songs have a pre-chorus between the verse and chorus. Choruses contain the central “idea” of the song, both lyrically and musically, and are usually more emotionally intense than verses (Davidson and Heartwood, 1996). There is typically no variation between repetitions of the chorus (Everett, 1999). Pre-choruses normally serve as harmonic transitions between the verses and choruses (Everett, 2009). A bridge usually refers to a section between two repetitions of a chorus that appears later in the song, which is meant to contrast with the verse section (Everett, 1999).
These song structures prevalent in Western popular music, and thus in the music represented in BiMMuDa, provide natural points of segmentation, and partitioning the melodic transcriptions in BiMMuDa using these points greatly expands the applicability of the dataset. Full melodic transcriptions of songs are lengthy, around the same length as the full audio track. While such transcriptions may be ideal for studies of song structure and experiments involving entire pieces of music, there are many cases where shorter melodies are preferable. Most behavioral studies on memory for melody, aesthetic responses to melody, and melodic expectation utilize stimuli less than a minute long (Pearce and Wiggins, 2006; Plantiga and Trainor, 2005; Schmuckler, 1989; Clemente et al., 2020; Gold et al., 2019). Therefore, in addition to providing full melodic transcriptions of the songs in BiMMuDa, it was decided that melodic transcriptions of the distinct sections of each song would also be copied and exported into separate files after the full transcription was created. For a song in BiMMuDa that follows, for example, an ABABCB structure, a full transcription of the main melody is provided, as well as three files containing transcriptions of the main melody for the A, B, and C sections.
Identifying song structure was mostly a straightfoward endeavor. Section boundaries are usually signaled with very noticeable changes in instrumentation and texture, so song structure usually became apparent during transcription. Lyrics websites such as Genius.com also often correctly segment lyrics according to song structure, so these were checked in cases where song structure did not become clear during transcription. Occasionally, segmentation was subjective: sometimes it was unclear whether one section differs enough from another to be considered unique, and if two short sections always occur together but are very distinct in some way (e.g., they feature different sets of instruments), it must be decided whether to deem them separate sections or combine them. However, with this dataset segmentation difficulties were minimal.
After transcription and correction, the melodies of each section were exported to separate MIDI files according to the identified song structure. The files are named according to the year, chart position, and order in which the section appears in the song. For example, “1965_01_3.mid” contains the main melody of the third section of the number one song in 1965, according to Billboard. The full transcription files contain a “full” suffix. The full transcriptions are encoded in both the MIDI and MuseScore formats.
2.4 Lyrics and metadata
If applicable, lyrics of each song were obtained from free lyrics websites and saved in a .txt file. The lyrics have not been aligned with the transcribed melodies. Metadata is available via two .csv files, one for per song attributes and one for per melody attributes, described in Tables 3 and 6, respectively. Summary statistics for both types of attributes are given in Section 4. Some attributes, such as the song titles, artists, and Spotify links, were created manually during the transcription process. Tunebat.com (https://tunebat.com/) provided intial values for the Tonic, Mode, and BPM attributes that were corrected manually. The remaining attributes were computed automatically. Section labels were assigned according to the guidelines of Gotham et al. (2021). Section labeling can be subjective, and some songs have N/A values.
3. Quality Assurance
The transcriptions in BiMMuDa were thoroughly checked and corrected by the second and third authors of this paper. To further ensure the quality of the dataset, the transcriptions of songs which appear in both BiMMuDa and the Coordinated Corpus of Popular Musics (CoCoPops) dataset were compared. CoCoPops is a corpus of melodies manually transcribed from a random sample of songs from Billboard’s weekly Hot 100 charts spanning from 1960 to 2010 (Arthur and Condit-Schultz, 2023). It is intended to be a “melodic version” of the McGill Billboard Corpus, a dataset of chord annotations from the same set of songs (Burgoyne et al., 2011). Since both datasets include songs on the Billboard charts, there are 14 songs which appear in both CoCoPops and BiMMuDa (see Table 2). Confirming that the transcriptions in this intersection agree with each other can help establish the quality of the transcriptions in BiMMuDa. This was done both quantitatively, by computing the compression distances between the two sets of transcriptions, and qualitatively, by manually examining the pairs of transcriptions side by side and documenting their differences.
Table 2
BiMMuDa and CoCoPops transcription differences.
| Song ID | Title | Artist | Dissimilarity Value | Transcription Differences |
|---|---|---|---|---|
| 1959_01 | The Battle of New Orleans | Johnny Horton | 4.4 | The song’s swing is encoded in BiMMuDa transcription but not CoCoPops’. Disagreements on pitches in bar five of the verse and at the end of melodic phrases in the chorus and bridge. |
| 1963_04 | He’s So Fine | The Chiffons | 5.3 | CoCoPops includes more rhythmic and pitch detail in the final bars of the verse. Disagreement on pitches in bar fifteen, beat one of the chorus. |
| 1964_03 | Hello, Dolly! | Louis Armstrong | 3.3 | The vocals have very expressive timing, leading to different interpretations of the rhythms. |
| 1968_04 | (Sittin’ On) The Dock of the Bay | Otis Redding | 4.3 | CoCoPops includes more pitch detail in the verse. |
| 1969_04 | Honky Tonk Women | The Rolling Stones | 1.7 | Occasional pitch disagreements throughout. The CoCoPops transcription tends towards accidentals when the vocals are slightly flat. |
| 1970_05 | War | Edwin Starr | 2.9 | BiMMuDa leaves out the vocalist’s adlibs between the main phrases, while CoCoPops includes them. |
| 1973_05 | My Love | Paul McCartney and Wings | 4.5 | The two transcriptions have different interpretations of the expressive timing in the bridge. |
| 1978_01 | Shadow Dancing | Andy Gibb | 4.7 | Good agreement throughout, besides small differences in the repetitions of sections. |
| 1980_02 | Another Brick in the Wall, Part II | Pink Floyd | 6.4 | The pitches in BiMMuDa transcription are one octave higher than those in the CoCoPops transcription. |
| 1983_05 | Beat It | Michael Jackson | 4.0 | Main melody identification disagreements at the end of the chorus. |
| 1984_02 | What’s Love Got to Do With It | Tina Turner | 7.3 | CoCoPops’ transcription includes much more pitch detail in the verse and chorus. |
| 1985_03 | Wake Me Up Before You Go-Go | Wham! | 4.3 | BiMMuDa transcription encodes the swing, while CoCoPops does not. |
| 1988_03 | Got My Mind Set On You | George Harrison | 3.9 | Slightly different interpretations of the rhythms throughout; CoCoPops tends towards triplets while BiMMuDa uses an eighth note followed by two sixteenth notes. |
| 1990_01 | Hold On | Wilson Phillips | 3.2 | Good agreement throughout, besides small differences in the repetitions of sections. |
3.1 Measuring compression distances between CoCoPops and BiMMuDa
An unbiased way to compare BiMMuDa and CoCoPops transcriptions is to calculate and examine a quantitative measure of similarity between them. The compression distance method developed by Li et al. (2004) and applied to music by Pearce and Müllensiefen (2017) is employed to this end as a perception-informed way of determining the similarity between two pieces of music. The measure is essentially the predictability of a piece of music according to a statistical model trained on a different piece. The higher the probability of the piece, the more similar the two pieces are, or, equivalently, the fewer operations one must do to transform one piece into the other. Because it closely simulates musical similarity perception between pieces (Pearce and Müllensiefen, 2017), the measure is an appropriate choice for this analysis.
Prior to analysis, some preprocessing of the CoCoPops transcriptions was needed to make them comparable to BiMMuDa transcriptions. While BiMMuDa transcriptions are strictly monophonic, the CoCoPops transcriptions include both supporting and main vocal melodies. Thus, the main melodies had to first be extracted from the CoCoPops files. The dissimilarity measure was computed between every possible pair of transcriptions where there is one transcription from each dataset, yielding values. These are visualized in matrix form in Figure 1. The units are in bits, and lower values indicate that fewer operations are needed to transform one piece into another, so lower values indicate higher similarity. The values can be divided into two groups: the non-diagonal values measure dissimilarity between transcriptions of two different songs, while the diagonal values measure dissimilarity between two transcriptions of the same song. The prominent diagonal of the matrix suggests that the transcription pairs representing the same song agree with each other. This is confirmed by a Student’s two-sample t-test, where the non-diagonal values () were found to be sampled from a different distribution than the diagonal values () with . Therefore, it can be concluded that, at least in the intersecting set of songs, BiMMuDa and CoCoPops transcriptions are perceptually similar.
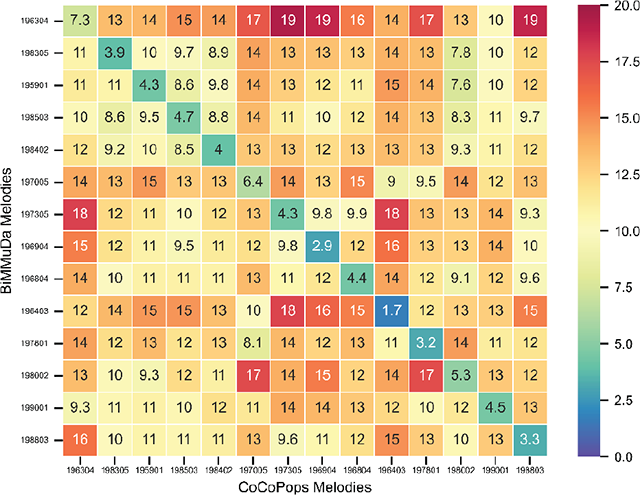
Figure 1
Dissimilarity matrix between BiMMuDa and CoCoPops transcriptions.
3.2 Qualitative comparison
Quantitative analysis indicates that BiMMuDa and CoCoPops transcriptions do not perfectly agree but are highly similar. To establish the source of the disparities, the pairs of transcriptions were examined side by side while listening to the audio. This comparison made clear the general differences in transcription strategy between the two datasets, as well as some song-specific disagreements. One general difference concerns the utilization of song structure (see Section 2.3), specifically the repetition of sections. In BiMMuDa, small differences in the melody between repetitions of the same section (e.g., repetitions of the verse), are not captured: the transcription of the first occurrence of the section is simply copied as needed. In contrast, CoCoPops encodes these small variations, which leads to more disparity between the latter portions of the transcription pairs when sections are repeated. Another difference is that CoCoPops transcriptions are slightly more detailed in their representations of pitch, readily using accidentals when vocalists, for example, sing a note slightly flat or sharp. Meanwhile, BiMMuDa transcriptions are less sensitive to minor deviations from the key’s pitches, since its transcription strategy aims to reflect intended pitches rather than the performed ones. Finally, unlike BiMMuDa, CoCoPops does not explicitly encode swing timing, leading to significant rhythmic differences in the transcriptions of songs with swing.
Most of the discrepancies between BiMMuDa and CoCoPops transcriptions can be explained by the broad differences in the approach to transcription described above. The relevant dissimilarities for each pair of transcriptions, as well as the song-specific disagreements, are reported in Table 2. Overall, the two datasets mostly agree despite different approaches to transcription.
4. Summary Statistics
Table 3 shows the descriptive statistics of BiMMuDa. The dataset’s 1,133 melodies represent just over seven hours of melody and about 55,000 note events. The imbalances between decades are important to note: when aggregated, the top five singles from a year in the 2000s or 2010s have, on average, 18 melodies and 1,000 note events. Meanwhile, the five singles from a year in the 1950s or 1960s have, on average, only about 13 melodies and 500 note events. This suggests that more-recent songs generally have more melodic sections (see Figure 3), which have, in turn, more note events (see Figure 10). Chi-squared tests confirm this observation: the null hypothesis that the number of melodies is uniformly distributed between pre- and post-2000 classes is rejected (), as is the null hypothesis that the Number of Note Events is similarly distributed (). Thus, while it is balanced over time in terms of number of songs, in terms of notes and number of melodies, BiMMuDa is unbalanced in favor of the two most recent decades.
Table 3
Number of songs, melodies, minutes, and note events in BiMMuDa, per decade and in total.
| Subset | Songs | Melodies | Minutes | Note Events |
|---|---|---|---|---|
| 1950–1959 | 52 | 129 | 53.59 | 5,342 |
| 1960–1969 | 50 | 128 | 47.43 | 4,883 |
| 1970–1979 | 52 | 158 | 62.14 | 6,956 |
| 1980–1989 | 50 | 152 | 54.50 | 6,485 |
| 1990–1999 | 52 | 149 | 59.56 | 6,885 |
| 2000–2009 | 50 | 185 | 70.08 | 11,115 |
| 2010–2022 | 65 | 232 | 80.78 | 13,562 |
| Total | 371 | 1133 | 428.08 | 55,258 |
4.1 Attributes per song
Table 4 describes the attributes per song in BiMMuDa, and Table 5 summarizes their descriptive statistics. Their correlation matrix is visualized in Figure 2. The mean number of melodies per song, overall and per decade, is given in Figure 3. The distributions of the Mode and Tonic attributes are visualized in Figures 4 and 5, respectively. Tempo is visualized overall and per decade in Figure 6. Finally, means of the lyrical attributes (Number of Words, Number of Unique Words, Unique Word Ratio, and Number of Syllables) are visualized overall and per decade in Figure 7.
Table 4
Description of attributes per song in BiMMuDa.
| Attribute | Description |
|---|---|
| Title | Title of the song |
| Artist | Artist(s), including any featured artists |
| Year | Year in which the song appeared in the top five of the Billboard year-end singles chart |
| Position | Song’s position on the Billboard year-end singles chart |
| Tempo one–three | Tempo of the song in beats per minute, as estimated by Tunebat. BPM one is the starting tempo, while BPMs two and three account for up to two tempo changes. |
| Link to Audio | Spotify or YouTube link to the song |
| Tonics one–six | Tonic of the song, as estimated by Tunebat. Tonic one is the tonic at the beginning of the song, while Tonics two–six account for up to five key changes. |
| Modes one–six | Mode (major/minor), as estimated by Tunebat. Mode one is the mode at the beginning of the song, while Modes two–six account for up to five mode changes. |
| Number of Parts | Number of melodies in the song |
| Number of Words | Number of words in the lyrics file, including repeated words and sections |
| Number of Unique Words | Number of unique words in the lyrics file |
| Unique Word Ratio | Number of unique words in the lyrics divided by the total number of words |
| Number of Syllables | Number of syllables in the lyrics file |
Table 5
Summary statistics for BiMMuDa per-song attributes.
| Attribute | Mean | Median | Std Dev. | Range |
|---|---|---|---|---|
| Number of Parts | 3.12 | 3.00 | 1.13 | 0–8 |
| Tempo one | 105.72 | 104.00 | 24.76 | 57–174 |
| Number of Words | 335.49 | 303.00 | 169.59 | 12–896 |
| Number of Unique Words | 104.25 | 93.00 | 47.10 | 11–312 |
| Unique Word Ratio | 0.35 | 0.33 | 0.12 | 0.10–1.00 |
| Number of Syllables | 413.17 | 372.00 | 208.58 | 57–174 |
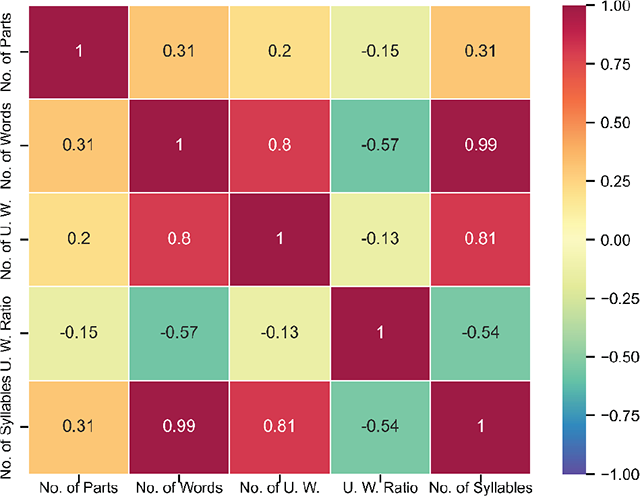
Figure 2
Correlation matrix for per-song attributes.
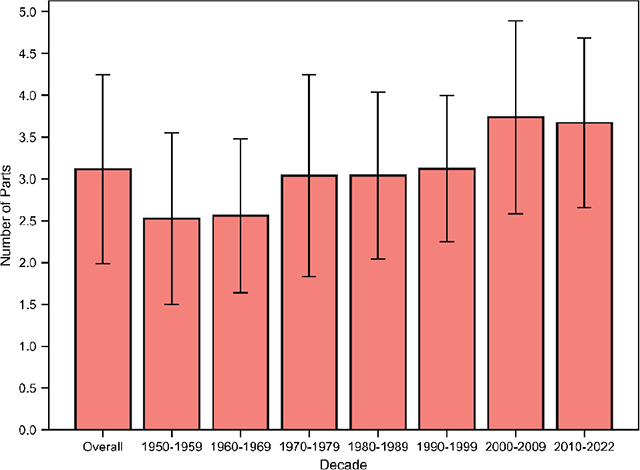
Figure 3
Mean number of melodies per song, overall and by decade, with error bars denoting standard deviations.
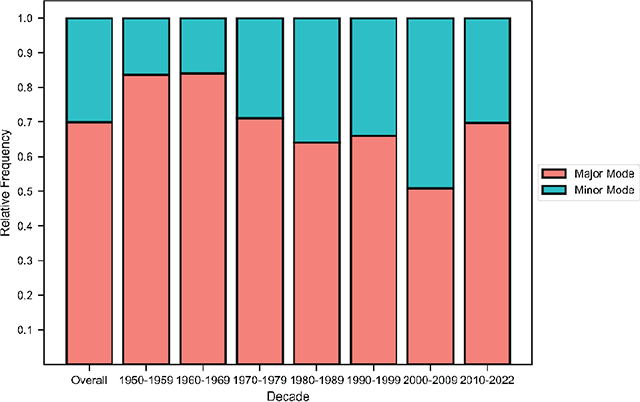
Figure 4
Frequency of major and minor modes by decade.
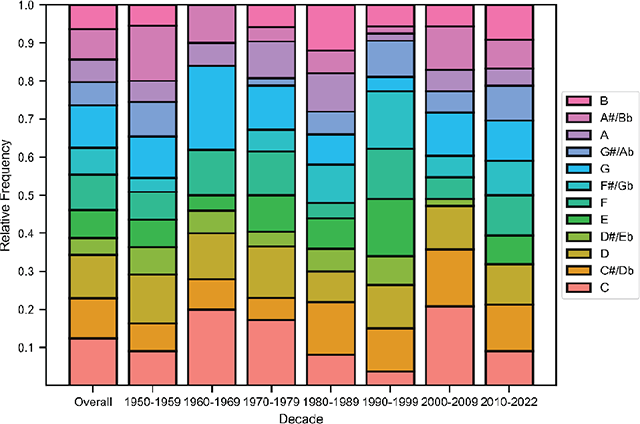
Figure 5
Distribution of tonics, overall and by decade.
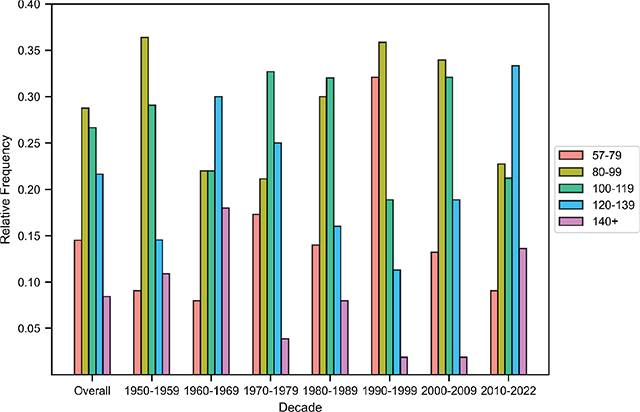
Figure 6
Distribution of tempos (BPM), overall and by decade.
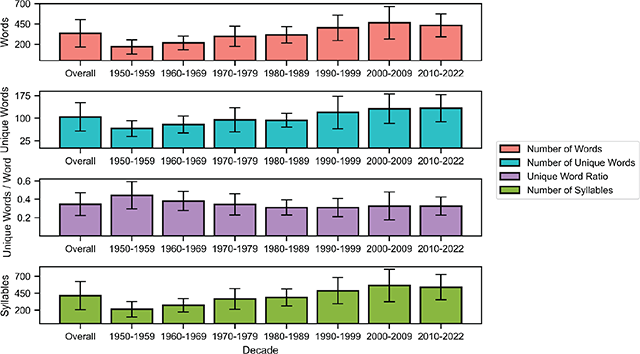
Figure 7
Means of the Number of Words, Number of Unique Words, Unique Word Ratio, and Number of Syllables attributes, overall and per decade, with error bars denoting standard deviation.
Across the entire dataset, a song has about three melodies on average, and about two-thirds of the songs have between two and four melodies. The major mode is more common in every decade, although the difference in frequency between major and minor modes is reduced after the 1960s. The distribution of tonics is relatively flat, with songs in C and G being particularly popular in the 1960s. As for tempo, mean BPM cycles over time: faster songs () are more common in the 1960s and 2010s, while the prevalence of slower songs () peaks in the 1990s. The number of words, unique words, and syllables are doubled in the 2010s as compared with the 1950s, but the number of unique words relative to the total number of words decreases. The correlation matrix suggests that the number of parts is moderately correlated with the number of words and the number of syllables. In other words, songs with more melodic sections have more words and syllables. Number of Words is almost perfectly correlated with Number of Syllables. It is also positively correlated with Number of Unique Words but negatively correlated with Unique Word Ratio, suggesting that songs with more words tend to have a higher absolute number of unique words but a lower proportion of unique words. Finally, Number of Syllables and Number of Unique Words are positively correlated.
4.2 Attributes per melody
Table 6 defines the attributes per melody considered in the present study regarding BiMMuDa, and Table 7 shows their descriptive statistics. Figure 9 reports their pair-wise Pearson correlations. The development of Length and Number of Note Events is plotted in Figure 10, and the distribution of song sections is reported per decade and overall in Figure 11. The remaining attributes per melody are visualized in Figure 8.
Table 6
Attribute descriptors per melody in BiMMuDa.
| Attribute | Description |
|---|---|
| ID | Unique identifier and filename of melody (e.g., “1960_01_1”) |
| Length | Length of the MIDI file in seconds |
| Number of Note Events | Number of Note Events in the melody |
| Section Label | The melody’s function regarding the global structure of the song (e.g., verse, chorus) |
| Tonality | Degree of conformity to one of the 24 keys in Western music, as determined by the Krumhansl-Schmuckler key-finding algorithm (Krumhansl, 1990). The algorithm outputs the key most highly correlated with the melody, with the correlation coefficient representing the degree of conformity to the key. |
| Melodic Information Content (MIC) | Information-theoretic unpredictability of the melody’s pitches according to a probabilistic model of auditory expectation (Pearce, 2018, 2005). Information content values of pitches are computed step-wise and then averaged. |
| Melodic Interval Size (MIS) | Average distance in semitones between consecutive pitches |
| Pitch STD | Standard deviation of the melody’s pitches |
| Onset Density | Average number of notes per second |
| Normalized Pairwise Variability Index (nPVI) | Durational contrast between consecutive notes (Patel and Daniele, 2003) |
| Rhythmic Information Content (RIC) | Information-theoretic unpredictability of the melody’s rhythmic structure according to the model of Pearce (2018, 2005). Information content values of onset times are computed step-wise and then averaged. |
Table 7
Summary statistics for BiMMuDa per-melody attributes.
| Attribute | Mean | Median | Std. Dev | Range |
|---|---|---|---|---|
| Length | 22.68 | 20.71 | 9.67 | 2.29–65.26 |
| Number of Note Events | 48.74 | 44 | 24.14 | 4–168 |
| Tonality | 0.73 | 0.75 | 0.10 | 0.41–0.98 |
| MIC | 3.54 | 3.49 | 0.99 | 0.28–6.04 |
| Pitch STD | 2.99 | 2.87 | 1.14 | 0.00–9.72 |
| MIS | 2.11 | 2.09 | 0.84 | 0.00–0.85 |
| Onset Density | 2.25 | 2.13 | 0.84 | 0.44–5.69 |
| nPVI | 40.71 | 39.21 | 19.79 | 0.00–128.74 |
| RIC | 2.23 | 2.16 | 0.75 | 0.23–7.06 |
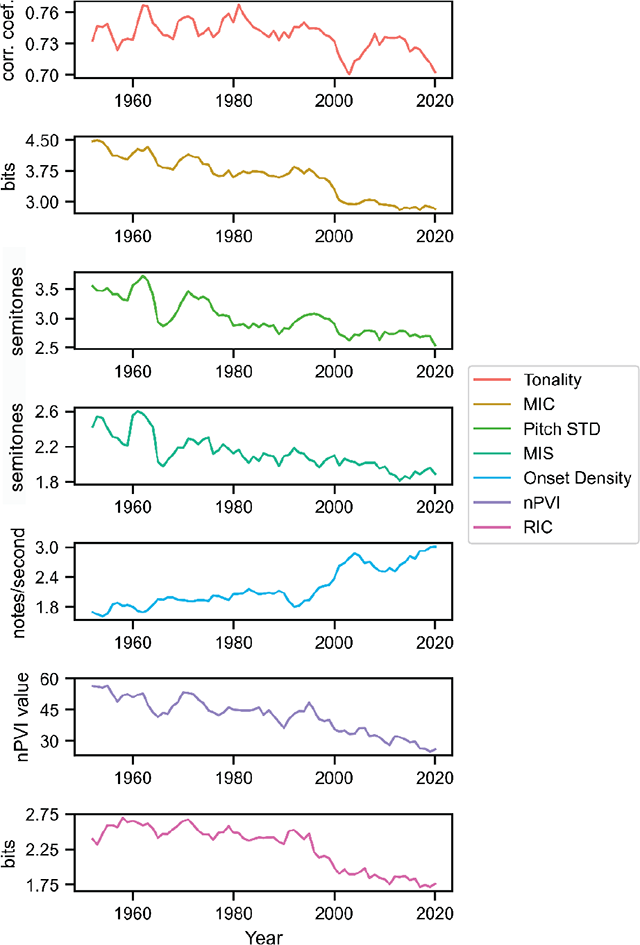
Figure 8
Annual averages of per-melody attributes. The time series are smoothed with a two-forward, two-backward averaging window to make trends more visible, so there are no values for the years 1950, 1951, 2020, and 2021.
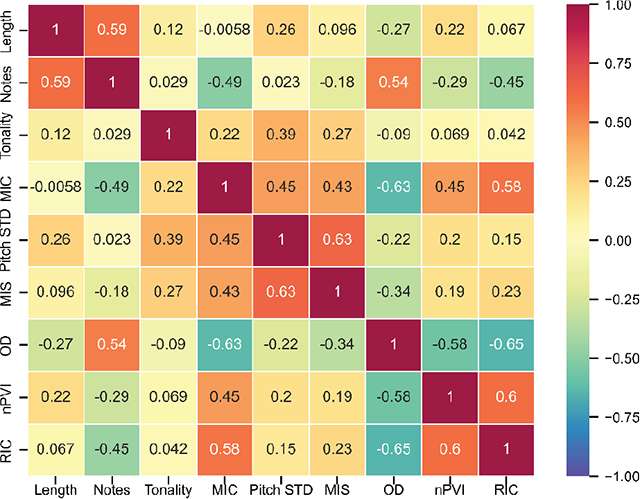
Figure 9
Correlation matrix for per-melody attributes.
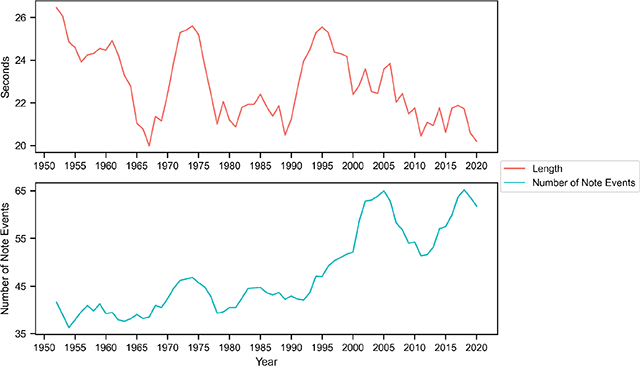
Figure 10
Annual averages of the Length and Number of Note Events attributes. The time series are processed the same way as in Figure 8.
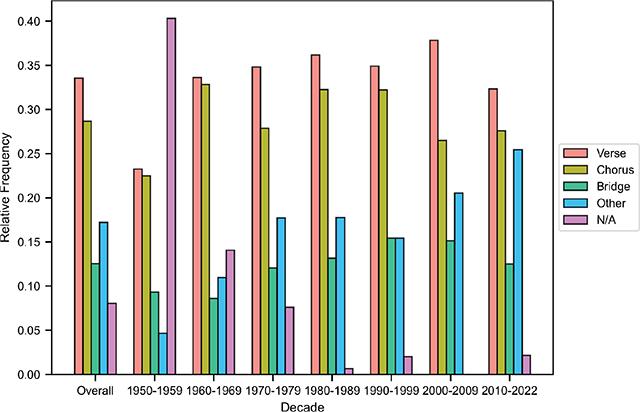
Figure 11
Distribution of section labels, overall and per decade. The labels Pre-Chorus, Post-Chorus, Outro, Intro, Break, and Hook are aggregated into the Other category due to their relatively low frequencies.
Overall, BiMMuDa melodies are about 23 seconds long and contain about 49 note events. Melody length cycles approximately every two decades, with local maxima in the early 1950s, the mid-1970s, and the mid-1990s, and local minima in the mid-1960s, the 1980s, and the 2010s. In contrast, the mean Number of Note Events per year nearly doubles around the year 2000.
Figure 11 shows that verses are the most common type of melody in the dataset. The vast majority of songs contain both a verse and a chorus, but it is more likely for a song to have more than one unique verse than it is for a song to have more than one unique chorus, hence the higher prevalence of verse melodies. N/A values are assigned to melodies in songs that do not have the typical verse-chorus structure (e.g., orchestral pieces and ballads), which are most prevalent in the 1950s. Finally, melodies in the “Other” category, which include intros, outros, pre-choruses, post-choruses, hooks, and breaks, appear more often in more recent songs. We analyze this attribute in more detail in the next section.
5. Analysis: Structural Differences between Verse and Chorus Melodies
To illustrate BiMMuDa’s usefulness for research on pop melody, we analyzed the Section Label attribute to study differences between verse and chorus melodies. Often when listening to pop music, verses and choruses are easily distinguishable. The verse is normally the first core section in a song, with quiet accompanying instrumentation and lyrics that vary between appearances, while choruses are lyric-invariant and attribute more intense instrumentation (Gotham et al., 2021). However, in this analysis, we ask: do verses and choruses differ specifically in terms of melodic attributes? That is, can verse and chorus melodies still be distinguished when stripped of features such as dynamics, lyrics, and instrumentation? This is a question that can be answered with BiMMuDa, if structural attributes of the verse and chorus melodies are compared.
To answer the research question, we performed two-sample Student’s t-tests between each per-melody attribute (see Table 8) of the 380 verse melodies and 325 chorus melodies in BiMMuDa to test for significant differences in attribute means. We found significant differences regarding four out of the nine attributes. On average, chorus melodies are approximately 2.5 seconds shorter than verse melodies, contain 10 fewer note events, and have about 0.25 fewer note events per second. However, the average melodic interval in the chorus melodies is 0.15 semitones larger than in the verses.
Table 8
Results of t-tests between attributes per melody of verses and choruses.
| Attribute | Mean (Verses) | Mean (Choruses) | p-value |
|---|---|---|---|
| Length | 24.69 | 22.28 | |
| No. of Note Events | 56.36 | 46.90 | |
| Tonality | 0.75 | 0.73 | 0.061 |
| MIC | 3.48 | 3.52 | 0.61 |
| Pitch STD | 2.97 | 2.96 | 0.90 |
| MIS | 2.02 | 2.15 | |
| Onset Density | 2.38 | 2.15 | |
| nPVI | 39.68 | 40.86 | 0.41 |
| RIC | 2.21 | 2.24 | 0.69 |
Thus, the results suggest that verse and chorus melodies in pop music do possess some structural differences: choruses have fewer note events and note events per second but have larger melodic intervals. This may explain why the chorus tends to be the catchiest part of a song, as well as the most easily remembered. Their relatively shorter lengths and smaller note counts may make them easier to remember, and perhaps chorus melodies are more salient than verse melodies because of their larger melodic intervals.
6. Potential Applications
The value of any dataset lies in its potential applications. The scope, quality, and format of BiMMuDa make it useful for music informatics, music cognition, and historical musicology alike. The possible applications within these three fields are discussed below.
In music informatics, BiMMuDa could help ease one of the field’s major challenges, which is a lack of ground truth data. Many problems within music informatics, such as automatic music transcription (AMT) and automatic melody extraction, require ground truth data to evaluate model accuracy. The scarcity and lack of variety of such data, as Benetos et al. (2019) point out in their review of AMT methods, severely limit the applicability of otherwise powerful techniques. Because the vast majority of ground truth datasets available for AMT algorithms are of Western classical piano music, even the state-of-the-art methods work well only for piano transcription. Similar problems hinder progress in automatic melody extraction (Salamon and Urbano, 2012). Creating more robust models requires more diverse training and ground truth datasets. While BiMMuDa is not large enough on its own for training models, which are often complex deep learning architectures that need massive datasets, it provides a useful starting point that could be employed as a held-out test set. When combined with other datasets, BiMMuDa could help represent ground truth for vocal transcription and vocal melody extraction tasks (though the scores would first have to be aligned with the audio), as well as enlarge training sets for unsupervised tasks such as automatic music generation.
BiMMuDa could also be valuable in music cognition and perception, both as a representation of Western melodic exposure and as a stimulus set for behavioral experiments. Many important processes in music cognition are governed by statistical learning: listeners unconsciously construct and update internal models of music in which the probabilities of musical events are determined by how often the listener hears them during everyday exposure to music (Pearce, 2018). Computational modelling of this phenomenon is indispensable, as it aids understanding of musical expectations (Pearce and Wiggins, 2006; Bigand et al., 2003; Palmer and Krumhansl, 1990; Sears et al., 2019), sequential segmentation (Tillmann and McAdams, 2004; Saffran et al., 1999), recognition memory (Agres et al., 2018; Bartlett and Dowling, 1980; Cuddy and Lyons, 1981), and music-induced emotion (Egermann et al., 2013; Gingras et al., 2016). Since internal psychological models of music are derived from past exposure, such a computational model’s training data should encapsulate the individual’s cumulative experience with music for successful replication. For the average Western listener’s experience with melody in particular, BiMMuDa could serve as a much more realistic representation than the current training datasets, which are mostly of classical and folk music. This, in turn, would improve the quality of insights gained from music cognition studies that utilize computational modelling.
Additionally, BiMMuDa’s melodies would make good stimuli for a wide variety of behavioral experiments on melody perception. The segmented melodies could be used for experiments requiring shorter stimuli, while experiments involving entire pieces of music can use BiMMuDa’s full scores. BiMMuDa would be especially appropriate for experiments on aesthetic responses to music; since the melodies are from extremely popular songs, aesthetic responses to these melodies from participants might be more genuine than those elicited by classical or folk stimuli. The fact that the melodies in BiMMuDa may be recognized by participants, or even linked to their autobiographical memories, is also advantageous. Existing studies on music-evoked autobiographical memories and the emotions those memories induce, such as those of Janata et al. (2007) and Barrett et al. (2010), simply use excerpts from the audio of popular songs as stimuli. If BiMMuDa’s melodies were used as stimuli in addition to their corresponding audio excerpts, one could answer questions related to melody’s specific role in music-elicited memory recolection and emotion. For example, how well can the vocal melodies from popular songs evoke autobiographical memories and emotions compared to the lyrics or the full audio? More broadly, BiMMuDa could be used to disentangle the cognitive and emotional effects of a song’s melody, which is often the most perceptually salient dimension of a song, from the effects of the song’s other musical elements, producing more insight for the field as a whole.
Finally, BiMMuDa can be considered a record of pop music history and analyzed as such. Most historical studies of popular music are qualitative and example-based (Adorno, 1941; Middleton, 1990; Shuker, 2013; Negus, 1997; Stanley, 2013). Quantitative studies on the topic began only in the last 15 years, and all have been undertaken using either features extracted from audio excerpts (Mauch et al., 2015; Serrà et al., 2012; Deruty and Pachet, 2015; Lambert et al., 2020; Interiano et al., 2018) or lyrics in textual form (Brand et al., 2019; Dodds and Danforth, 2010). With scores and MIDI melodies from every year since 1950, BiMMuDa could easily solve the scarcity of quantitative studies that analyze symbolic representations of popular music. This would offer very different perspectives from the previous studies, since aspects of music that are difficult to extract accurately from audio, such as onset times and exact pitch structure, are encoded explicitly in symbolic representations of music. BiMMuDa would also allow for the first melody-specific quantitative study on popular music evolution. Thus, in addition to aiding the development of future music technology and collective knowledge of music perception, BiMMuDa could also facilitate the creation of a more comprehensive narrative of how the most-popular music has evolved over time.
7. Conclusion
We compiled BiMMuDa with the purpose of addressing quality issues with the current pop MIDI datasets. This paper shows efforts towards accurate transcription and detailed metadata for a dataset of pop melodies and illustrates its application in studying pop melody by comparing verse and chorus melodies. We hope that BiMMuDa will substantially contribute to the fields of music cognition, historical musicology, and music informatics.
Supplementary Material
Notes
[2] There are exceptions to this: for some songs, it was determined that no main melody existed as there were no vocal melodies or other perceptually prominent melody, and thus the folders corresponding to those songs are empty. Conversely, some year-end top singles required two folders because they are double-sided (see the dataset’s GitHub repository for the lists of such singles).
Acknowledgements
Madeline Hamilton is supported by the UKRI Centre for Doctoral Training in Artificial Intelligence and Music (AIM) (EP/S022694/1). Ana Clemente is supported by the Spanish Ministry of Universities, within the framework of the Recovery, Transformation and Resilience Plan, and funded by the European Union (NextGenerationEU) with the participation of the University of the Balearic Islands.
Competing Interests
The authors have no competing interests to declare.