
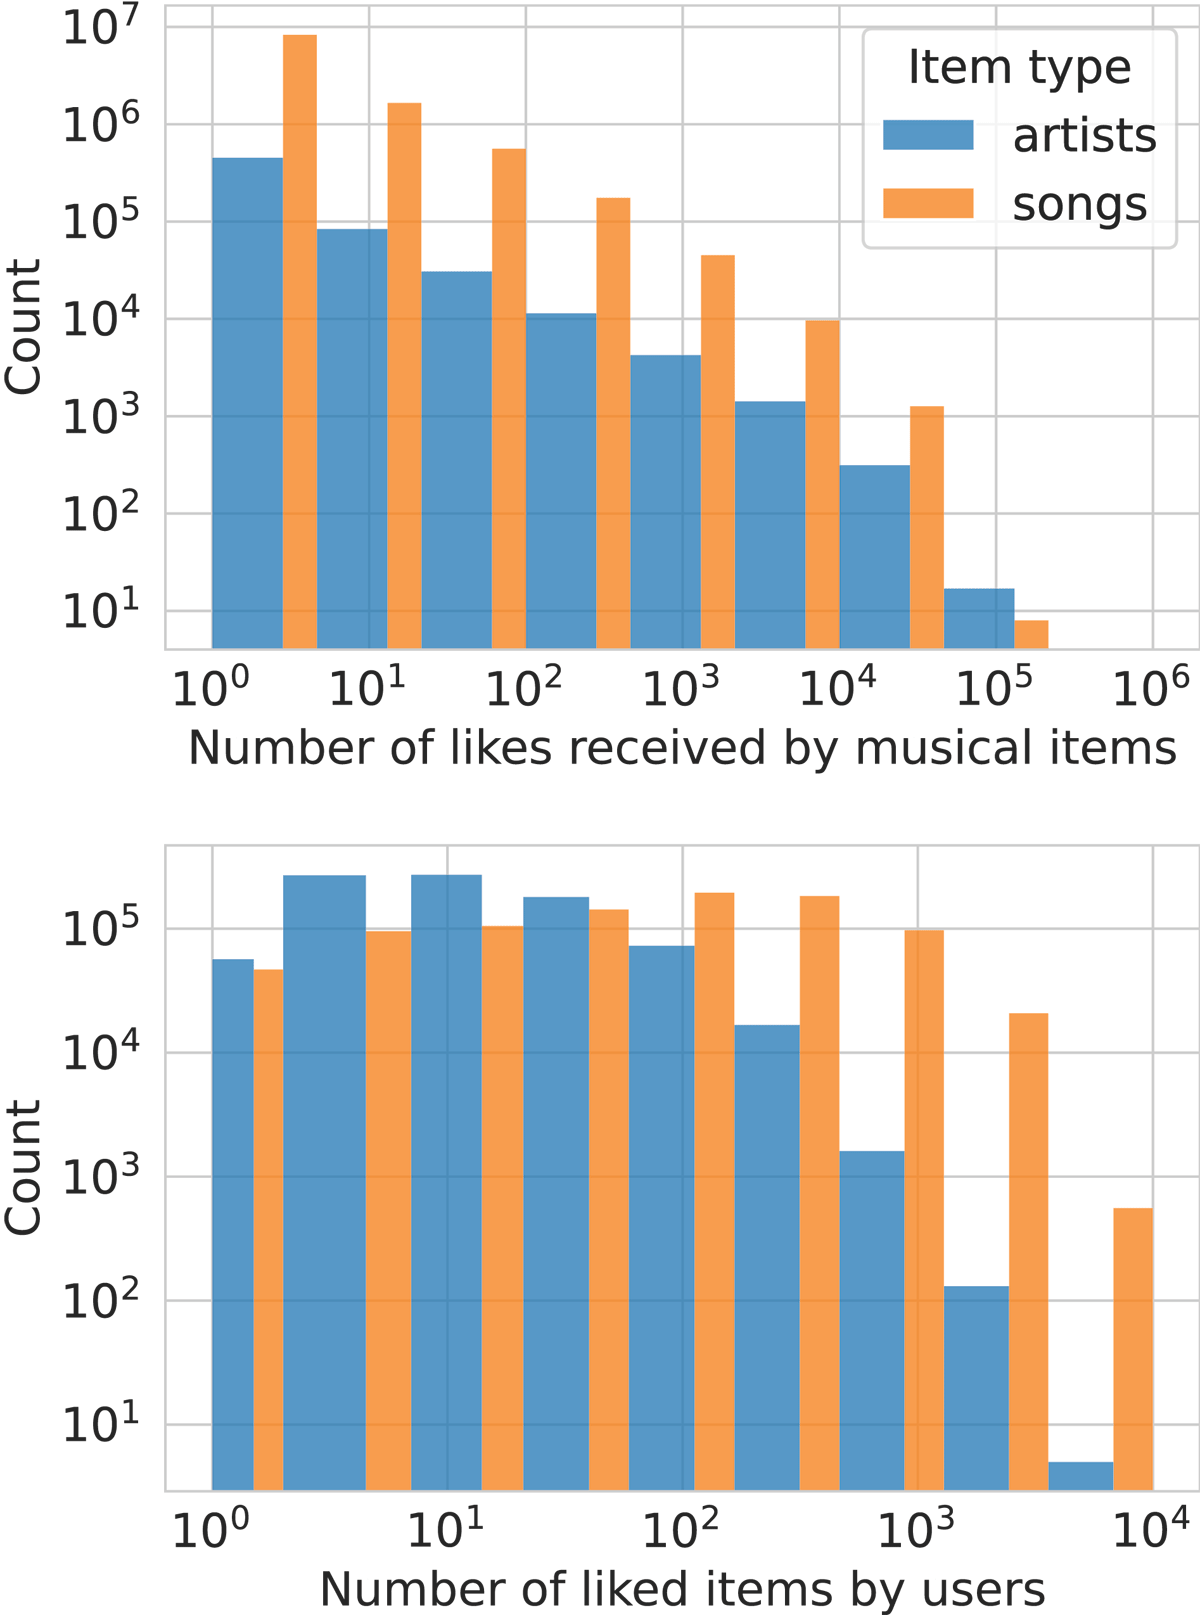
Figure 1
Heavy-tailed empirical distributions in the DL data sample. Top: Distribution of artists’ and songs’ number of “fans” (i.e. users who coined these artists/songs as “liked”). A large proportion of items is liked by only a few users, while some items are very popular (hundreds of thousands of fans). Bottom: The distribution of the number of given likes per user follows here again a heavy-tailed distribution, with some users liking ten thousand more items than other users. The proportion of users liking many items drops faster for artists than for songs.
Table 1
DL’s artists split in 6 popularity bins. The sum of likes for all artists is constant in each bin.
| Bin | Number of artists | Number of likes |
| 0 | 116 | 19283 – 86877 |
| 1 | 308 | 8534 – 19283 |
| 2 | 676 | 3690 – 8534 |
| 3 | 1865 | 1253 – 3690 |
| 4 | 7925 | 196 – 1253 |
| 5 | 575622 | 1 – 196 |
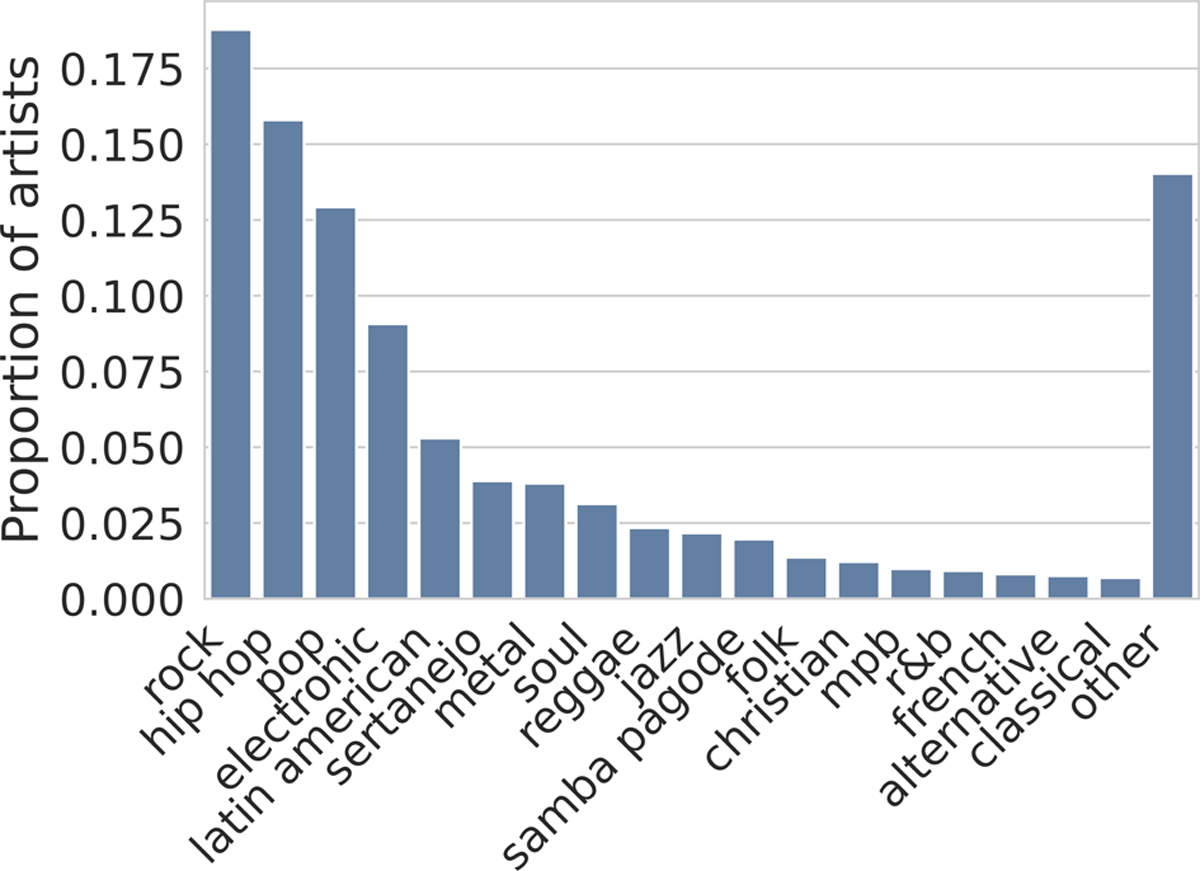
Figure 2
Proportion of DL users’ favorite artists in each music genre.
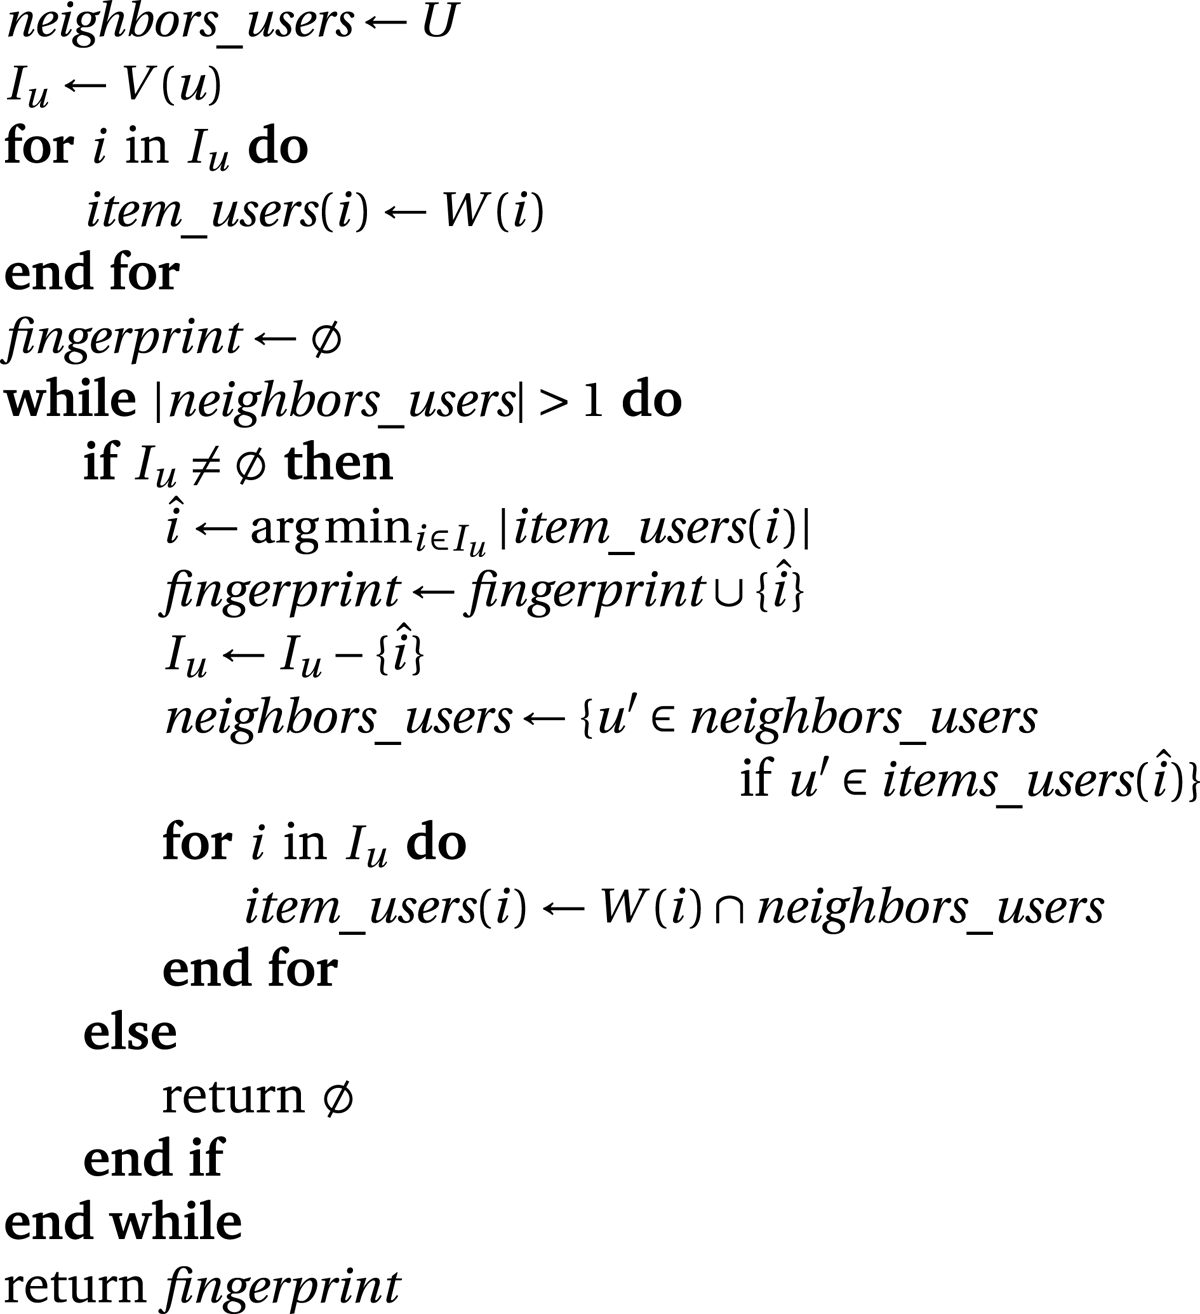
Algorithm 1
Funiq _minsize(u)
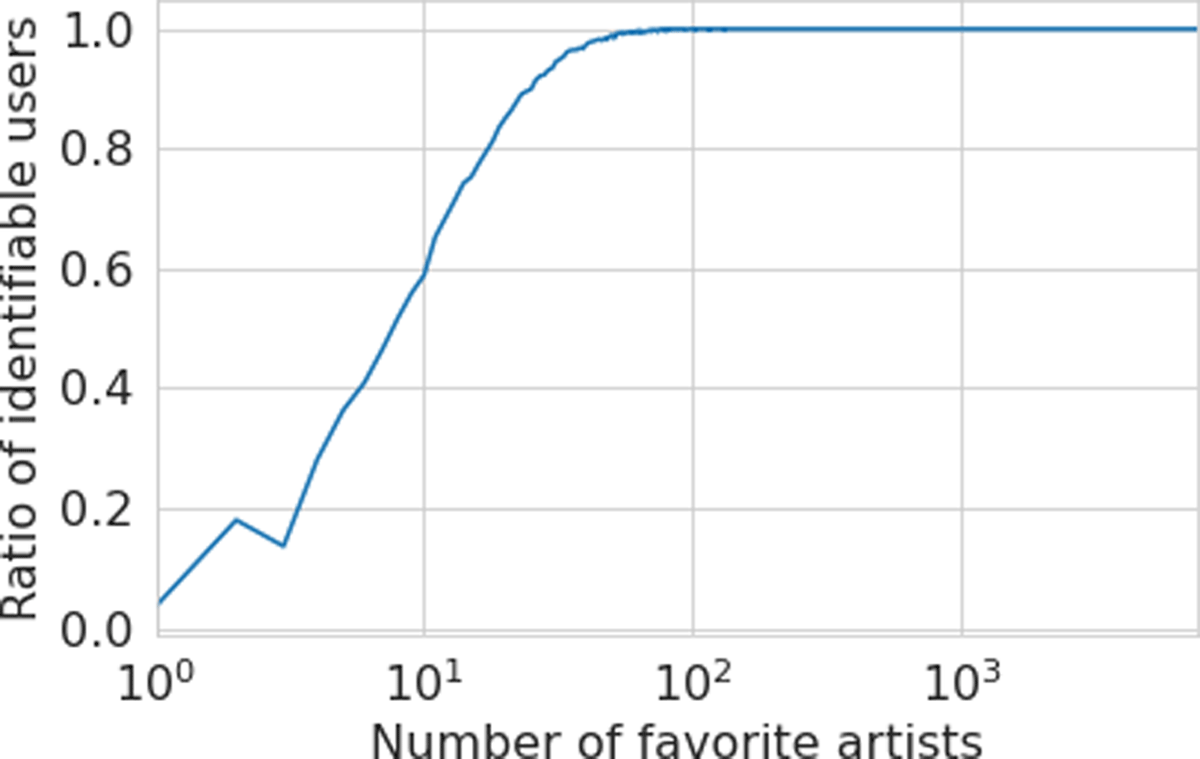
Figure 3
Share of identifiable users in DL depending on the number of items they have liked. For example, among users with 10 favorite artists and more, about 60% can be identified.
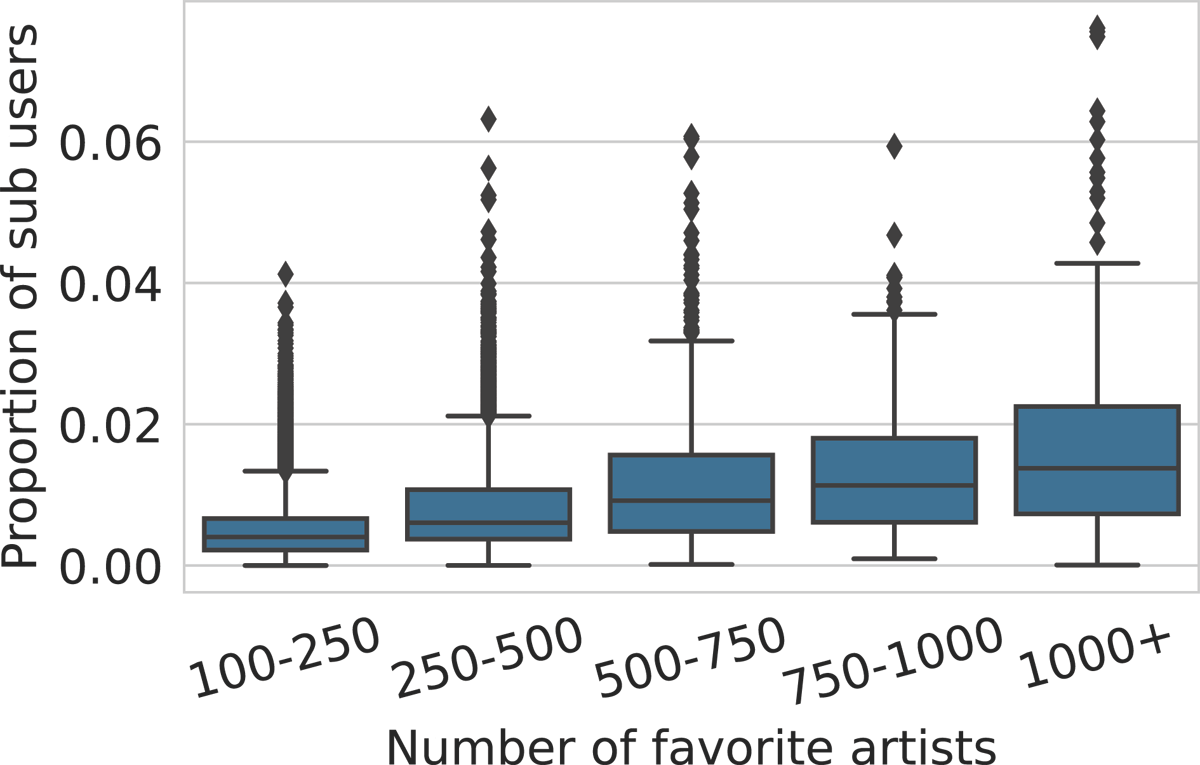
Figure 4
Distributions of how many users (in proportion of DL) have all their favorite artists included in those of a “power-user”, for various ranges of “power-user” collection size. For example, the likes of 1% of users are fully included on average in those of a user with 750–1000 favorite artists.
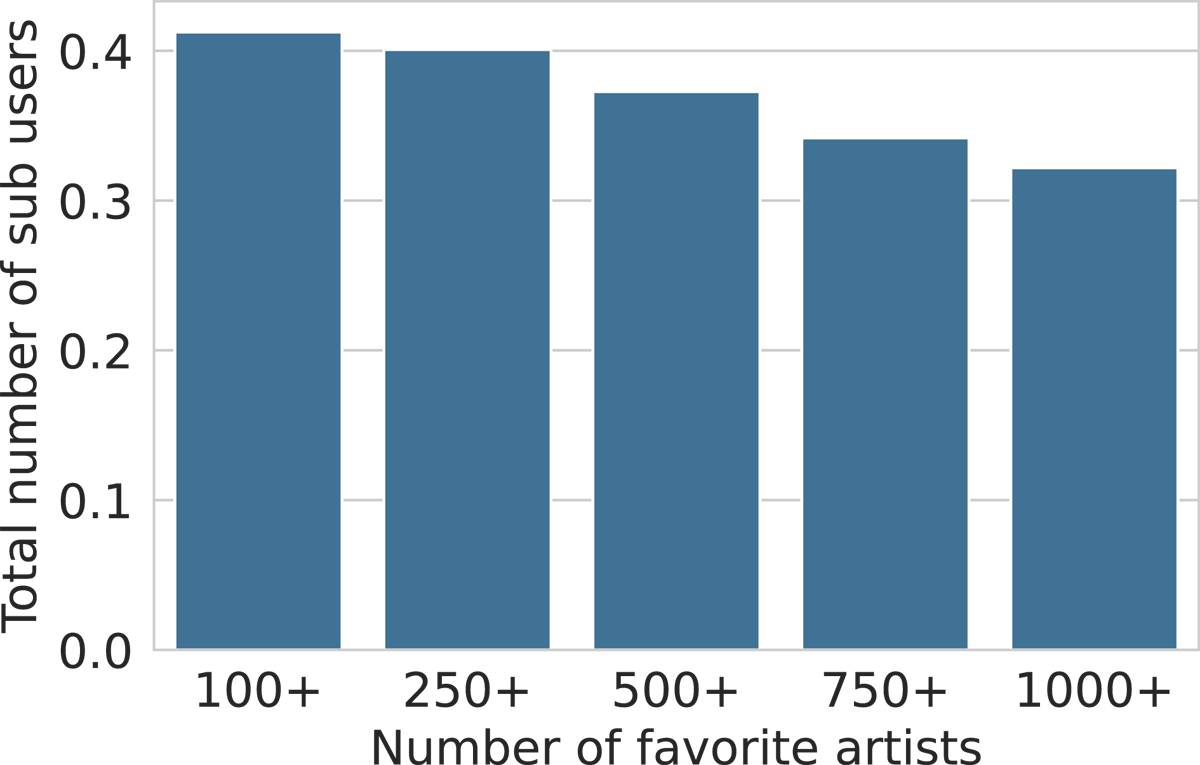
Figure 5
Proportion of users (from DL) whose favorite artists are included in the favorite artists of “power-users”. For example, 40% of users are included in users with more than 250 favorite artists.
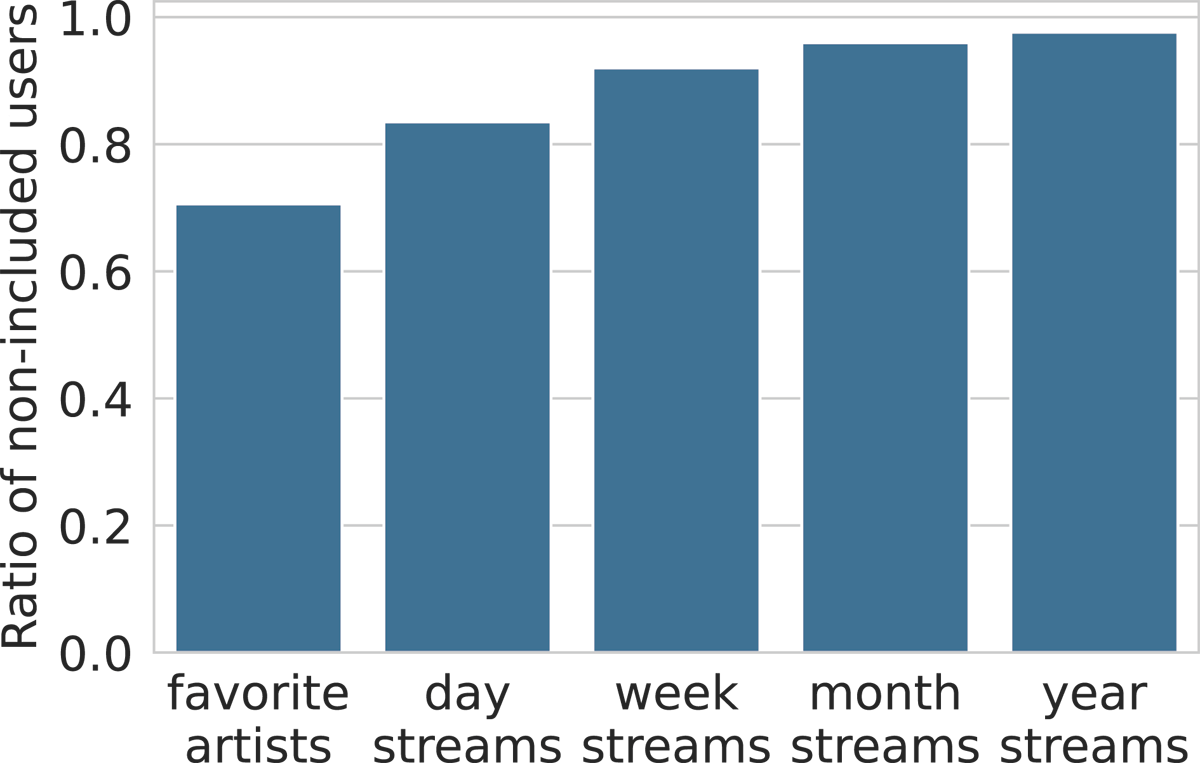
Figure 6
Ratio of users (from DS) identifiable through their liked and streamed artists, for different time periods. For example, 97% of the users are identifiable via their yearly streamed artists.
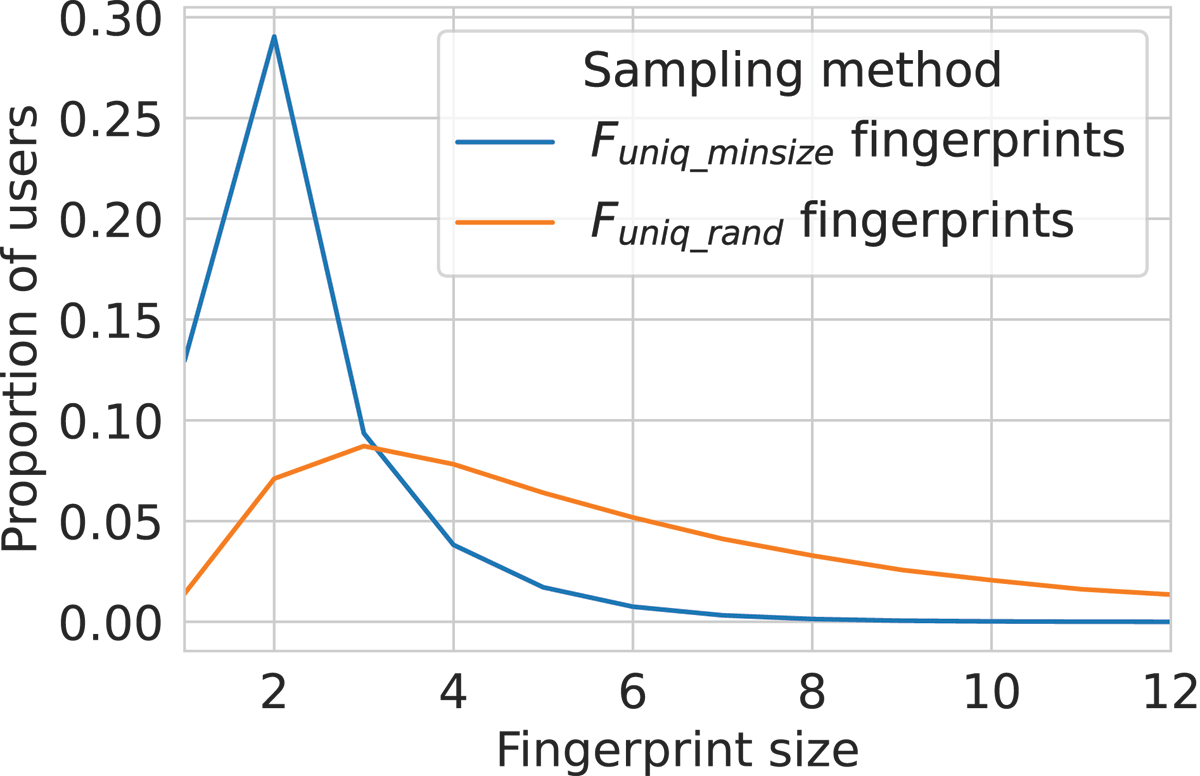
Figure 7
Distributions of fingerprint sizes, computed with Funiq_rand and Funiq_minsize based on users’ favorite artists (DL).
Table 2
Distributions of fingerprint sizes, computed with Funiq_rand and Funiq_minsize based on favorite artists and songs, for different numbers of users in the dataset.
| Artists | |||||||
| Sampling method | Number of users | Unique users (%) | Min F(u) size | Max F(u) size | Median F(u) size | Mean F(u) size | Standard deviation |
| Funiq_rand | 1000 | 87.3 | 1 | 13 | 2 | 2.4 | 1.4 |
| 10000 | 77.5 | 1 | 33 | 3 | 3.5 | 2.3 | |
| 100000 | 67.7 | 1 | 58 | 4 | 4.9 | 3.6 | |
| 871248 | 58.1 | 1 | 137 | 5 | 6.7 | 5.3 | |
| Funiq_minsize | 1000 | 87.3 | 1 | 4 | 1 | 1.3 | 0.5 |
| 10000 | 77.5 | 1 | 7 | 1 | 1.6 | 0.7 | |
| 100000 | 67.7 | 1 | 10 | 2 | 1.9 | 1.0 | |
| 871248 | 58.1 | 1 | 14 | 2 | 2.3 | 1.2 | |
| Songs | |||||||
| Funiq_rand | 1000 | 96.8 | 1 | 8 | 1.9 | 1.7 | 0.8 |
| 10000 | 94.4 | 1 | 33 | 2 | 2.2 | 1.2 | |
| 100000 | 92 | 1 | 98 | 3 | 2.9 | 1.7 | |
| 889017 | 89.9 | 1 | 176 | 3 | 3.6 | 2.4 | |
| Funiq_minsize | 1000 | 96.8 | 1 | 2 | 1 | 1.0 | 0.1 |
| 10000 | 94.4 | 1 | 5 | 1 | 1.1 | 0.3 | |
| 100000 | 92 | 1 | 8 | 1 | 1.3 | 0.5 | |
| 889017 | 89.9 | 1 | 194 | 1 | 1.4 | 1.1 | |
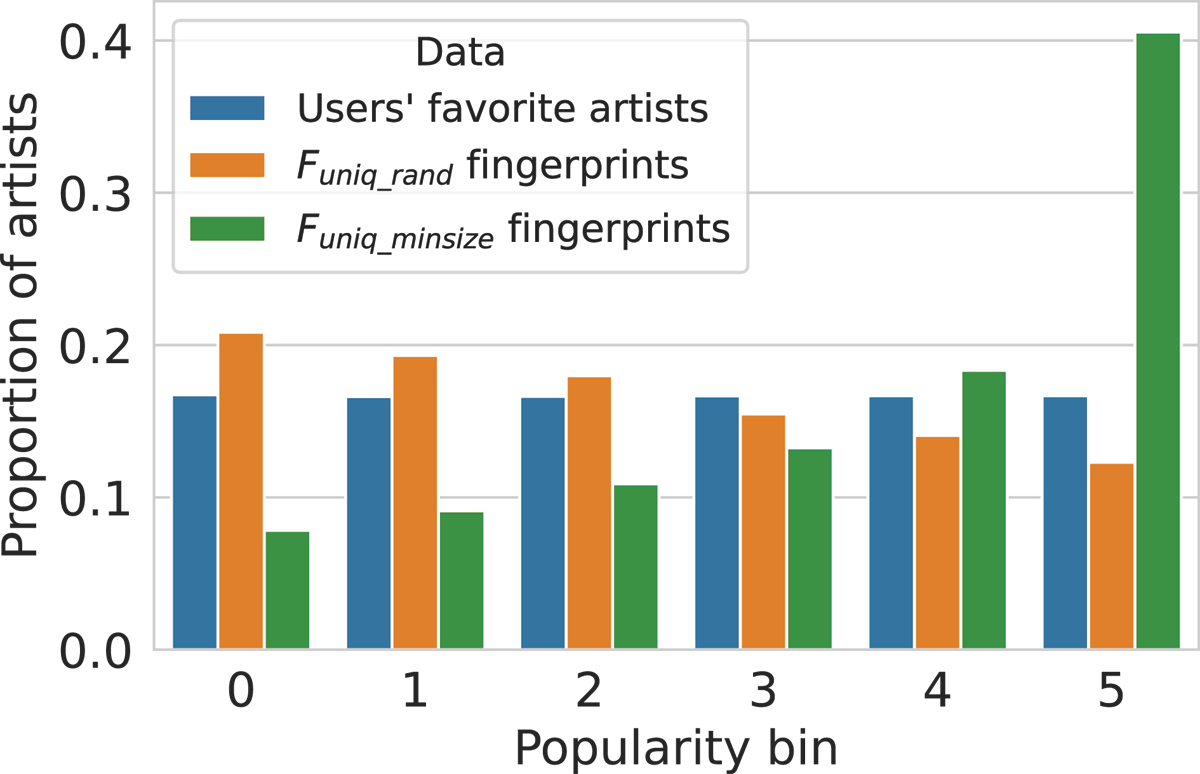
Figure 8
Distribution of popularity among the artists in the fingerprints. We compare the distribution of popularity among users’ favorite artists, Funiq_rand fingerprints and Funiq_minsize fingerprints (DL).
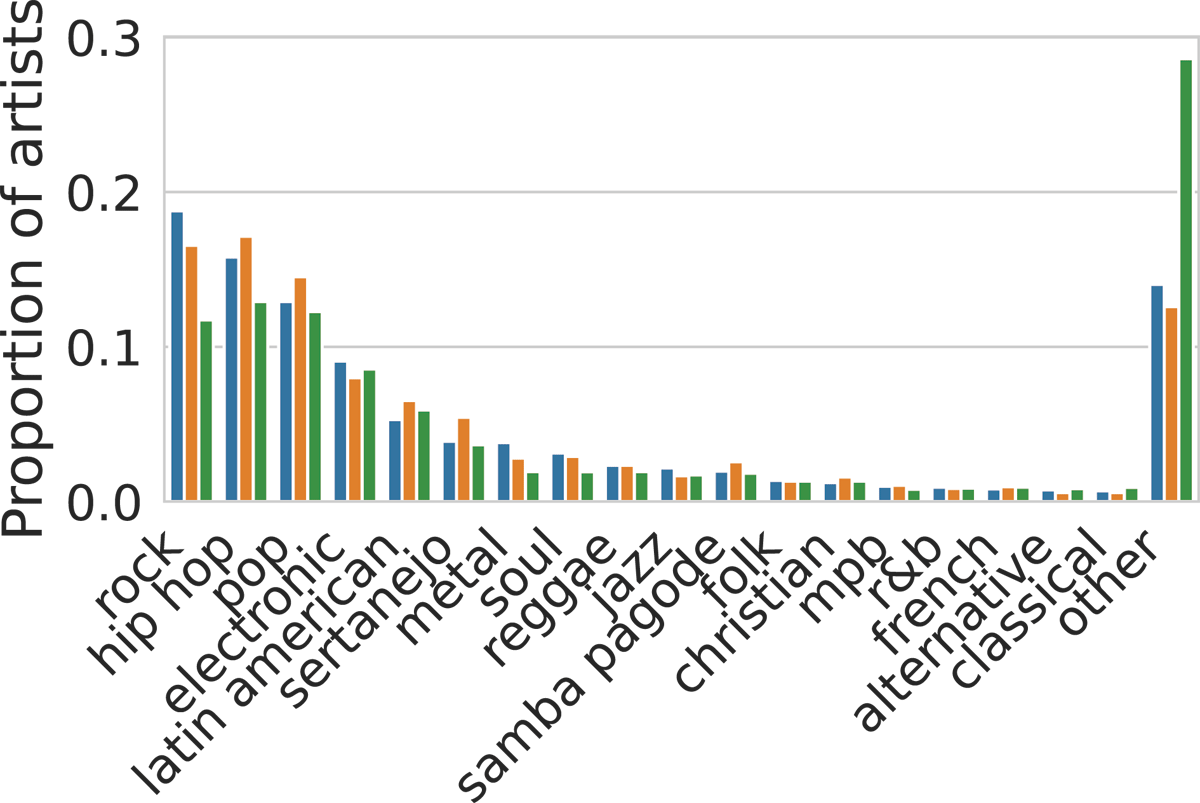
Figure 9
Distribution of genres among the artists in the fingerprints. We compare the distribution of genres among users’ favorite artists, Funiq_rand fingerprints and Funiq_minsize fingerprints (DL).
Table 3
Item-wise and genre-wise prediction accuracy with Frep_kmedoid fingerprints and randomly sampled fingerprints of the same sizes on DS_favart.
| Frep_rand | Frep_kmedoid | ||||
| Evaluation | Number of favourite artists | Mean accuracy | Standard deviation | Mean accuracy | Standard deviation |
| Item-wise | <25 | 0.05 | 0.11 | 0.08 | 0.13 |
| 25–50 | 0.14 | 0.12 | 0.25 | 0.13 | |
| 50–75 | 0.16 | 0.12 | 0.28 | 0.12 | |
| 75–100 | 0.18 | 0.11 | 0.30 | 0.12 | |
| 100–150 | 0.21 | 0.12 | 0.32 | 0.12 | |
| >150 | 0.26 | 0.12 | 0.37 | 0.10 | |
| Genre-wise | <25 | 0.38 | 0.31 | 0.40 | 0.28 |
| 25–50 | 0.65 | 0.14 | 0.73 | 0.09 | |
| 50–75 | 0.70 | 0.13 | 0.78 | 0.08 | |
| 75–100 | 0.71 | 0.12 | 0.81 | 0.07 | |
| 100–150 | 0.77 | 0.10 | 0.83 | 0.08 | |
| >150 | 0.88 | 0.12 | 0.97 | 0.05 | |
Table 4
Prediction accuracy and optimal k with an item-to-item evaluation for Frep_kmedoid on favorite artists and streamed artists for different time periods (DS).
| Accuracy | Optimal k | |||
| Data sample | Mean | Standard deviation | Mean | Standard deviation |
| Favorite artists | 0.09 | 0.12 | 2.66 | 3.26 |
| Day streams | 0.07 | 0.11 | 1.86 | 1.67 |
| Week streams | 0.13 | 0.11 | 5.03 | 4.42 |
| Month streams | 0.26 | 0.13 | 8.82 | 5.70 |
| Year streams | 0.35 | 0.12 | 9.73 | 6.23 |
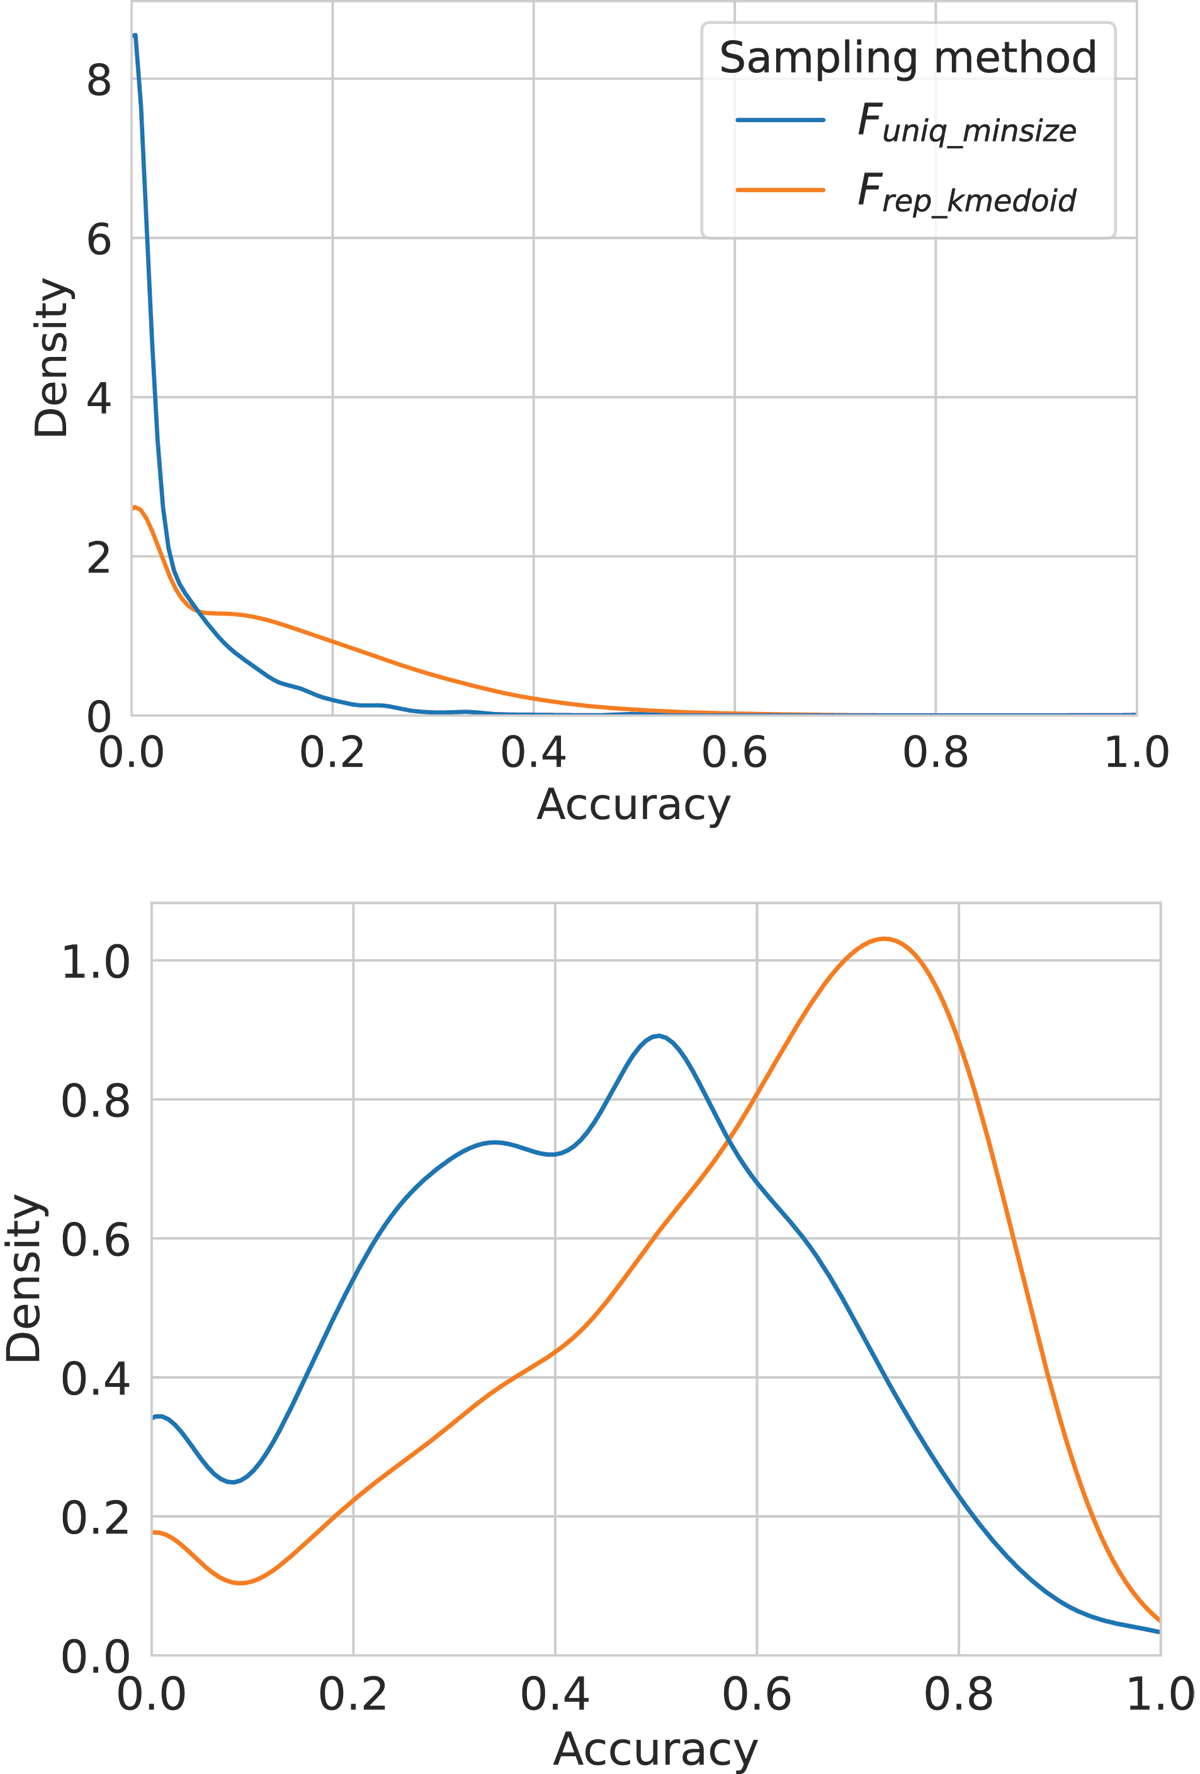
Figure 10
Item-wise (top) and genre-wise (bottom) prediction accuracy with Funiq_minsize fingerprints and Frep_kmedoid fingerprints, performed on DL_uniq.