
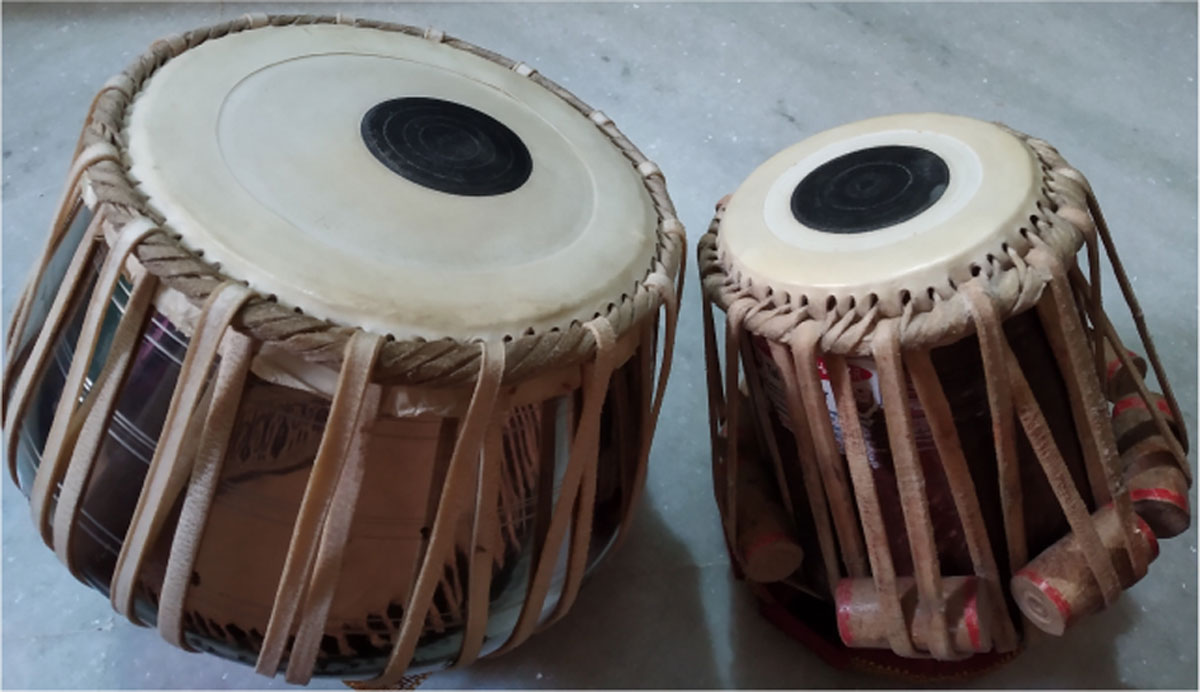
Figure 1
The tabla set – (left) bayan or dagga and (right) dayan or tabla.
Table 1
The four target tabla stroke categories, their acoustic characteristics, constituent stroke types (resonant/damped/no hit) on each drum (bass and treble) and some typical bols in each category.
| TABLA STROKE CATEGORY | ACOUSTIC CHARACTERISTICS | CONSTITUENT STROKE TYPES | BOLS | |
|---|---|---|---|---|
| BASS | TREBLE | |||
| Damped (D) | No sustained harmonics, burst of energy at onset | No hit Damped Damped | Damped No hit Damped | Ti, Ta, Te, Re, Da, Tak, Tra Ke, Kat Kda |
| Resonant Treble (RT) | Strong onset followed by sustains F0 (>150 Hz) and harmonics | No hit Damped | Resonant Resonant | Na, Tin, Tun, Din Tin (Ke on bayan) |
| Resonant Bass (RB) | Weak onset burst followed by sustained F0 (~100 Hz) and few short-lived harmonics | Resonant Resonant | No hit Damped | Ghe Dhe, Dhi, Dhet |
| Resonant Both (B) | Combined characteristics of resonant treble and bass | Resonant | Resonant | Dha, Dhin |
Table 2
Description of the train and test datasets for drums (Gillet and Richard, 2006; Southall et al., 2017b; Dittmar and Gartner, 2014) and tabla (Rohit et al., 2021).
| INSTRUMENT | DATASETS | INSTRUMENTS | DURATION |
|---|---|---|---|
| Tabla | Train/Val: Solo | 10 | 76 min. |
| Test: Accompaniment | 3 | 20 min. | |
| Drums | Train: ENST+MDB | 26 | 163 min. |
| Test: IDMT | 4 | 123 min. |
Table 3
The list of bols used to train the models for each of the atomic strokes. In bold are bols common to more than one atomic stroke.
| MODEL | BOLS USED FOR TRAINING |
|---|---|
| D | Ti, Ta, Te, Re, Da, Tak, Tra, Ke, Kat, Kda |
| RT-any | Na, Tin, Tun, Din, Dha, Dhin |
| RB-any | Ghe, Dhe, Dhi, Dhet, Dha, Dhin |
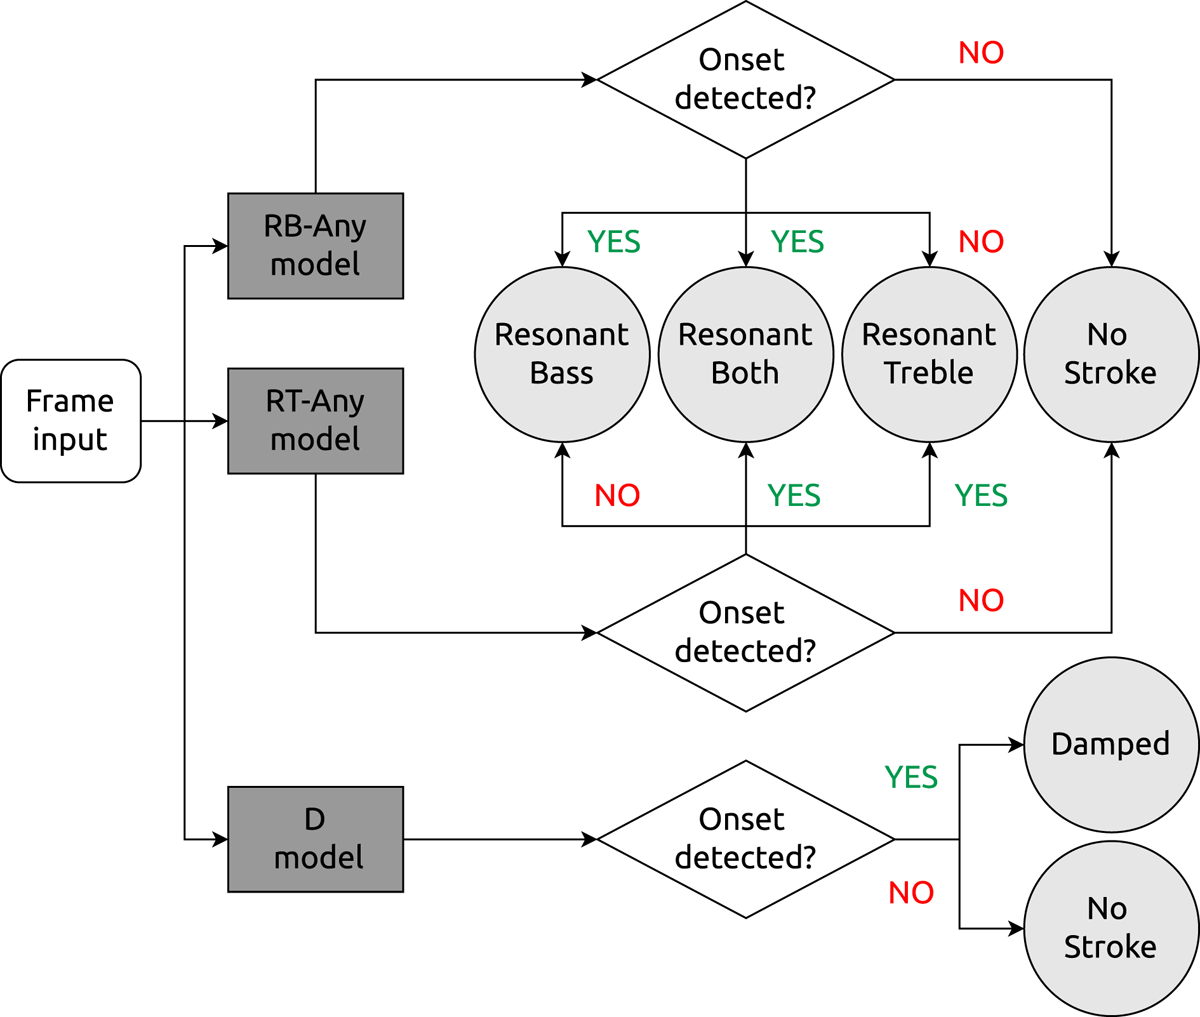
Figure 2
Schematic of the four-way classification system using three one-way CNN models to predict presence of atomic strokes (D, RT-any and RB-any) in a given audio frame. If both RT and RB onsets are detected then the onset is marked B. Any D that co-occurs with RT or RB is ignored.
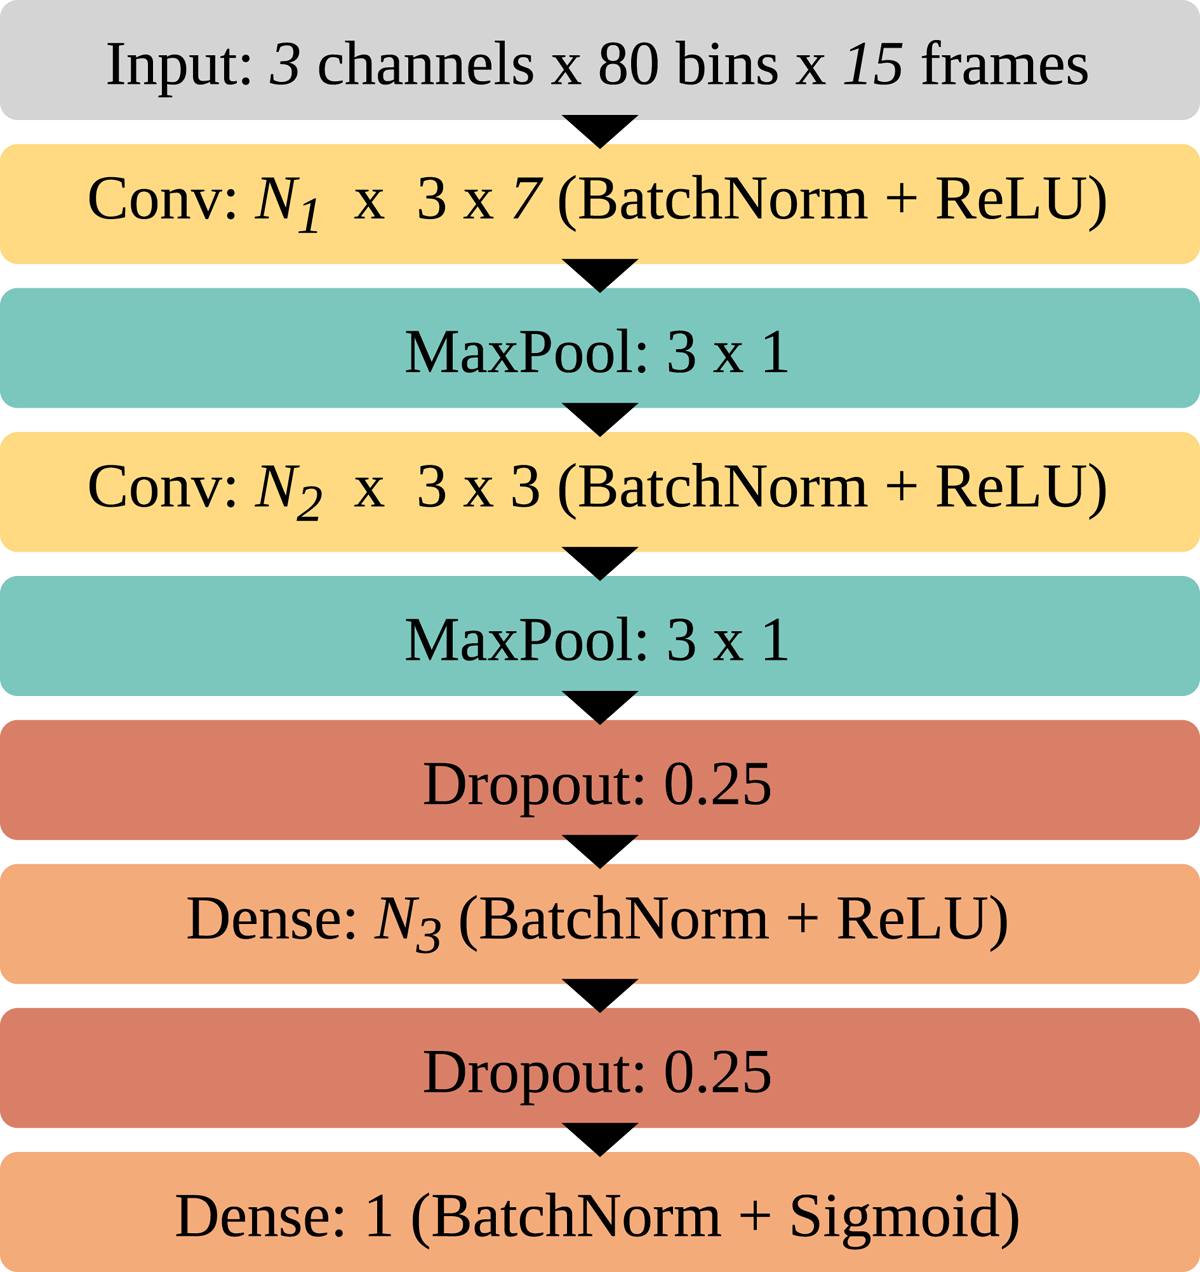
Figure 3
General CNN model architecture for all experiments.
Table 4
Hyperparameter values for the CNN model architecture (of Figure 3) used for each stroke category.
| MODEL | HYPERPARAMETERS |
|---|---|
| D | N1=16, N2=32, N3=256 |
| RT-any | N1=32, N2=64, N3=128 |
| RB-any | N1=16, N2=32, N3=128 |
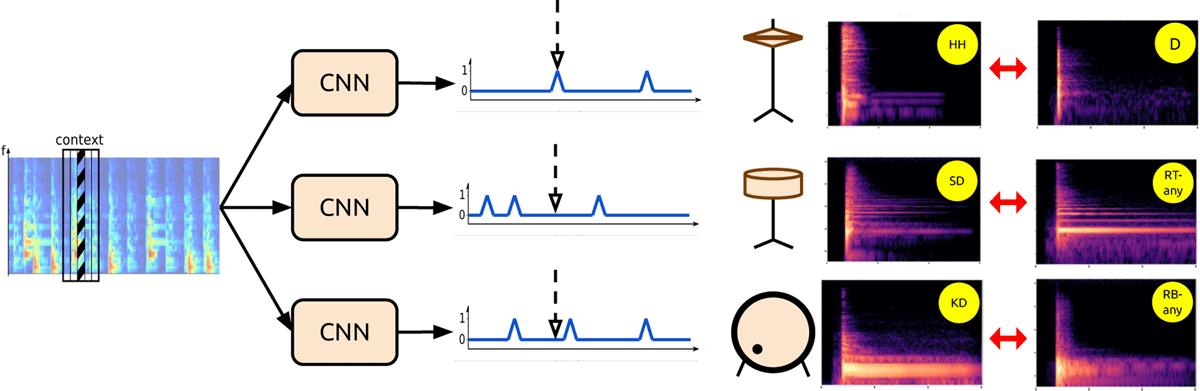
Figure 4
The transfer learning approach where the three one-way CNNs are first pretrained to predict single drum onsets and then fine-tuned on corresponding tabla stroke category data. Model input is a small portion of a track’s spectrogram and the output is the onset prediction for the center frame. Figure inspired by Vogl et al. (2017). The final spectrogram pairs demonstrate the acoustic similarity across the mapped source and target classes.
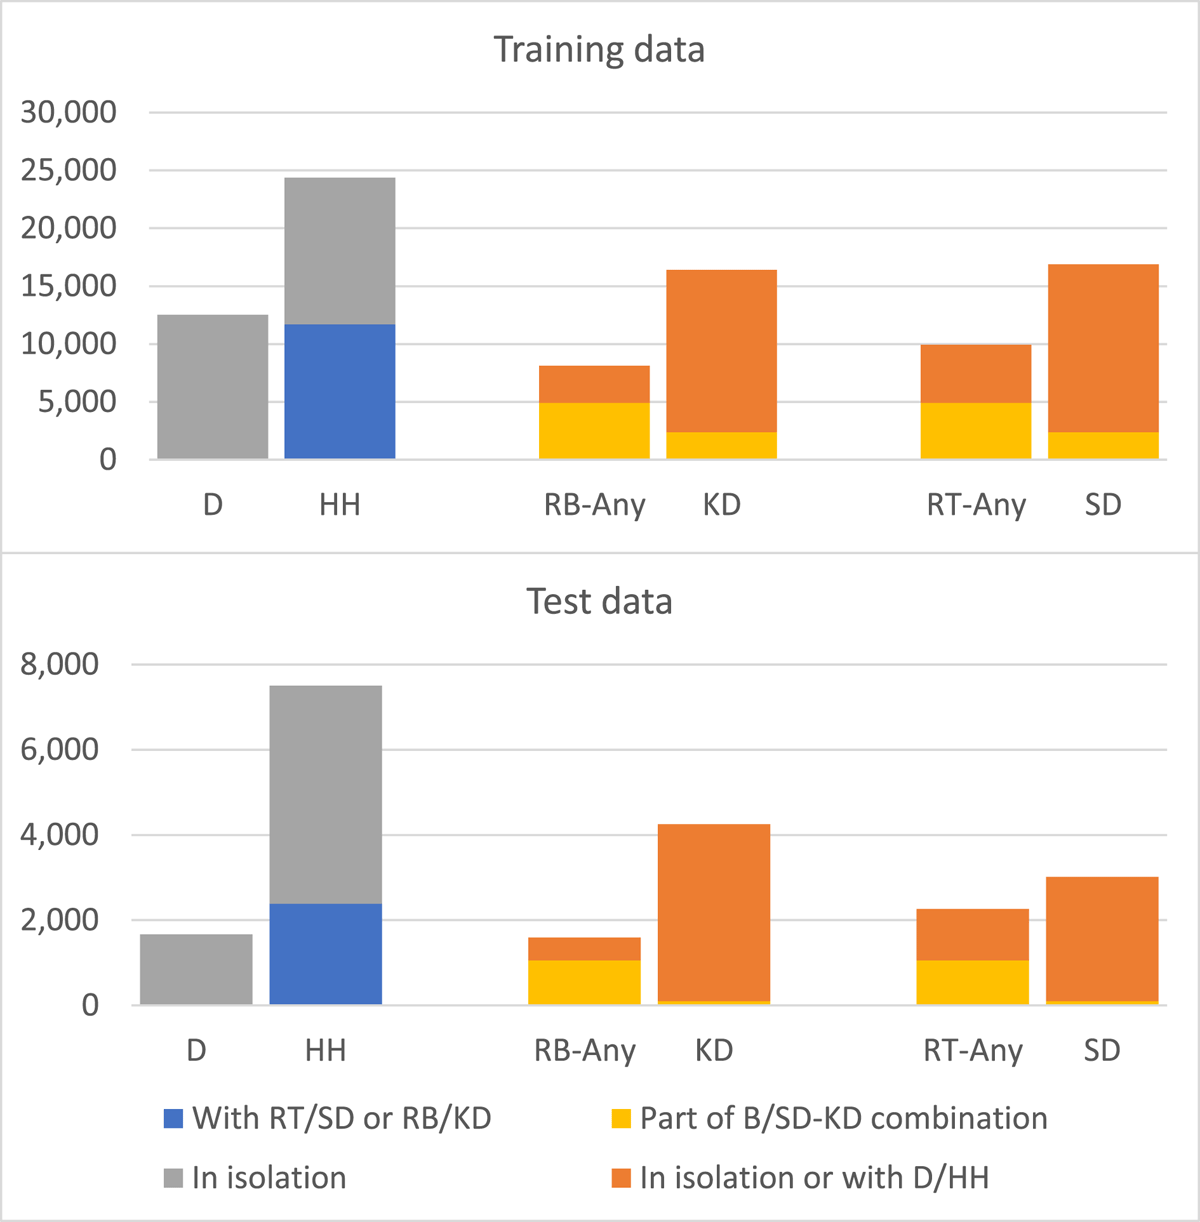
Figure 5
Distribution of drum and tabla strokes in the training and test datasets across the various drum and tabla stroke categories.
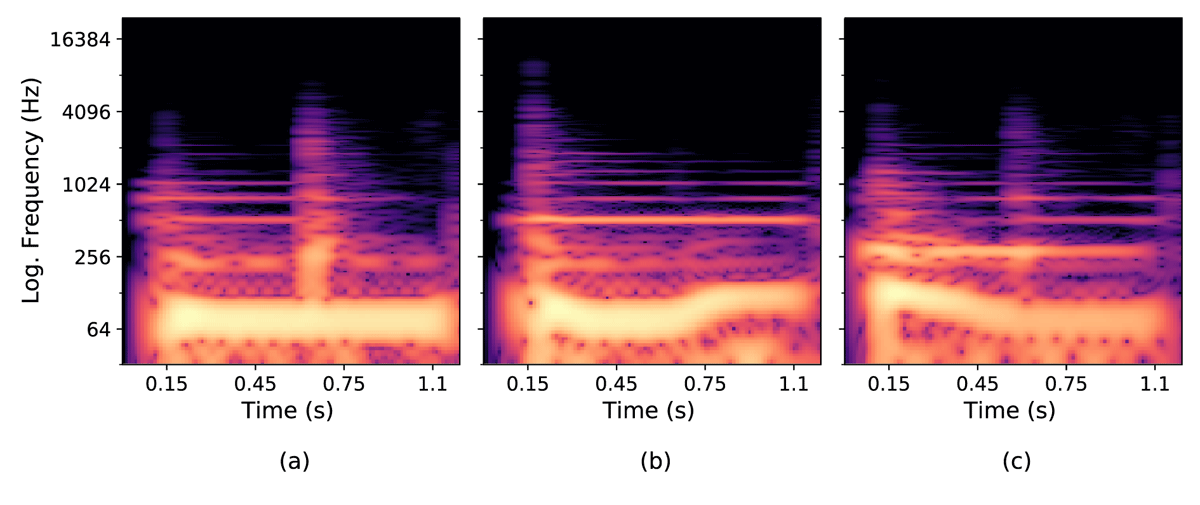
Figure 6
Spectrograms of resonant both tabla strokes showing the common F0 modulation types for the constituent resonant bass stroke: (a) No modulation, (b) Up modulation, and (c) Down modulation (ignore accompanying resonant treble harmonics and bursts of energy between 0.45–0.75 seconds in (a) and (c) from onsets of subsequent strokes on the treble drum).
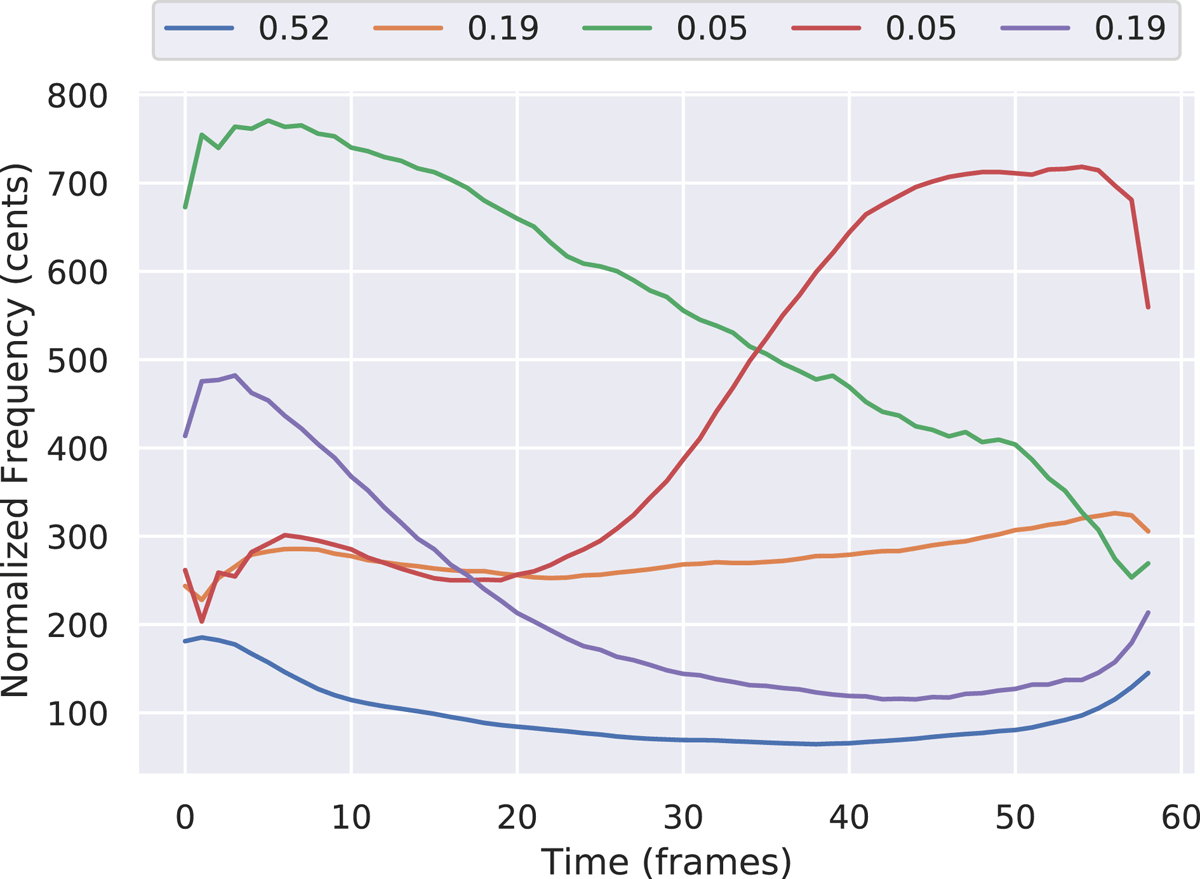
Figure 7
The five cluster centroids resulting from the k-means model fitted on resonant bass F0 contours of the tabla training dataset. The legend shows the fraction of data points assigned to each cluster.
Table 5
Mean CV F-score of RT, RB and B classification using different tolerance windows for combining simultaneous RT-any and RB-any onsets to B. The models were pretrained on unmodified drum data and fine-tuned on tabla data.
| Tolerance (ms) | 10 | 20 | 40 | 80 | 160 |
| Mean F-score (RT, RB, B) | 69.0 | 73.3 | 73.8 | 73.9 | 67.0 |
Table 6
CV f-scores comparing stroke classification performance of the three atomic strokes (D, RT-any and RB-any) with the differently trained models of this work. ‘Untrained’ represents a model with random weights. Indentation in ‘Method’ column represents nested experiments. Values in bold are the highest in each column. An asterisk represents a significant difference (p < 0.001) between the f-scores of the best fine-tuned (selected from rows 3–3g) and the corresponding retrained model (of row 4).
| METHOD | D | RT-ANY | RB-ANY | |
|---|---|---|---|---|
| 1 | Untrained | 24.0 | 19.0 | 15.6 |
| 2 | Drum-pretrained | 55.6 | 37.1 | 28.8 |
| 3 | Fine-tuned | 88.3 | 92.9 | 87.7 |
| 3a | + HH only | 88.3 | – | – |
| 3b | + RF aug | 88.5 | – | – |
| 3c | + SD-KD data repeat | – | 93.1* | 88.1 |
| 3d | + PS aug | – | 93.0 | 88.8 |
| 3e | + Bass mod aug | – | – | 87.4 |
| 3f | + RS aug | – | 92.7 | 87.2 |
| 3g | + PS, RS aug | – | 92.4 | 86.8 |
| 4 | Retrained | 88.2 | 91.9 | 88.3 |
| 4a | + Bass mod aug | – | – | 88.2 |
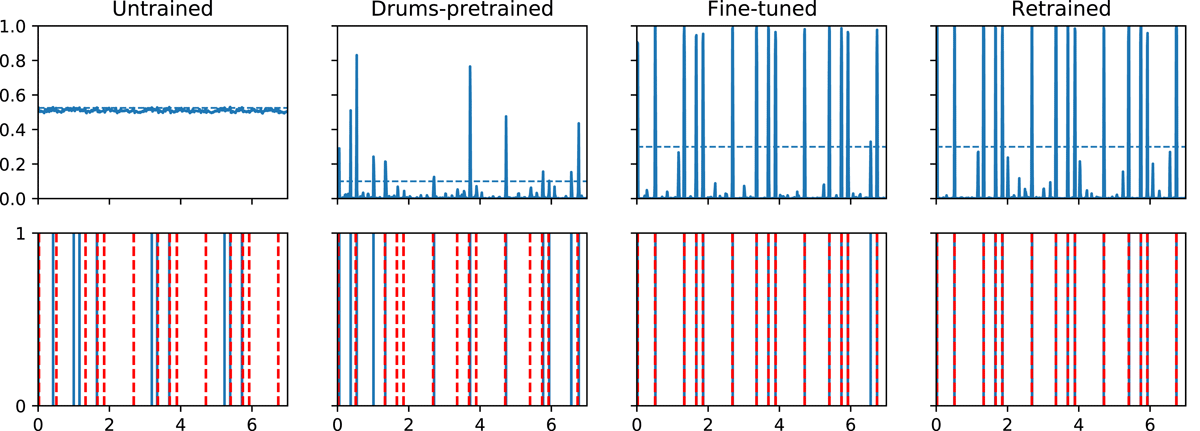
Figure 8
Automatic transcription for the RB-any in a short tabla solo segment. Top: model output activations versus time (horizontal dashed line is the peak-picking threshold); bottom: estimated onset locations (solid blue) and ground truth (dashed red). From left to right – untrained, drum-pretrained, tabla fine-tuned and tabla retrained models.
Table 7
ADT performance (test f-scores) on the IDMT-set comparing SOTA from ADT literature, against our models trained using different drum augmentation methods.
| METHOD | HH | SD | KD | MEAN |
|---|---|---|---|---|
| Southall et al 2017 (CNN) | – | – | – | 83.1 |
| Our models | 82.7 | 85.3 | 90.2 | 86.1 |
| + HH only | 80.2 | – | – | – |
| + RF aug | 84.5 | – | – | – |
| + SD-KD data repeat | – | 85.5 | 93.9 | – |
| + PS aug | – | 80.2 | 93.7 | – |
| + RS aug | – | 82.7 | 90.3 | – |
| + PS, RS aug | – | 81.1 | 90.6 | – |
Table 8
Four-way CV/test classification f-scores for the transfer learning and retraining methods. The best set of D, RT-any, RB-any models combines the individual highest scoring D, RT-any and RB-any methods from the fine-tuned models of Table 6 (i.e. the values in bold in Table 6). Overall f-score is across the four categories. As expected from our understanding of transfer learning, all values in row 2 (fine-tuned model) are significantly higher than those in row 1 (p < 0.001). Values in bold are highest across rows 2 and 3. The asterisk marks the only significant difference (p = 0.002 in this case) between f-scores of corresponding fine-tuned and retrained models of this work (i.e. rows 2 and 3).
| METHOD | D | RT | RB | B | OVERALL | |
|---|---|---|---|---|---|---|
| 1 | Drum-pretrained | 57.8/44.0 | 40.9/48.7 | 16.2/17.5 | 3.6/2.1 | 44.8/36.2 |
| 2 | Best set of D, RT-any, RB-any models (Table 6) | 89.2/83.0 | 86.1*/86.0 | 73.2/63.6 | 89.2/81.5 | 86.7/81.2 |
| 3 | Retrained | 89.2/83.6 | 84.3/86.6 | 73.7/66.9 | 89.0/82.7 | 86.3/82.1 |
| 4 | Retrained Rohit et al. (2021) | 88.2/83.8 | 83.7/84.6 | 71.2/34.0 | 87.9/82.0 | 85.5/79.5 |