
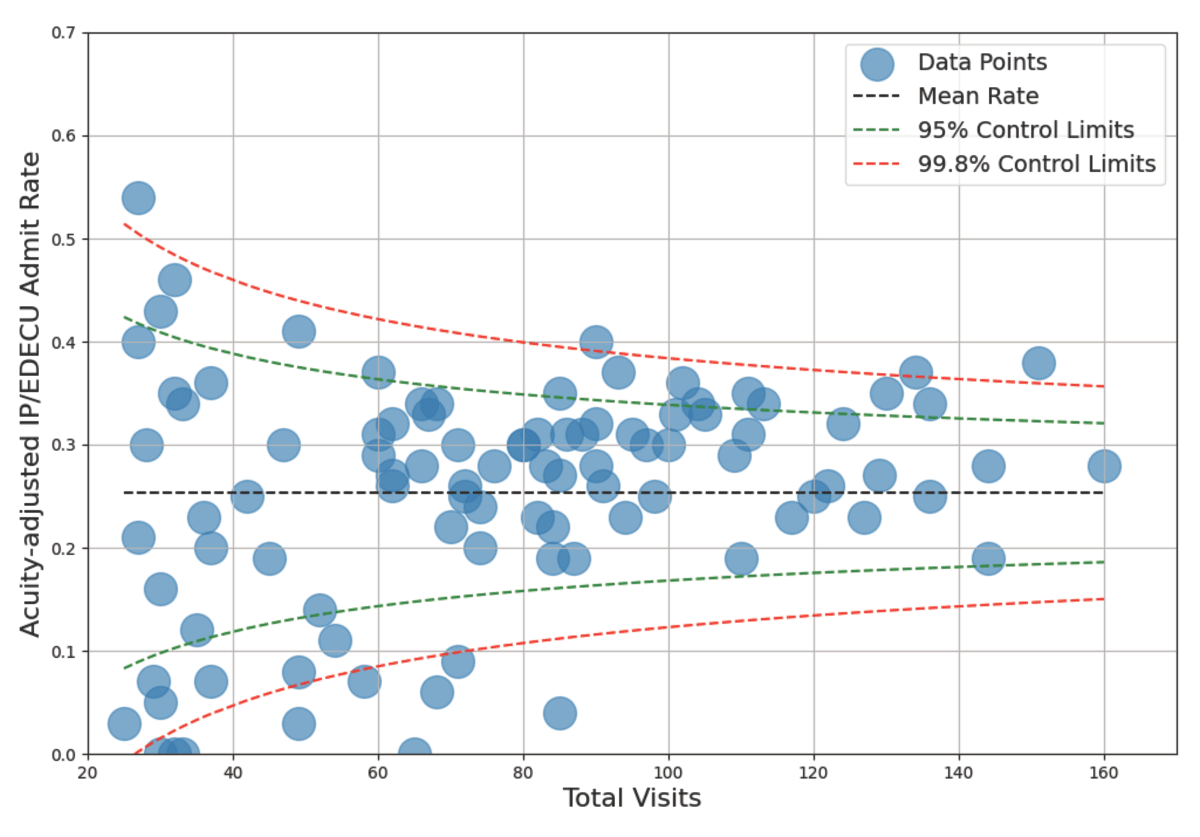
Figure 1
Acuity-Adjusted Emergency Department Inpatient Admission Rate By Attending Physician in Children Presenting with Acute Asthma Exacerbation.
Each blue circle represents a Pediatric Emergency Medicine (PEM) Attending Physician, with acuity-adjusted successful discharge rate on the y-axis and number of yearly asthma encounters on the x-axis. The dashed black line represents mean rate among all PEM physicians, with the green dashed line representing 95% control limits and the red dashed line representing 99.8% control limits. Physicians from across the spectrum of discharge rates were selected and interviewed within 1–2 days from last shift in a “respiratory cohort” team in the Emergency Department.
Table 1
Participant Characteristics.
| SUBJECT | ACADEMIC TITLE | SEX | SHIFTS PER MONTH (Min) | SHIFTS PER MONTH (Max) | YEARS FROM COMPLETION OF PEDIATRIC EMERGENCY MEDICINE FELLOWSHIP | ADMISSION TYPE |
|---|---|---|---|---|---|---|
| 01 | Assistant Professor | F | 8 | 10 | 2 | Low |
| 02 | Associate Professor | F | 8 | 9 | 10 | High |
| 03 | Professor | M | 5 | 5 | 30 | High |
| 04 | Assistant Professor | F | 10 | 12 | 3 | High |
| 05 | Professor | F | 8 | 8 | 15 | High |
| 06 | Professor | F | 4 | 4 | 25 | Average |
| 07 | Associate Professor | F | 11 | 12 | 9 | Average |
| 08 | Assistant Professor | F | 11 | 12 | 3 | Average |
| 09 | Professor | F | 8 | 8 | 25 | Low |
| 10 | Associate Professor | F | 8 | 9 | 10 | Low |
| 11 | Professor | F | 6 | 6 | 36 | Average |