
Table 1
Semi-Structured Interview Participant Profiles (N = 39).
| CHARACTERISTIC | CATEGORY | N | % |
|---|---|---|---|
| Gender | Male | 26 | 66.7 |
| Female | 13 | 33.3 | |
| Nationality | Saudi National | 15 | 38.5 |
| Arab Expatriate (non-Saudi) | 10 | 25.6 | |
| South/Southeast Asian | 9 | 23.1 | |
| Western (European/North American) | 5 | 12.8 | |
| Employment Category | Permanent/Direct Employee | 24 | 61.6 |
| Fixed-Term Contract | 10 | 25.6 | |
| Agency/Outsourced | 5 | 12.8 | |
| Organizational Level | Operations/Technical Staff | 13 | 33.3 |
| Professional/Senior Specialist | 16 | 41.1 | |
| Team Leader/Middle Manager | 7 | 17.9 | |
| Senior Manager/Director | 3 | 7.7 | |
| Years of Organizational Tenure | Fewer than 3 years | 6 | 15.4 |
| 3 to 7 years | 12 | 30.8 | |
| 8 to 14 years | 13 | 33.3 | |
| 15 years or more | 8 | 20.5 | |
| Highest Educational Qualification | Diploma or Vocational Certificate | 5 | 12.8 |
| Bachelor’s Degree | 19 | 48.7 | |
| Postgraduate (Master’s/PhD) | 15 | 38.5 |
[i] Note. N = 39. Percentages are rounded to one decimal place. Within Employment Category and Organizational Level, rounding leaves a residual of 0.1; this has been absorbed into the largest category in each series so that every series sums to 100.0.
Table 2
Thematic Categories, Sub-Themes, and Empirical Prevalence.
| THEMATIC CATEGORY | SUB-THEMES IDENTIFIED | PROPORTION OF CODED DATA (%) | EVIDENCE SOURCES |
|---|---|---|---|
| Theme A: Authority Misuse and Supervisory Coercion | A1: Intimidation and Verbal Hostility; A2: Coercive Performance Leverage; A3: Exclusionary Leadership Practices; A4: Promotion-Induced Behavioral Regression | 32% | Internal Communications: 83 entries; Interviews: 36 participants |
| Theme B: Suppression of Employee Voice and Retaliatory Culture | B1: Fear of Professional Reprisal; B2: Informal Intimidation Networks; B3: Cynicism Toward Reporting Mechanisms; B4: Collective Withdrawal from Disclosure | 27% | Internal Communications: 71 entries; Interviews: 37 participants |
| Theme C: Structural and Procedural Inequities | C1: Employment-Category-Based Discrimination; C2: Nepotism and Informal Influence Networks; C3: Selective Enforcement of Organizational Policies; C4: Absence of Grievance Transparency | 20% | Internal Communications: 62 entries; Interviews: 32 participants |
| Theme D: Organizational Betrayal and Eroded Institutional Confidence | D1: Dissonance Between Stated Values and Enacted Conduct; D2: Inadequate Enforcement of Anti-Mistreatment Pledges; D3: Organizational Shielding of Offenders; D4: Entrenched Disillusionment and Disengagement | 14% | Internal Communications: 48 entries; Interviews: 27 participants |
| Theme E: Socio-Cultural and Institutional Conditions | E1: Hierarchical Deference vs. Dignity Expectations; E2: Harmony-Oriented Social Norms and Silence; E3: Religious-Ethical Frameworks as Normative Anchors; E4: Generational Shifts in Workplace Expectations | 7% | Internal Communications: 33 entries; Interviews: 21 participants |
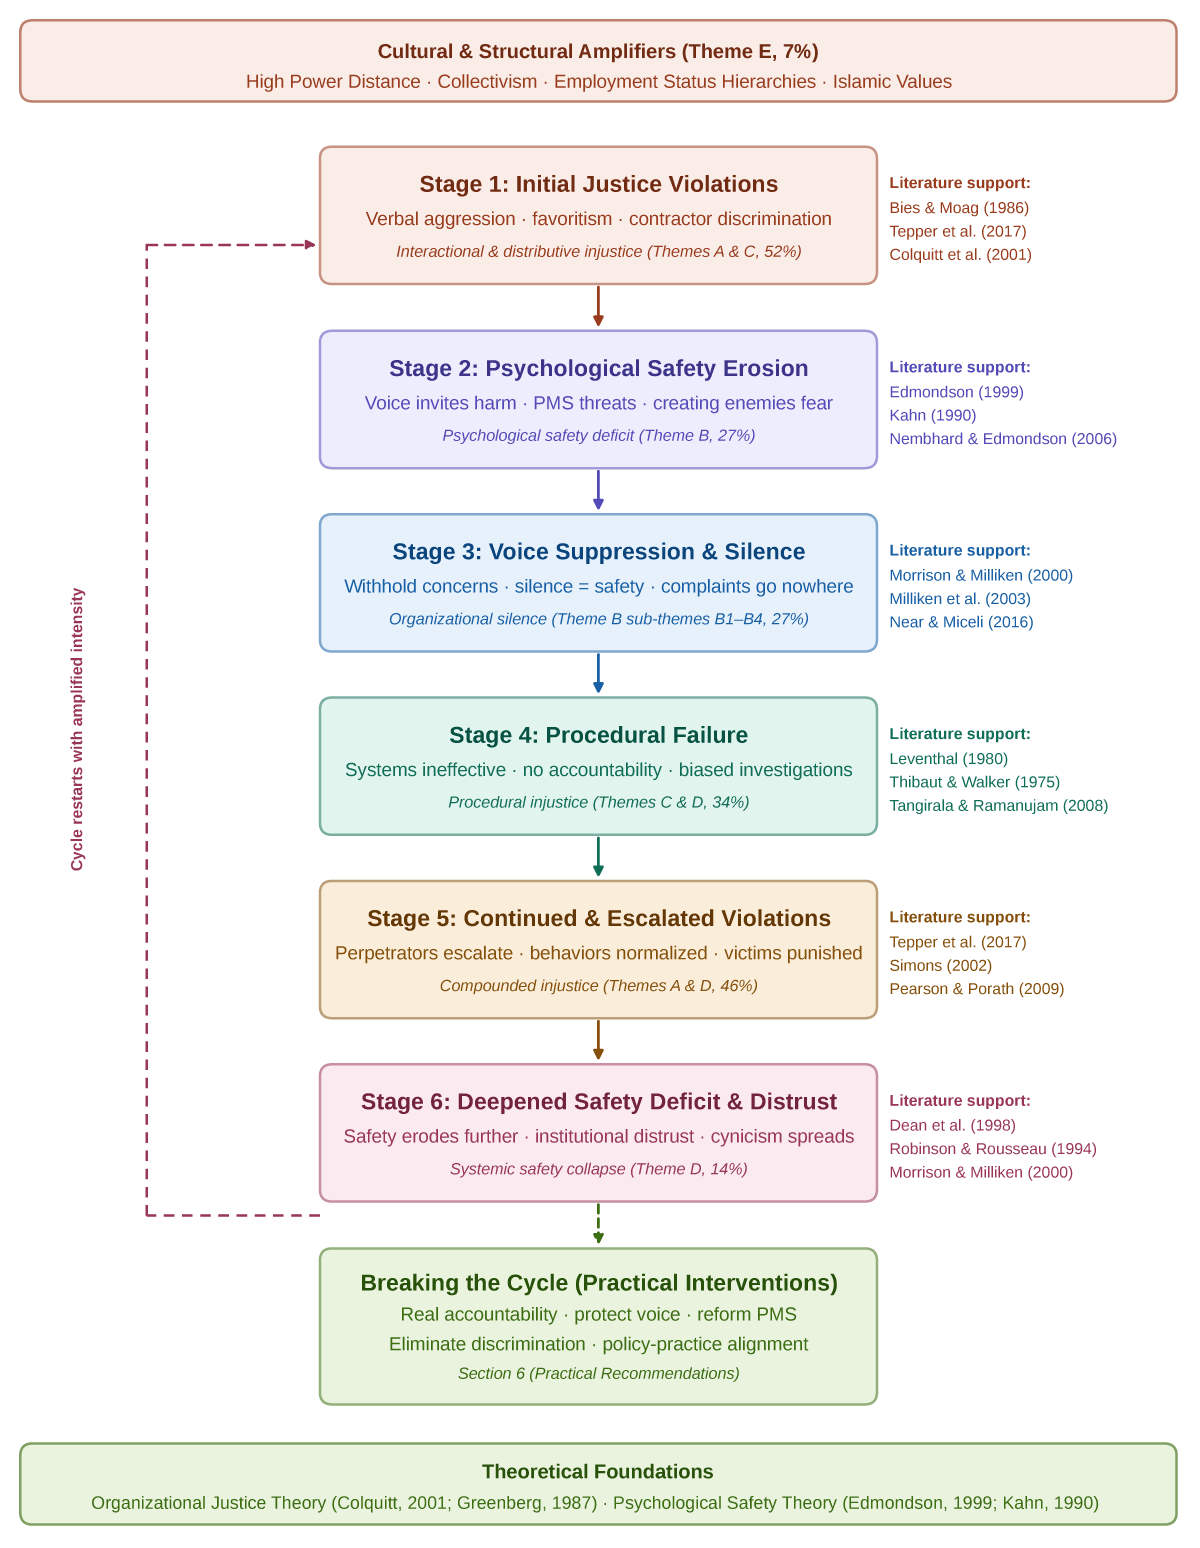
Figure 1
Integrated conceptual framework: the Justice–Safety Vicious Cycle Model.
Note. OJT = Organizational Justice Theory; PST = Psychological Safety Theory; PMS = performance management system; Themes A–E are defined in Table 2. Solid arrows denote the primary cycle pathway; the dashed arrow denotes the return of the cycle to Stage 1. The model was developed inductively from the reflexive thematic analysis (Braun & Clarke, 2006, 2019) and read against both theoretical frameworks. It is offered as a conceptual framework requiring future quantitative longitudinal testing (see Section 6.5). Percentages give the share of coded data accounted for by the theme or themes grounding each stage; because several themes ground more than one stage, the percentages are not additive.