

Figure 1
Hypothesized best fitting model 1: Five correlated factors model.
Table 1
Cronbach’s alpha coefficients for the five subscales of MFQ-20 and MFSS.
| MFQ-20 CRONBACH’S α (4 ITEMS/FOUNDATION) | MFSS CRONBACH’S α (4 ITEMS/FOUNDATION) | |
|---|---|---|
| Care/Harm | .47 | .71 |
| Fairness/reciprocity | .41 | .63 |
| Loyalty/betrayal | .51 | .59 |
| Authority/respect | .53 | .70 |
| Sanctity | .50 | .53 |
| FULL SCALE (20 items) | .70 | .86 |
Table 2
Results of Confirmatory Factor Analysis for the relationships among Moral Foundations models.
| MODEL | WLSMVχ2 | df | CFI/TLI | RMSEA | WRMR |
|---|---|---|---|---|---|
| MFQ20 | |||||
| A. One-factor model | 3907.90*** | 170 | .520/.470 | .105 | 3.84 |
| B. Two-factors model | 2887.28*** | 169 | .650/.610 | .090 | 3.32 |
| C. Three-factors model | 2348.28*** | 167 | .720/.680 | .081 | 2.98 |
| D. Five-factors model | The model fails to converge | ||||
| MFSS | |||||
| A. One-factor model | 1838.63*** | 170 | .900/.890 | .070 | 2.09 |
| B. Two-factors model | 1426.37*** | 169 | .930/.920 | .060 | 1.83 |
| C. Three-factors model | 1346.65*** | 167 | .930/.920 | .060 | 1.76 |
| D. Five-factors model | 1126.86*** | 160 | .940/.930 | .060 | 1.58 |
[i] Note: Structural equation modeling was used for the analyses. Weighted Least Squares Means and Variances (WLSMV) was used for model estimation. CFI = comparative fit index; TLI = Tucker Lewis Index; RMSEA = root-mean-square error of approximation; WRMR = weighted mean-square residual standardized.
*** p <.001.
In each Model A, respectively, the 20 items of MFQ, and MFSS are loaded into one factor.
In each Model B, Care, and Fairness items are loaded onto one factor, Loyalty, Authority, and Sanctity items are loaded onto a second factor.
In each Model C, Care and Fairness items are loaded onto one factor, Loyalty and Authority factors are loaded onto a second factor, and Sanctity items are loaded onto a third factor.
In each Model D, Care items are loaded onto one factor, Fairness items are loaded onto a second factor, Loyalty items are loaded onto a third factor, Authority items are loaded onto a fourth factor, and Sanctity items are loaded onto a fifth factor.
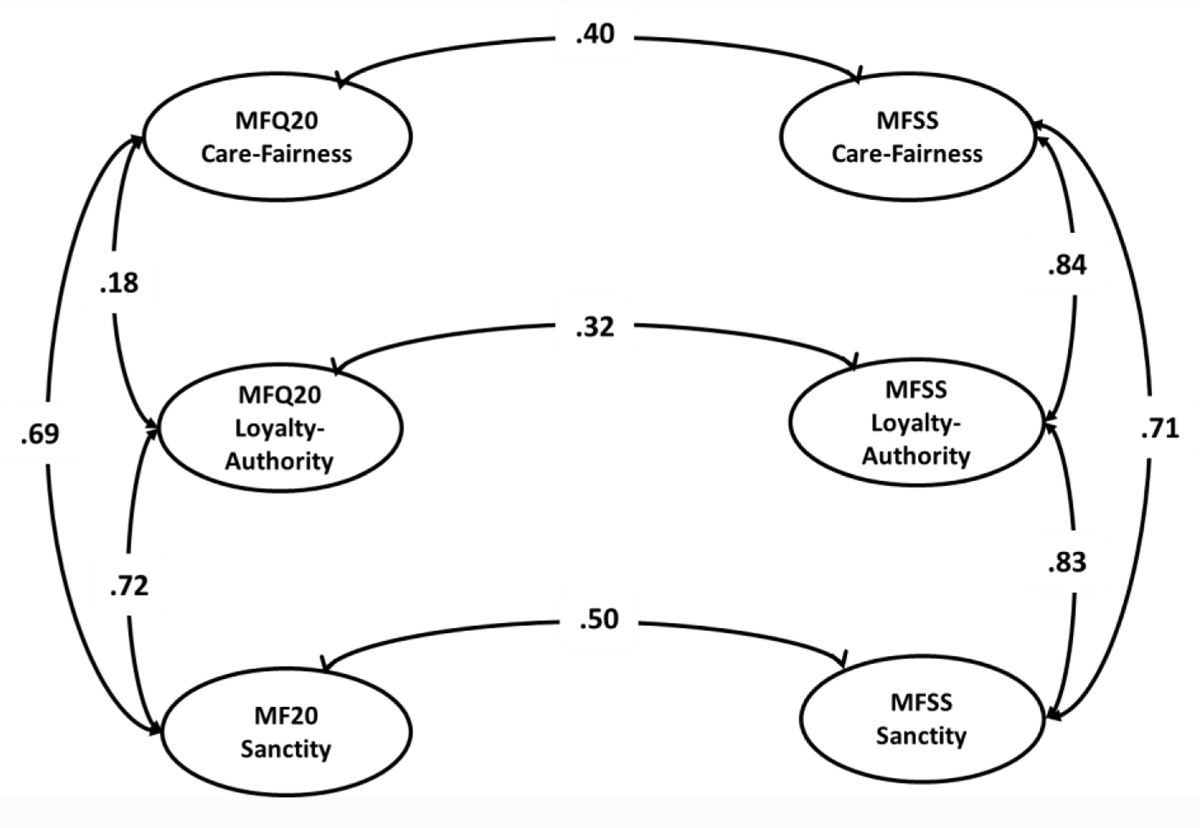
Figure 2
Pearson correlations among and between MFQ20 and MFSS three-factor model.
Note: Figure 2 represents Pearson correlations between and among MFQ20 and MFSS’ three-factor model Correlations among MFQ20 subscales are represented on the left, and correlations among MFSS subscales are on the right. For the sake of clarity and parsimony, correlations between MFQ20 and MFSS subscales are represented for their counterparts only. Correlations between non-equivalent subscales of both questionnaires are found in Table 3.
CFA-model fit indices: WLSMVχ2 = 4365.65, df = 725; χ2/df = 6.02; RMSEA = 0.05; WRMR = 2.28; CFI/TLI = 0.86/0.85.
Table 3
Standardized correlations between MFQ20 and MFSS subscales.
| MFQ-20 SUBSCALES THREE-FACTOR MODEL | MFSS SUBSCALES THREE-FACTOR MODEL | ||
|---|---|---|---|
| F1 CARE FAIRNESS | F2 LOYALTY AUTHORITY | F3 SANCTITY | |
| F1 = CARE FAIRNESS | .40*** | .21*** | .26*** |
| F2 = LOYALTY AUTHORITY | Ns | .32*** | .31*** |
| F3 = SANCTITY | .23*** | .34*** | .50*** |
[i] *** p < .001; ns = not significant.
Table 4
Results of measurement invariance of the three-factor model: MFQ20 items (N_females = 1062; N_males = 435).
| MODEL | WLSMVχ2 | RMSEA | WRMR | CFI/TLI | ΔCFI | DIFFtest Δχ2 (Δdf) | ||||
|---|---|---|---|---|---|---|---|---|---|---|
| VALUE | df | p | VALUE | 95%CI | p | |||||
| Configural model | 2051.68 | 334 | <.001 | .083 | [.079, .086] | .000 | 2.84 | .702/.661 | ||
| Weak invariance | 1965.53 | 351 | <.001 | .078 | [.075, .082] | .000 | 2.91 | .720/.696 | .02 | 54.16 (17) p < .001 |
Table 5
Results of measurement invariance of the five-factor model: MFSS (N_females = 1060; N_males = 436).
| MODEL | WLSMVχ2 | RMSEA | WRMR | CFI/TLI | ΔCFI | DIFFtestΔχ2 (Δdf) | ||||
|---|---|---|---|---|---|---|---|---|---|---|
| VALUE | df | p | VALUE | 95% CI | p | |||||
| Configural model | 1018.20 | 320 | <.001 | .054 | [.050, .058] | .038 | 1.60 | .946/.936 | –.01 | |
| Weak invariance | 909.48 | 335 | <.001 | .048 | [.044, .052] | .821 | 1.66 | .956/.950 | .02 | 22.55 (15) p < .094 |
| Strong invariance | 1244.73 | 446 | <.001 | .049 | [.046, .052] | .703 | 2.01 | .940/.950 | 379.08 (111) p < .001 | |