
Table 1
Monthly cohort means for morning-period (09:00–12:00) MVPA and step counts, and step:MVPA ratio (one kindergarten cohort; 11 months).
| MONTH | n | MVPA (min) | STEPS (09:00–12:00) | STEP:MVPA RATIO (steps/min MVPA) |
|---|---|---|---|---|
| January | 19 | 39.9 | 2,318 | 58.2 |
| February | 19 | 41.8 | 2,567 | 61.5 |
| March | 19 | 38.7 | 2,532 | 65.5 |
| April | 19 | 50.4 | 3,785 | 75.2 |
| May | 20 | 44.5 | 3,129 | 70.4 |
| June | 20 | 50.3 | 3,584 | 71.3 |
| July | – | –* | – | – |
| August | 17 | 42.8 | 2,784 | 65.1 |
| September | 20 | 55.8 | 3,808 | 68.2 |
| October | 20 | 53.2 | 4,648 | 87.3 |
| November | 20 | 47.3 | 3,481 | 73.6 |
| December | 20 | 44.7 | 3,151 | 70.4 |
[i] *July excluded: n = 4 children with valid morning-period data. Monthly n: Jan–Mar = 19; Apr–Jun = 19–20; Aug = 17; Sep–Dec = 20. The step:MVPA ratio = steps divided by MVPA min.
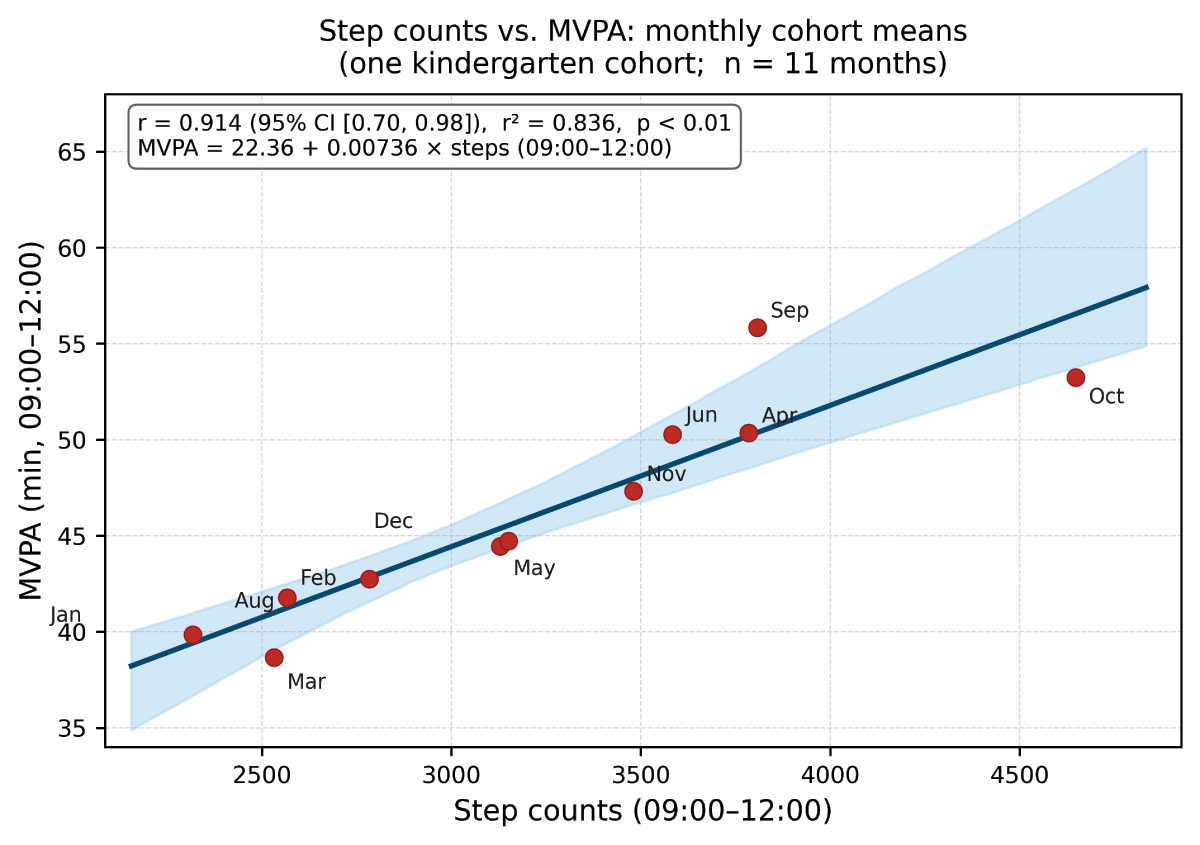
Figure 1
Scatter plot of monthly cohort means for step counts (x-axis) and MVPA (y-axis) across 11 months (one kindergarten cohort; n = 20 children; 10 boys, 10 girls). The regression line (MVPA = 22.36 + 0.00736 × morning-period steps) and bootstrapped 95% confidence interval band for the regression line (fitted mean) are shown. The shaded band is the 95% CI for the fitted mean and should not be interpreted as a prediction interval. Pearson r = 0.914 (95% CI [0.70, 0.98]), r² = 0.836 (83.6%), p < 0.01.