
Introduction
Monitoring physical activity (PA) in young children is a public-health priority, yet doing so continuously and at scale is methodologically demanding. Accelerometers capture the full spectrum of movement intensity and can derive metabolic-equivalent (MET)-based measures such as moderate-to-vigorous physical activity (MVPA), sedentary time, and energy expenditure (Evenson et al. 2008; Puyau et al. 2002). However, deriving MVPA requires intensity calibration and population-specific cut-points, and processing accelerometer data is resource-intensive, which limits its use for routine or large-scale surveillance. Step counts—whether from dedicated pedometers or from the step-counting function embedded in multi-sensor devices—are lower cost, simpler to process, and produce an intuitively interpretable metric that is actionable in public-health messaging (Tudor-Locke et al. 2002; Beets et al. 2010). A practical question for PA surveillance is therefore how much of the information contained in MVPA is also captured by the simpler step-count metric.
A key empirical question for PA surveillance is therefore how well step counts co-vary with MVPA at the group level when both are recorded by the same multi-function device. In school-aged children, moderate-to-strong individual-level associations (r ≈ 0.55–0.80) between daily step counts and MVPA have been reported (Rowlands et al. 1999). In preschool children, fewer studies have examined this relationship (Oliver et al. 2007), particularly at the group or cohort level over multiple months. Understanding group-level associations is important for surveillance applications—for example, using longitudinal step-count data to track trends in preschool MVPA across academic years or kindergarten cohorts. At the individual level, correspondence between step counts and MVPA has been reported in preschoolers (r = 0.67–0.73; Cardon and De Bourdeaudhuij 2007), and Tanaka and Tanaka (2009) reported step-MVPA associations in Japanese preschool children using triaxial accelerometry. However, the ecological association (i.e., correlation of monthly cohort means) between device-recorded step counts and MVPA has not been formally quantified in Japanese preschool settings, particularly when both metrics are derived from the same multi-function device.
Ecological correlation (i.e., correlation of group means over time) is distinct from individual-level correlation and may be higher or lower depending on how consistently the two measures co-vary across environmental and temporal conditions (Robinson 1950). Japanese kindergartens provide a particularly informative setting because PA levels vary substantially across months due to seasonal climate variation and cultural events (especially the autumn undokai sports festival), creating a wide range of monthly PA values over which the two measures can be compared.
The specific aims of this study were: (1) to quantify the ecological association between monthly cohort-mean step counts and MVPA when both are recorded by the same device; (2) to derive a simple linear regression equation describing the step–MVPA relationship at the cohort-month level; and (3) to examine the consistency of the step:MVPA ratio across months.
Methods
Participants and Setting
Data were drawn from one kindergarten cohort (n = 20 children; 10 boys, 10 girls; aged approximately 5–6 years) attending a single kindergarten in Japan. Both the step count and MVPA metrics were recorded simultaneously by the same wearable triaxial device (Active Style Pro HJA-750C; Omron Healthcare, Kyoto, Japan), worn on the waist throughout kindergarten hours. Ethical approval was granted by the Ethics Committee of Jin-ai Women’s Junior College (Receipt No. 21). Written informed consent was obtained from the parents or guardians of all participating children.
Accelerometry: MVPA Measurement
The device recorded triaxial acceleration in 10-second epochs (Vale et al. 2009). METs were estimated using the device’s built-in proprietary algorithm (Omron Healthcare, Kyoto, Japan). Epochs recording zero activity values were treated as non-wear and excluded from all computations. Morning-period MVPA (09:00–12:00) was defined as the number of valid epochs with METs ≥3.0, converted to minutes; epochs with METs >18 were excluded as physiological artefacts. A threshold of METs ≥3.0 is commonly used in preschool accelerometry research (Evenson et al. 2008; Freedson et al. 2005; Oliver et al. 2007). Valid wearing days required at least 10 valid (non-zero) epochs within the 09:00–12:00 window. All analyses were restricted to the morning activity period (09:00–12:00), corresponding to the active play period before afternoon napping and early departures. Unrounded monthly cohort means were used in all analyses; reported values in Table 1 are rounded for presentation. Monthly cohort means were computed from all children with at least one valid wearing day per month. July was excluded due to very low valid-day participation (n = 4 children), leaving 11 months for analysis (January–June, August–December).
Table 1
Monthly cohort means for morning-period (09:00–12:00) MVPA and step counts, and step:MVPA ratio (one kindergarten cohort; 11 months).
| MONTH | n | MVPA (min) | STEPS (09:00–12:00) | STEP:MVPA RATIO (steps/min MVPA) |
|---|---|---|---|---|
| January | 19 | 39.9 | 2,318 | 58.2 |
| February | 19 | 41.8 | 2,567 | 61.5 |
| March | 19 | 38.7 | 2,532 | 65.5 |
| April | 19 | 50.4 | 3,785 | 75.2 |
| May | 20 | 44.5 | 3,129 | 70.4 |
| June | 20 | 50.3 | 3,584 | 71.3 |
| July | – | –* | – | – |
| August | 17 | 42.8 | 2,784 | 65.1 |
| September | 20 | 55.8 | 3,808 | 68.2 |
| October | 20 | 53.2 | 4,648 | 87.3 |
| November | 20 | 47.3 | 3,481 | 73.6 |
| December | 20 | 44.7 | 3,151 | 70.4 |
[i] *July excluded: n = 4 children with valid morning-period data. Monthly n: Jan–Mar = 19; Apr–Jun = 19–20; Aug = 17; Sep–Dec = 20. The step:MVPA ratio = steps divided by MVPA min.
Pedometry: Step Count Measurement
The same device recorded integrated step counts per 10-second interval; morning-period step totals (09:00–12:00) were summed across all valid wearing epochs for each day. Monthly cohort means for morning-period step counts were computed in parallel with MVPA means, using the same wearing-day inclusion criterion. July step count data were excluded to maintain paired monthly observations across all analyses.
Statistical Analysis
The primary analysis was a Pearson product-moment correlation (r) between the 11 paired monthly morning-period cohort means for MVPA and step counts. Simple linear regression was performed with step counts as the independent variable and MVPA as the dependent variable; the intercept, slope, and coefficient of determination (r²) are reported. The 95% confidence interval band for the regression line shown in Figure 1 was estimated by bootstrap resampling (1,000 iterations) of the 11 paired monthly observations. To address the potential non-independence of consecutive monthly observations from a single cohort, the Durbin-Watson statistic (d) was computed from regression residuals to test for first-order autocorrelation (Savin and White 1977). A leave-one-month-out (LOMO) sensitivity analysis was also conducted: each month was excluded in turn and Pearson r and the regression slope were recomputed from the remaining 10 months, to assess whether any single month unduly influenced the overall association. The morning-period step:MVPA ratio (steps per minute of MVPA) was computed for each month to assess the temporal consistency of the relationship between the two measures. All analyses were performed in Python (version 3.10). Statistical significance was set at alpha = 0.05.
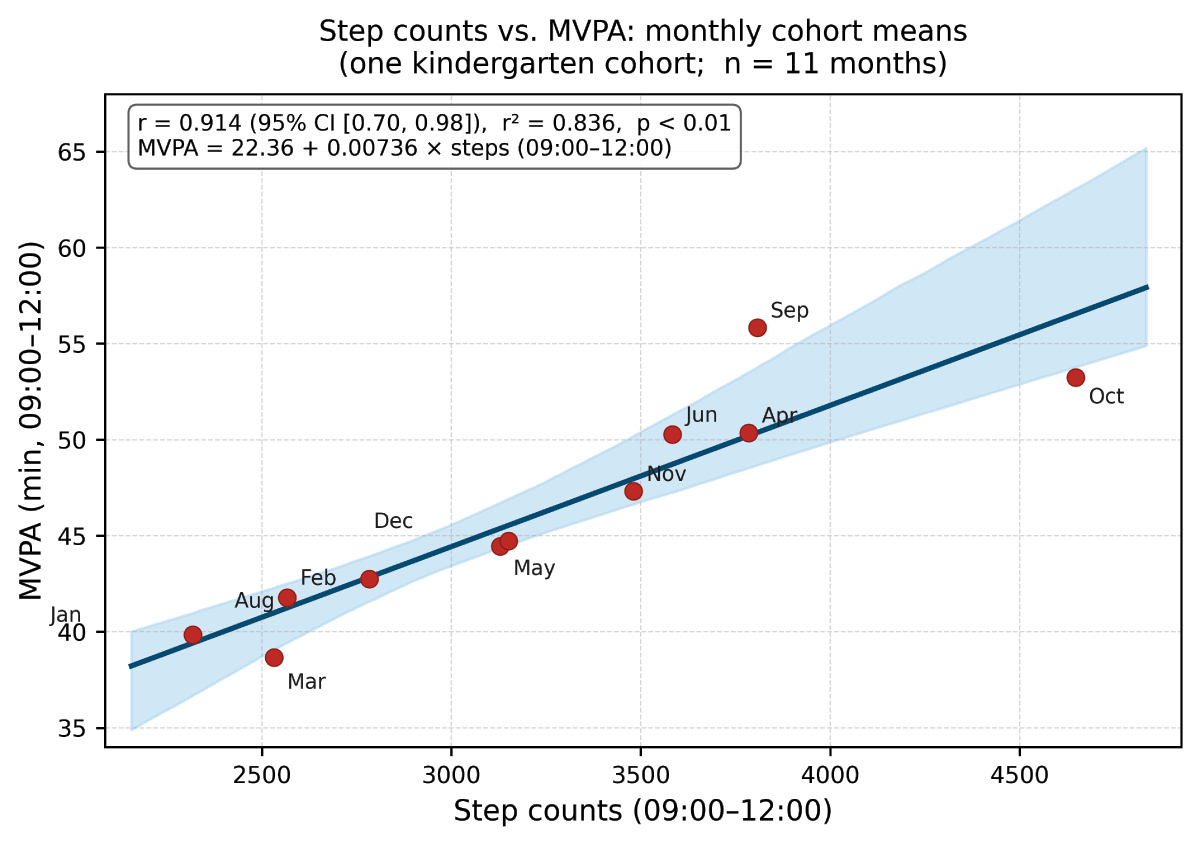
Figure 1
Scatter plot of monthly cohort means for step counts (x-axis) and MVPA (y-axis) across 11 months (one kindergarten cohort; n = 20 children; 10 boys, 10 girls). The regression line (MVPA = 22.36 + 0.00736 × morning-period steps) and bootstrapped 95% confidence interval band for the regression line (fitted mean) are shown. The shaded band is the 95% CI for the fitted mean and should not be interpreted as a prediction interval. Pearson r = 0.914 (95% CI [0.70, 0.98]), r² = 0.836 (83.6%), p < 0.01.
Results
Morning-Period MVPA and Step Count Data
Morning-period cohort means (09:00–12:00) for MVPA and step counts across the 11 analysis months are presented in Table 1. MVPA ranged from 38.7 min (March) to 55.8 min (September), a range of 17.1 min. Morning-period step counts ranged from 2,318 steps (January) to 4,648 steps (October), a range of 2,330 steps. Both measures reached their highest values in autumn (MVPA: September; steps: October). The seasonal nadir differed between measures: step counts were lowest in January (winter), whereas MVPA was lowest in March (early spring), suggesting that seasonal and academic-calendar influences on activity intensity are not fully captured by ambulatory volume alone.
Ecological Correlation Between Morning-Period Step Counts and MVPA
The Pearson correlation between monthly morning-period MVPA and step counts across 11 months was r = 0.914 (95% CI [0.70, 0.98]; r² = 0.836, 83.6%; p < 0.01), indicating that approximately 84% of the variance in monthly morning-period MVPA was explained by morning-period step counts at the cohort level. The simple linear regression equation was: MVPA (min) = 22.36 + 0.00736 × steps (09:00–12:00) (95% CI for slope: 0.00490–0.00981; p < 0.01). This equation represents a within-device, cohort-level relationship for this specific sample and should not be generalised as a universal step-to-MVPA conversion. The scatter plot and fitted regression line are presented in Figure 1.
Step:MVPA Ratio
The step:MVPA ratio (steps per minute of MVPA) varied across months from a minimum of 58.2 steps/min (January) to a maximum of 87.3 steps/min (October), with a mean of approximately 69.7 steps/min across the 11 analysis months. October showed the highest ratio (87.3 steps/min), which may be consistent with lower-intensity ambulatory activity following the undokai sports festival, though no activity logs were collected to confirm this. January and February showed the lowest ratios (58.2 and 61.5, respectively), possibly reflecting higher-intensity movement relative to step volume in winter months, although the specific causes cannot be determined from the available data.
Sensitivity and Independence Analyses
To assess potential temporal autocorrelation among the 11 monthly observations, the Durbin-Watson statistic was computed from regression residuals (d = 2.73). This value fell within the inconclusive range for the present sample size (n = 11, k = 1; critical bounds dL = 0.93, dU = 1.32; 4 – d = 1.27), providing no conclusive evidence of systematic autocorrelation. The leave-one-month-out sensitivity analysis confirmed that the ecological association was robust across all months: with each month excluded in turn, Pearson r ranged from 0.899 (excluding January) to 0.962 (excluding September), and all 11 analyses remained statistically significant (p < 0.01). September and October were the most influential observations — excluding September raised r to 0.962, and excluding October increased the regression slope to 0.00926 steps per minute of MVPA — reflecting the wide PA range contributed by the undokai period rather than statistical artefact. These analyses support the robustness of the overall association despite the small number of monthly observations.
Discussion
This study reports an ecological association of r = 0.914 between morning-period step counts and MVPA in Japanese preschool children, explaining approximately 84% of variance in monthly MVPA (r² = 0.836, 83.6%). Importantly, both metrics were derived from the same device, which must be considered when interpreting the magnitude of this association. At the group level, these findings indicate that step counts can track relative changes in preschool MVPA across months, while not replacing MVPA for absolute activity quantification.
Practical Implications for Physical Activity Surveillance
These findings have practical implications for researchers and public-health practitioners working in kindergarten settings. Where intensity-calibrated accelerometer processing is impractical for routine or large-scale monitoring, the simpler step-count metric captured approximately 84% of the variance in MVPA at the group level, making it adequate for detecting relative differences or changes in PA within this single cohort across the observed months. However, step counts cannot substitute for MVPA when the primary outcome is absolute activity intensity. Because measurements in the present study were restricted to the morning period (09:00–12:00), they do not support direct comparison with the WHO recommendation of ≥60 minutes of MVPA per day (World Health Organization 2020), which applies to total daily activity. The regression equation reported here (MVPA = 22.36 + 0.00736 × morning-period steps) represents a within-device, group-level relationship for this single cohort; with external validation using standalone pedometers paired with separate accelerometers, an analogous step-based approach could potentially enable low-cost PA surveillance in kindergarten settings.
Interpretation of the Ecological Association
The ecological association of r = 0.914 between morning-period step counts and MVPA is stronger than individual-level associations previously reported in preschoolers (r = 0.67–0.73; Cardon and De Bourdeaudhuij 2007) and school-aged children (r ≈ 0.55–0.80; Rowlands et al. 1999). It should be emphasised, however, that both step counts and MVPA were derived from the same device (Active Style Pro HJA-750C); this precludes treating the result as independent instrument validation, and the observed r may partly reflect shared sensor signals, overlapping processing algorithms, and correlated measurement error inherent to a single-device design. Several additional factors likely contribute to the high ecological r: the ecological design reduces individual measurement noise, and the wide dynamic range of monthly PA values (MVPA range: 17.1 min; steps range: 2,330 steps) creates favourable conditions for detecting strong associations. These findings should therefore be interpreted as describing the co-variation of two outputs from a single device at the group-month level. The remaining unexplained variance (1 – r² = 0.164) reflects the conceptual non-equivalence of the two constructs: steps capture all ambulatory movement regardless of intensity, whereas MVPA requires sustained effort above a metabolic threshold.
The Step:MVPA Ratio and Its Variation
The step:MVPA ratio (mean 69.7 steps/min, range 58.2–87.3) was not constant across months, indicating that the relationship between the two outputs of the device varies with the type of PA being performed. October showed the highest ratio (87.3 steps/min), consistent with a period following the undokai sports festival during which lower-intensity ambulatory activity may predominate, though no activity logs or direct observations were available to confirm this interpretation. The lowest ratios in January (58.2) and February (61.5) may reflect higher-intensity movement relative to step volume during winter months; however, the absence of qualitative data on indoor activity patterns limits causal inference. This ratio variability should be considered when using step-count values to estimate MVPA levels in preschool settings.
Limitations
Several limitations should be noted. First, the ecological correlation design—using monthly cohort means rather than individual-level daily data—limits inference to the group level; individual-level associations may differ from the ecological correlation. Second, inference is restricted to a single cohort (n = 20) observed at one kindergarten across one calendar year; the regression equation cannot be generalised to other kindergartens, age groups, or academic years without external validation. Third, July was excluded due to low participation, which may introduce seasonal bias. Fourth, both MVPA and step counts were derived from the same device (Omron HJA-750C); this single-device design means that the two outputs share sensor signals, internal processing, and wear-time, all of which may introduce correlated measurement error and inflate the observed association relative to independent-instrument designs. The observed r = 0.914 should therefore be interpreted as an upper-bound estimate of ecological co-variation rather than independent instrument agreement, and replication using standalone pedometers paired with separate accelerometers is required. Fifth, this study did not examine sex as a moderating variable (the cohort comprised 10 boys and 10 girls); future studies should investigate whether the step-MVPA relationship differs by sex in preschool settings, in line with SAGER guidelines. Sixth, the valid wearing-day criterion of at least 10 valid 10-second epochs per day (equivalent to at least 100 seconds of wear) is considerably lower than typical accelerometry wear-time thresholds recommended for preschool children (e.g., at least 3 hours of registered wear); this lenient criterion was retained to maintain comparability with the original dataset, but may have introduced inclusion of days with minimal wear, potentially biasing monthly means.
Conclusions
Morning-period step counts (09:00–12:00) and MVPA from the same device showed a strong positive ecological association at the cohort-month level in Japanese preschool children (r = 0.914, r² = 0.836). These findings support the use of step counts as a practical group-level indicator for tracking relative monthly changes in preschool PA in kindergarten settings. However, the step:MVPA ratio varied across months (range: 58.2–87.3 steps/min MVPA), and inference is restricted to this single cohort and ecological level. Future studies should examine individual-level associations in larger, more diverse preschool samples, incorporate sex as a moderating variable, and validate step-to-MVPA regression equations in independent cohorts using standalone pedometers paired with separate accelerometers.
Use of Artificial Intelligence
Generative artificial intelligence (AI) tools were used to assist with data-analysis scripting, literature review, text editing, and manuscript preparation. All AI-generated content was reviewed, verified, and edited by the author, who takes full responsibility for the integrity and accuracy of all reported findings and the final manuscript.
Ethics and Consent
Ethical approval was granted by the Ethics Committee of Jin-ai Women’s Junior College (Receipt No. 21). Written informed consent was obtained from the parents or guardians of all participants.
Data Accessibility Statement
Data are available on request from the corresponding author.