
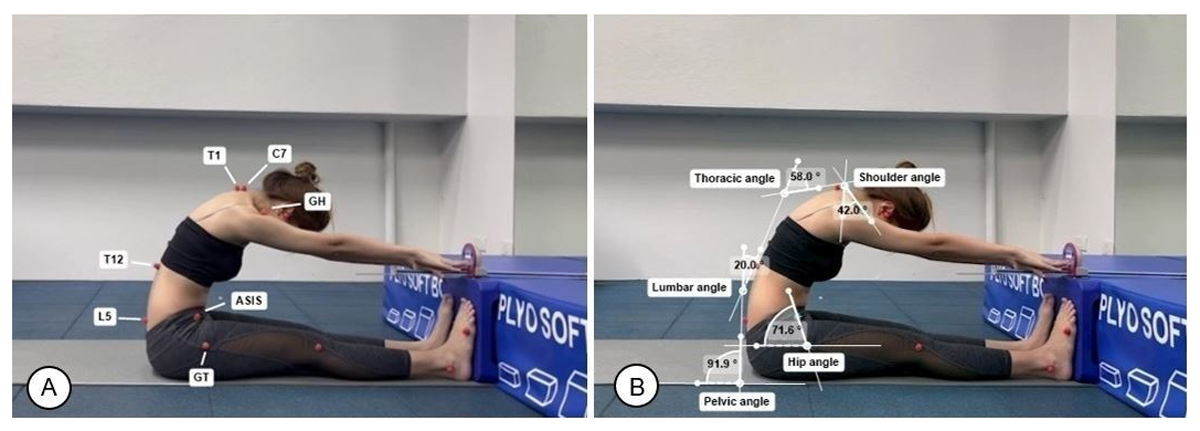
Figure 1
Body segment angle measurement during the sit and reach test. (A) Anatomical marker positions showing C7, T1, T12, L5, GH, ASIS, and GT. (B) Calculation of shoulder, thoracic, lumbar, pelvic, and hip angles using Kinovea software.
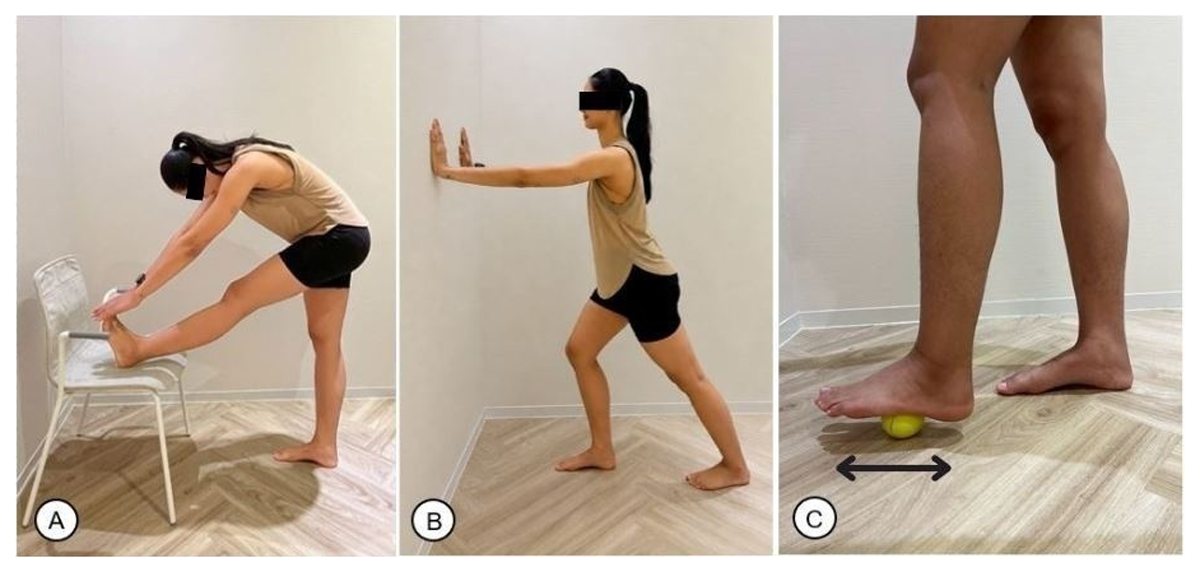
Figure 2
Intervention procedures. (A) Active hamstring stretching performed with the knee fully extended and the ankle dorsiflexed while the heel was placed on a chair. (B) Active gastrocnemius stretching performed against a wall with the stretching knee maintained in full extension. (C) Plantar fascia mobilization performed using a tennis ball rolled along the plantar surface of the foot from the heel toward the metatarsal heads with emphasis on the medial longitudinal arch.
Table 1
General characteristics of participants (Mean ± SD).
| CHARACTERISTICS | APCS+PFM (N = 9) | APCS (N = 9) | P |
|---|---|---|---|
| BMI (kg/m²) | 19.76 ± 1.12 | 19.64 ± 0.84 | 0.501 |
| Height (cm) | 159.33 ± 3.74 | 163.67 ± 5.02 | 0.417 |
| Weight (kg) | 50.22 ± 4.18 | 52.67 ± 3.39 | 0.664 |
| Sitting hours (h) | 7.67 ± 2.18 | 8.89 ± 2.26 | 0.260 |
[i] APCS+PFM: active posterior chain stretching combined with plantar fascia mobilization, APCS: active posterior chain stretching, BMI: body mass index.
Table 2
Body segment angular excursions during the sit and reach test across time and between groups (mean ± SD).
| BODY SEGMENT ANGLES (°) | GROUP | INTERACTION EFFECTS | TIME | GROUP | ||||||||
|---|---|---|---|---|---|---|---|---|---|---|---|---|
| APCS+PFM (T0) | APCS+PFM(T1) | APCS+PFM(T2) | APCS(T0) | APCS(T1) | APCS(T2) | p | ES | p | ES | p | ES | |
| Shoulder | 31.74 ± 12.48 | 34.49 ± 14.11 | 37.88 ± 14.66 | 31.96 ± 10.92 | 27.88 ± 12.07 | 33.73 ± 11.36 | 0.14 | 0.05 | 0.08 | 0.12 | 0.53 | 0.20 |
| Thoracic | 24.14 ± 10.22 | 24.09 ± 11.51 | 22.77 ± 10.63 | 16.16 ± 6.36 | 14.74 ± 9.18 | 16.92 ± 8.62 | 0.26 | 0.09 | 0.42 | 0.03 | 0.07 | 0.04 |
| Lumbar | 11.20 ± 4.78 | 12.06 ± 4.99 | 12.86 ± 6.19 | 6.70 ± 4.67 | 8.53 ± 5.75 | 8.65 ± 5.04 | 0.32 | 0.42 | 0.61 | 0.09 | 0.09 | 0.11 |
| Pelvic | 14.57 ± 6.49 | 14.92 ± 3.87 | 19.34 ± 4.50*,** | 18.74 ± 5.99 | 19.92 ± 7.57 | 22.47 ± 7.79*,** | 0.09 | 0.12 | 0.02 | 0.07 | 0.08 | 0.14 |
| Hip | 9.13 ± 2.31 | 9.73 ± 1.61 | 13.49 ± 4.86*,** | 11.16 ± 4.46 | 11.64 ± 4.40 | 13.57 ± 5.14*,** | 0.15 | 0.02 | 0.04 | 0.28 | 0.34 | 0.08 |
[i] APCS+PFM: active posterior chain stretching combined with plantar fascia mobilization, APCS: active posterior chain stretching, T0: baseline, T1: immediately post-intervention, T2: after three consecutive days, ES: effect size. *p < 0.05, within-group comparison between T0 and T2. **p < 0.05, within-group comparison between T1 and T2.
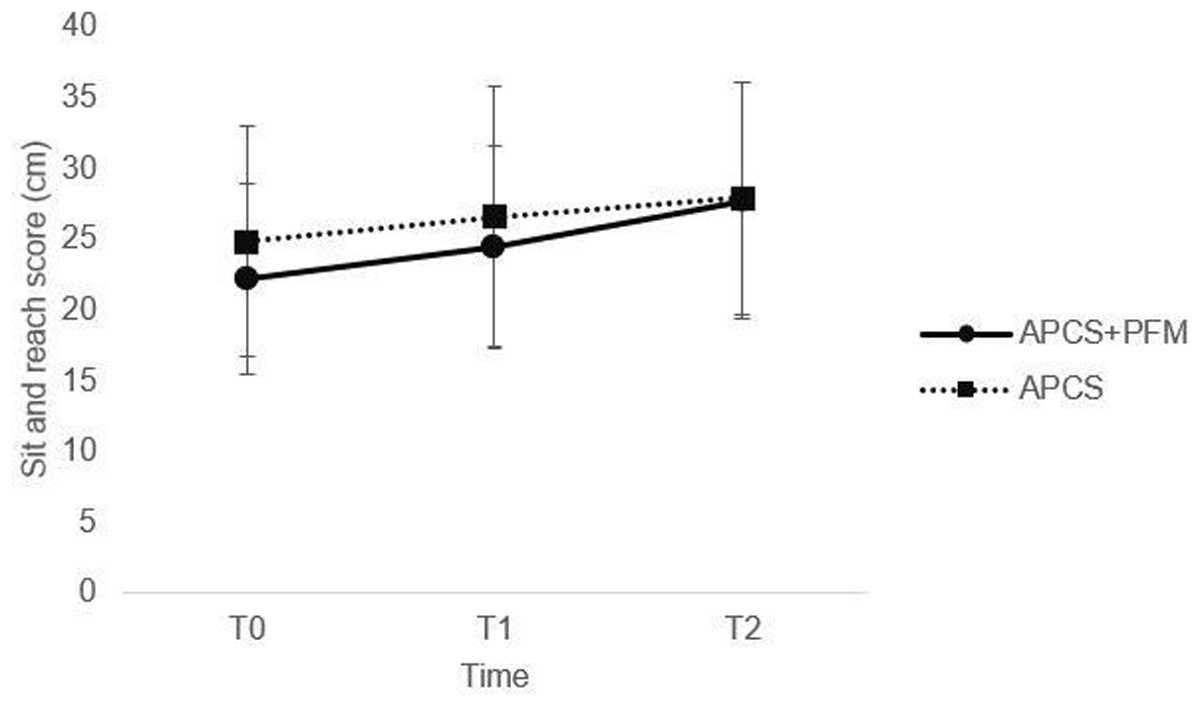
Figure 3
Sit and reach score excursion for the APCS and APCS+PFM groups at T0, T1, and T2. APCS: active posterior chain stretching, APCS+PFM: active posterior chain stretching combined with plantar fascia mobilization.
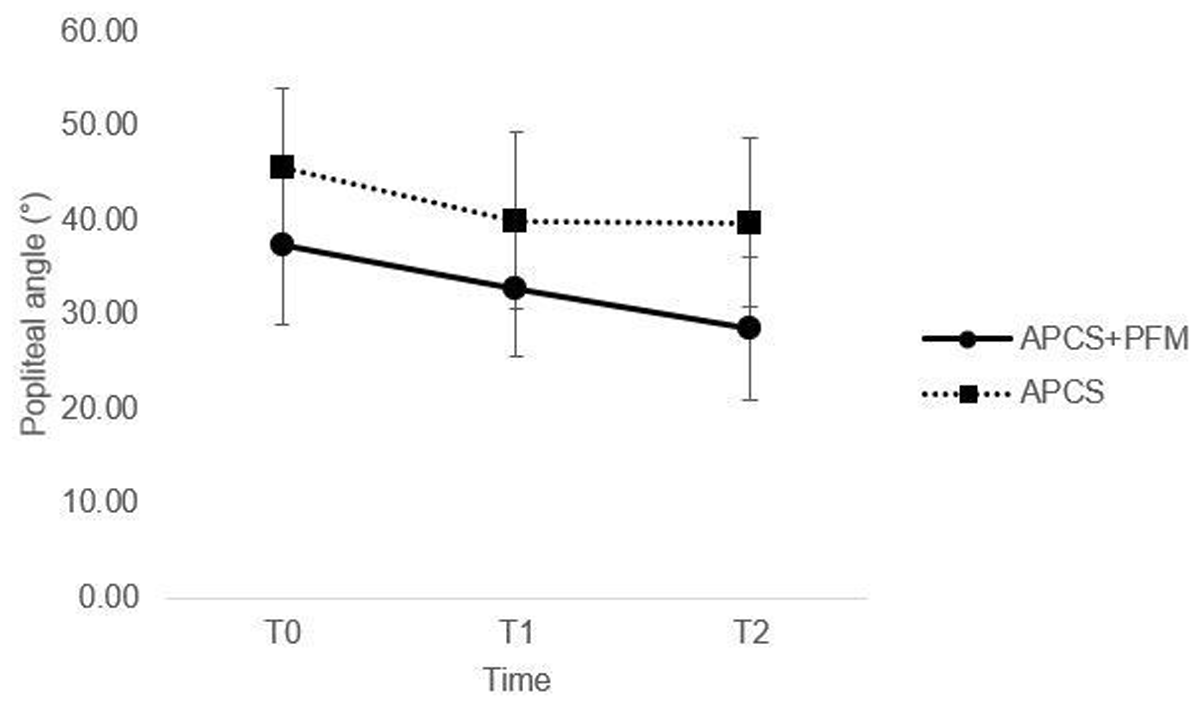
Figure 4
Popliteal angle for the APCS and APCS+PFM groups at T0, T1, and T2.
APCS: active posterior chain stretching, APCS+PFM: active posterior chain stretching combined with plantar fascia mobilization.