
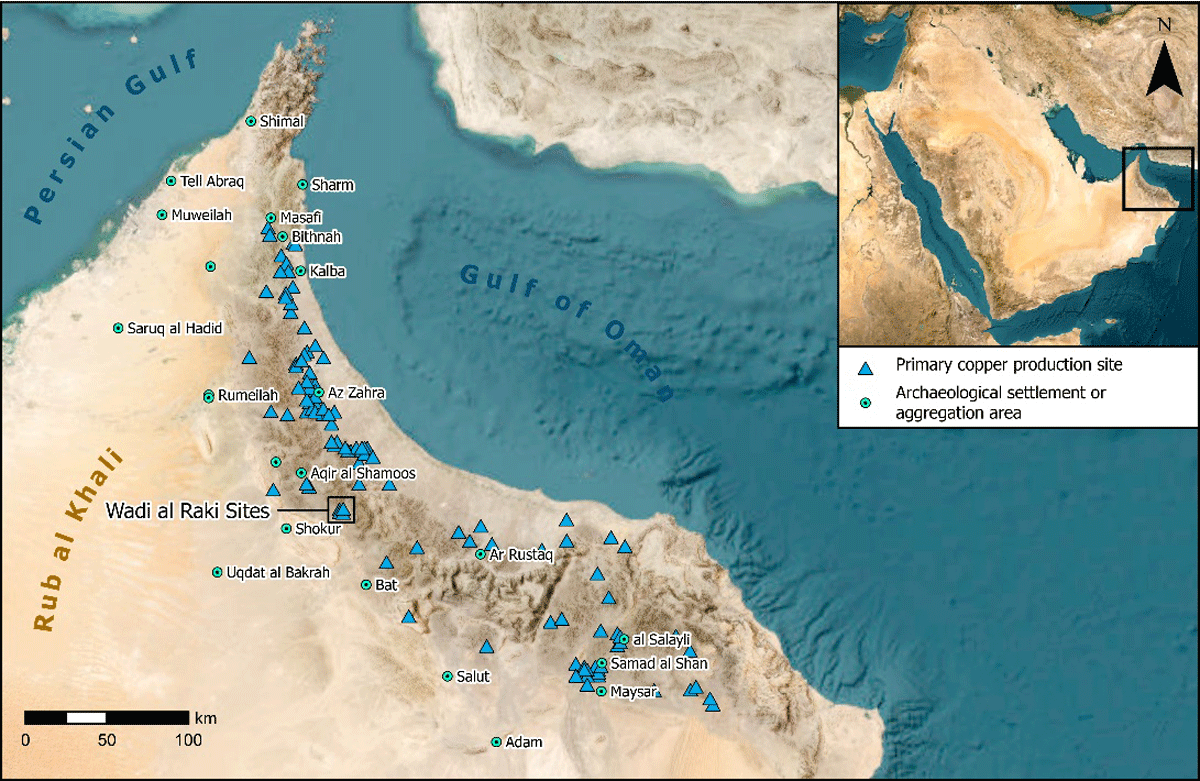
Figure 1
Iron Age and Early Islamic primary copper production sites and associated aggregation areas in southeastern Arabia.
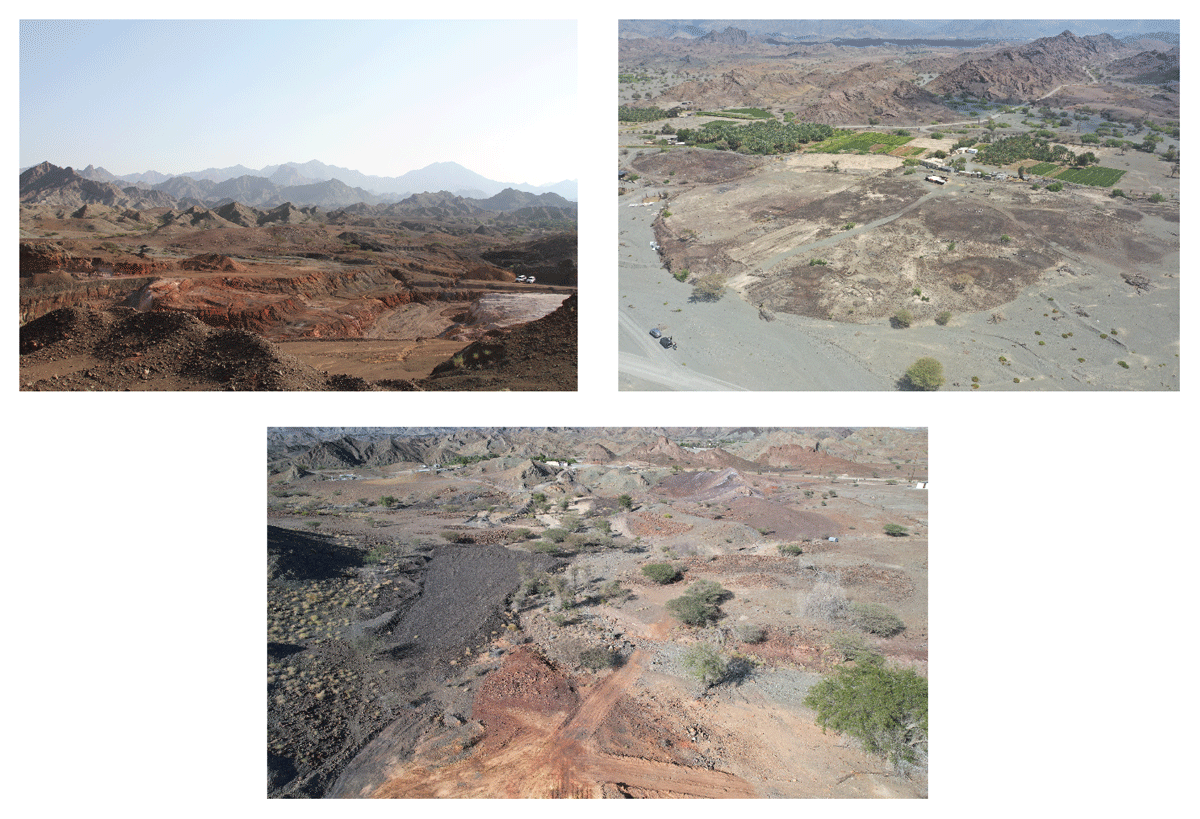
Figure 2
Sites from top to bottom, left to right: Raki 1, Raki 2, and Tawi Raki.
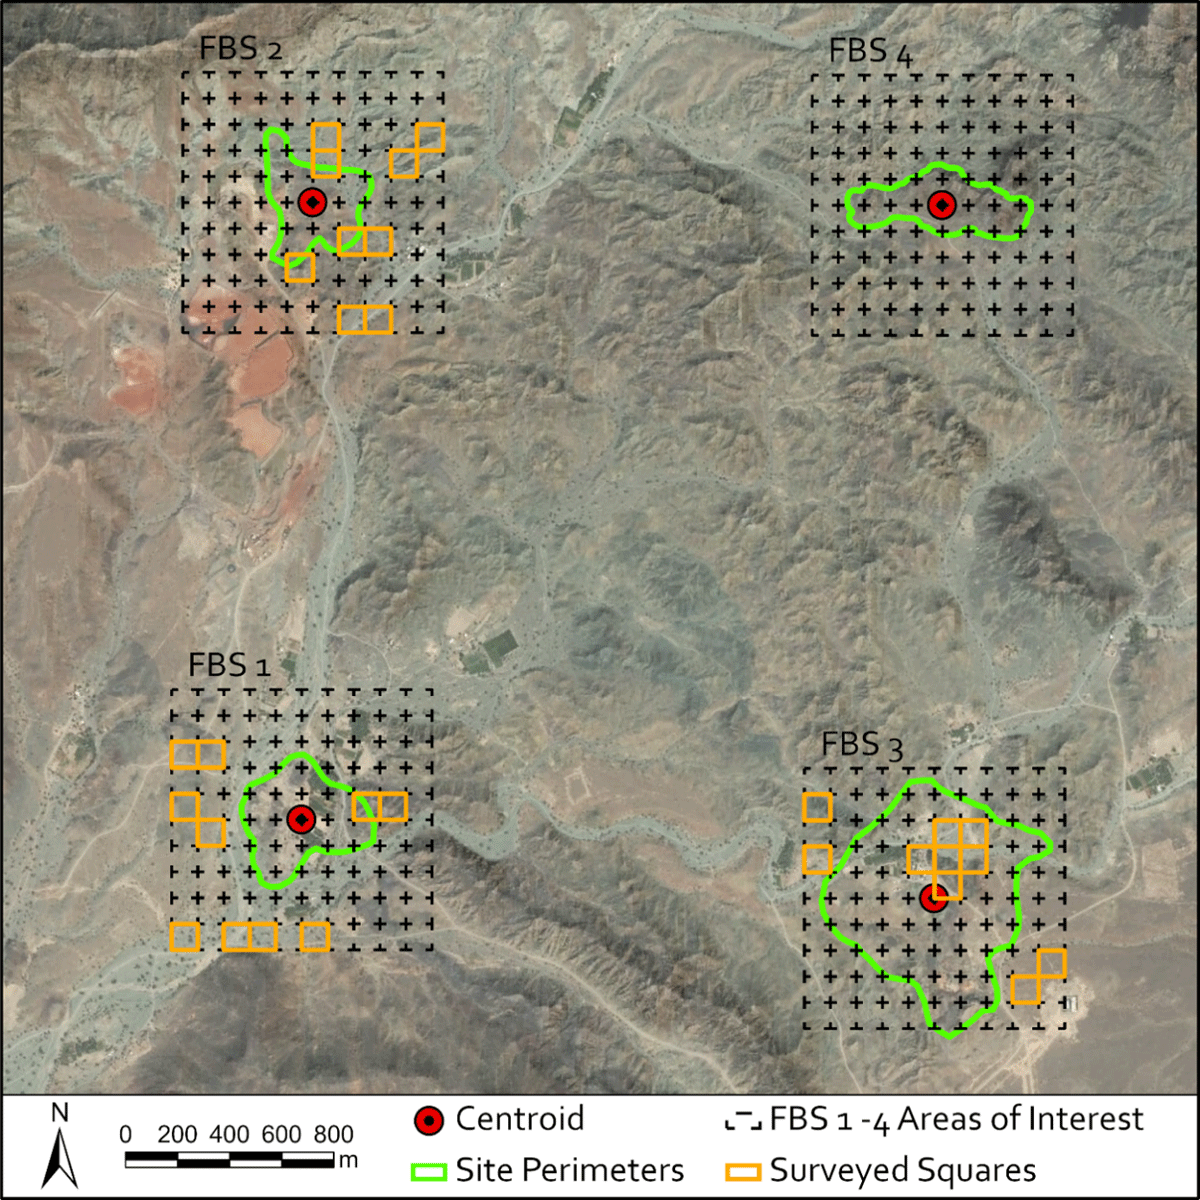
Figure 3
Fuel biomass survey in Wadi Raki. FBS1: Raki 2, FBS2: Raki 1, FBS3: Tawi Raki, FBS4: Qurun al Khabab.
Table 1
Recorded data sheet for individual trees.
| CATEGORIES | ATTRIBUTES |
|---|---|
| Tree | Numerical |
| Area of Interest | FBS 1, FBS 2, FBS 3, FBS 4, or FBS 5 |
| Square | Numerical |
| Stems at Stump Height | Numerical |
| Stems at Breast Height | Numerical |
| Circumference of Stem(s) at Stump Height | cm values divided by commas |
| Circumference of Stem(s) at Breast Height | cm values divided by commas |
| Tree Height | Numerical |
| Tree ID | Genus and Species |
| Confidence of ID | Possible, Probable, Likely, or Unidentified |
| Condition | Alive, Dead, or Horizontal |
| Landform Class | Bedrock slope, scree slope, plateau, gravel terrace, bedrock terrace, wadi silts, wadi channel |
| Slope | 0–5 degrees, 5–15 degrees, 15–30 degrees, >30 degrees |
| Deposition | Alluvium, colluvium, or other |
| Camera Type | Make and Model |
| Photo Range | Unique Photo Number |
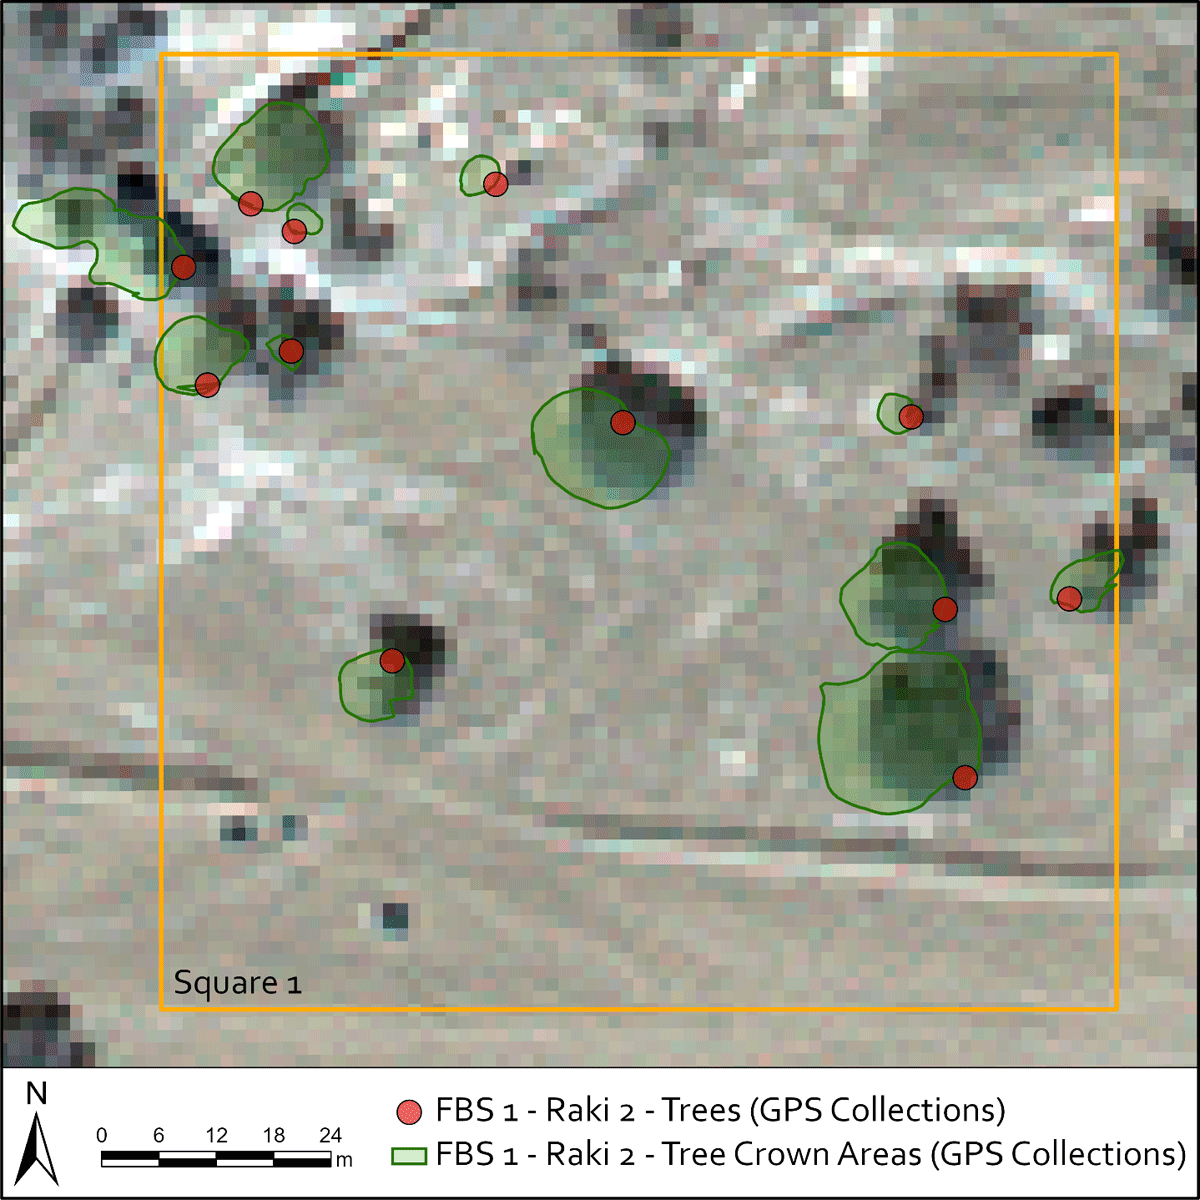
Figure 4
Point and Polygon features recorded in the field. Note that the misalignment between the GPS-collected polygons representing tree canopies and the satellite imagery basemap is a consequence of inaccuracy of satellite imagery georeferencing.
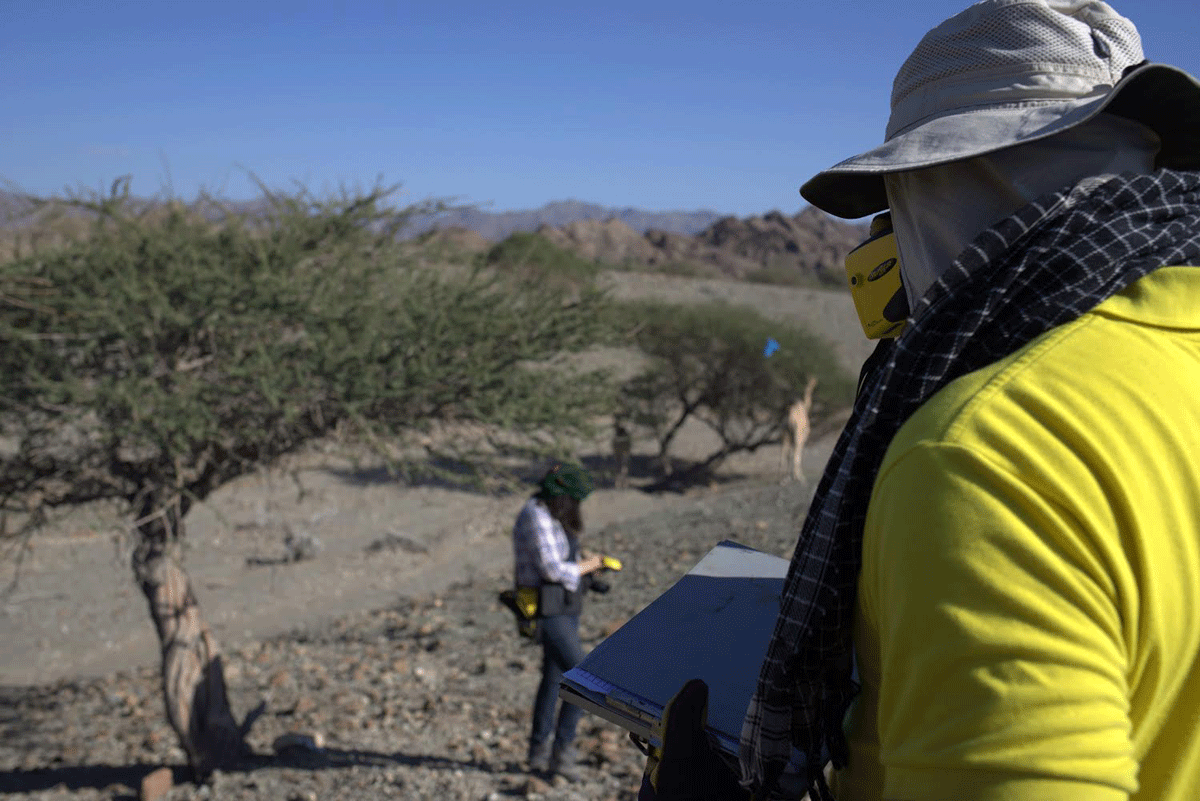
Figure 5
Fuel biomass survey measurements of trees being taken in the field.
Table 2
Above Ground Biomass (AGB) allometric equations estimated from DBH: Diameter at Breast Height 1.3 m above ground (cm) H: Height (m) stem_Circum: Stem Circumference and DSH: Diameter at Stump Height (cm) measured at 0.3 above ground.
| TREE ID | FORMULA | REFERENCE |
|---|---|---|
| Acacia ehrenbergiana | 1.07 exp(–4.23 + 1.63 ln(DBH) + 1.05 ln(H) – 1.89 ln(0.72) | (Moussa et al. 2019) |
| Acacia nilotica subsp. indica | 0.071 + 0.0818(DBH2 × H) | (Maguire et al. 1990) |
| 6.9319 × (DSH) – 43.731 | (Raizada et al. 2007) | |
| Acacia tortilis | exp(–3.043) × (DBH)1.411 × (H)2.266 | (Feyisa et al. 2018) |
| Acacia gerrardii subsp. negevensis | 2.692 × (Stem_Circum) – 2.699 | (Shackleton and Scholes 2011) |
| Ziziphus spina-christi | 1.07 exp(–4.23 + 1.63 ln(DBH) + 1.05 ln(H) – 1.89 ln(0.72) | (Moussa et al. 2019, Vreugdenhil et al. 2012) |
| Salvadora persica | 1.07 exp(–4.23 + 1.63 ln(DBH) + 1.05 ln(H) – 1.89 ln(0.6) | (Moussa et al. 2019) |
| Prosopis cineraria | (Jaiswal et al. 2018) | |
| Moringa peregrina2 | – 852.262 + 433.93 ln(DSH) | (Abdoul-Salam et al. 2021) |
Table 3
Regression models and their parameters.
| PARAMETERS | INDIVIDUAL LOG-LOG MODEL | AGGREGATE LINEAR MODEL | AGGREGATE LOG-LOG MODEL |
|---|---|---|---|
| Coefficients (Slope, Intercept) | 1.255, 0.400 | 7.294, –62.078 | 1.272, 0.176 |
| Slope and Intercept [Lower 95% to Upper 95%] | [1.082 to 1.428] [–0.161 to 0.963] | [4.844 to 9.745] [–1069 to 945] | [1.087 to 1.456] [–0.819 to 1.159] |
| Multiple R | 0.673 | 0.768 | 0.941 |
| R Square | 0.454 | 0.59 | 0.885 |
| Adjusted R Square | 0.451 | 0.574 | 0.881 |
| Standard Error | 1.203 | 1717.90 | 0.522 |
| F | 204.669 | 37.446 | 200.825 |
| Significance F | 3.434E-34 | 1.811E-06 | 9.669E-14 |
| t-Stat | 1.403, 14.306 | –0.127, 6.119 | 0.354, 14.171 |
| P-value | 0.161, 3.434E-34 | 0.9, 1.811E-06 | 0.726, 9.669E-14 |
| Observations | 248 | 28 | 28 |
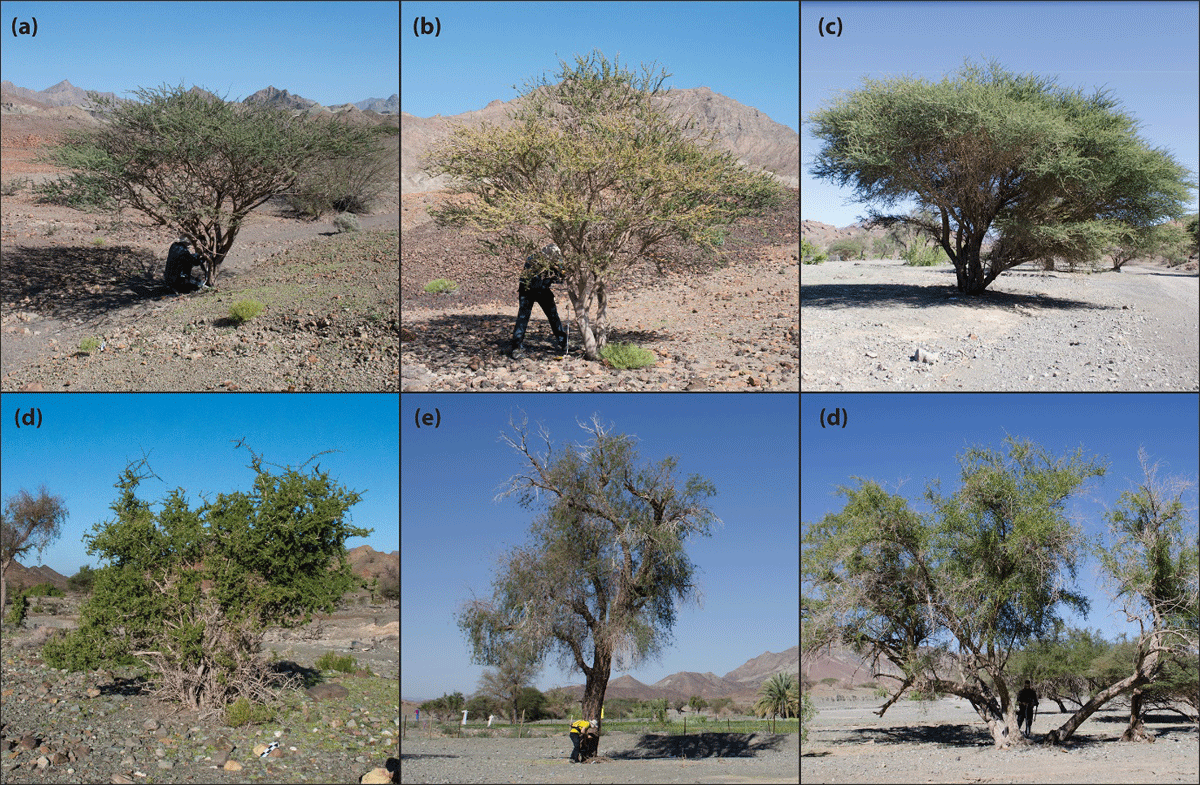
Figure 6
Six most common tree species observed during the Wadi Raki biomass survey. (a) Acacia tortilis, (b) Acacia nilotica, (c) Acacia ehrenbergiana, (d) Salvadora persica, (e) Prosopis cineraria, and (f) Ziziphus spina-christi.
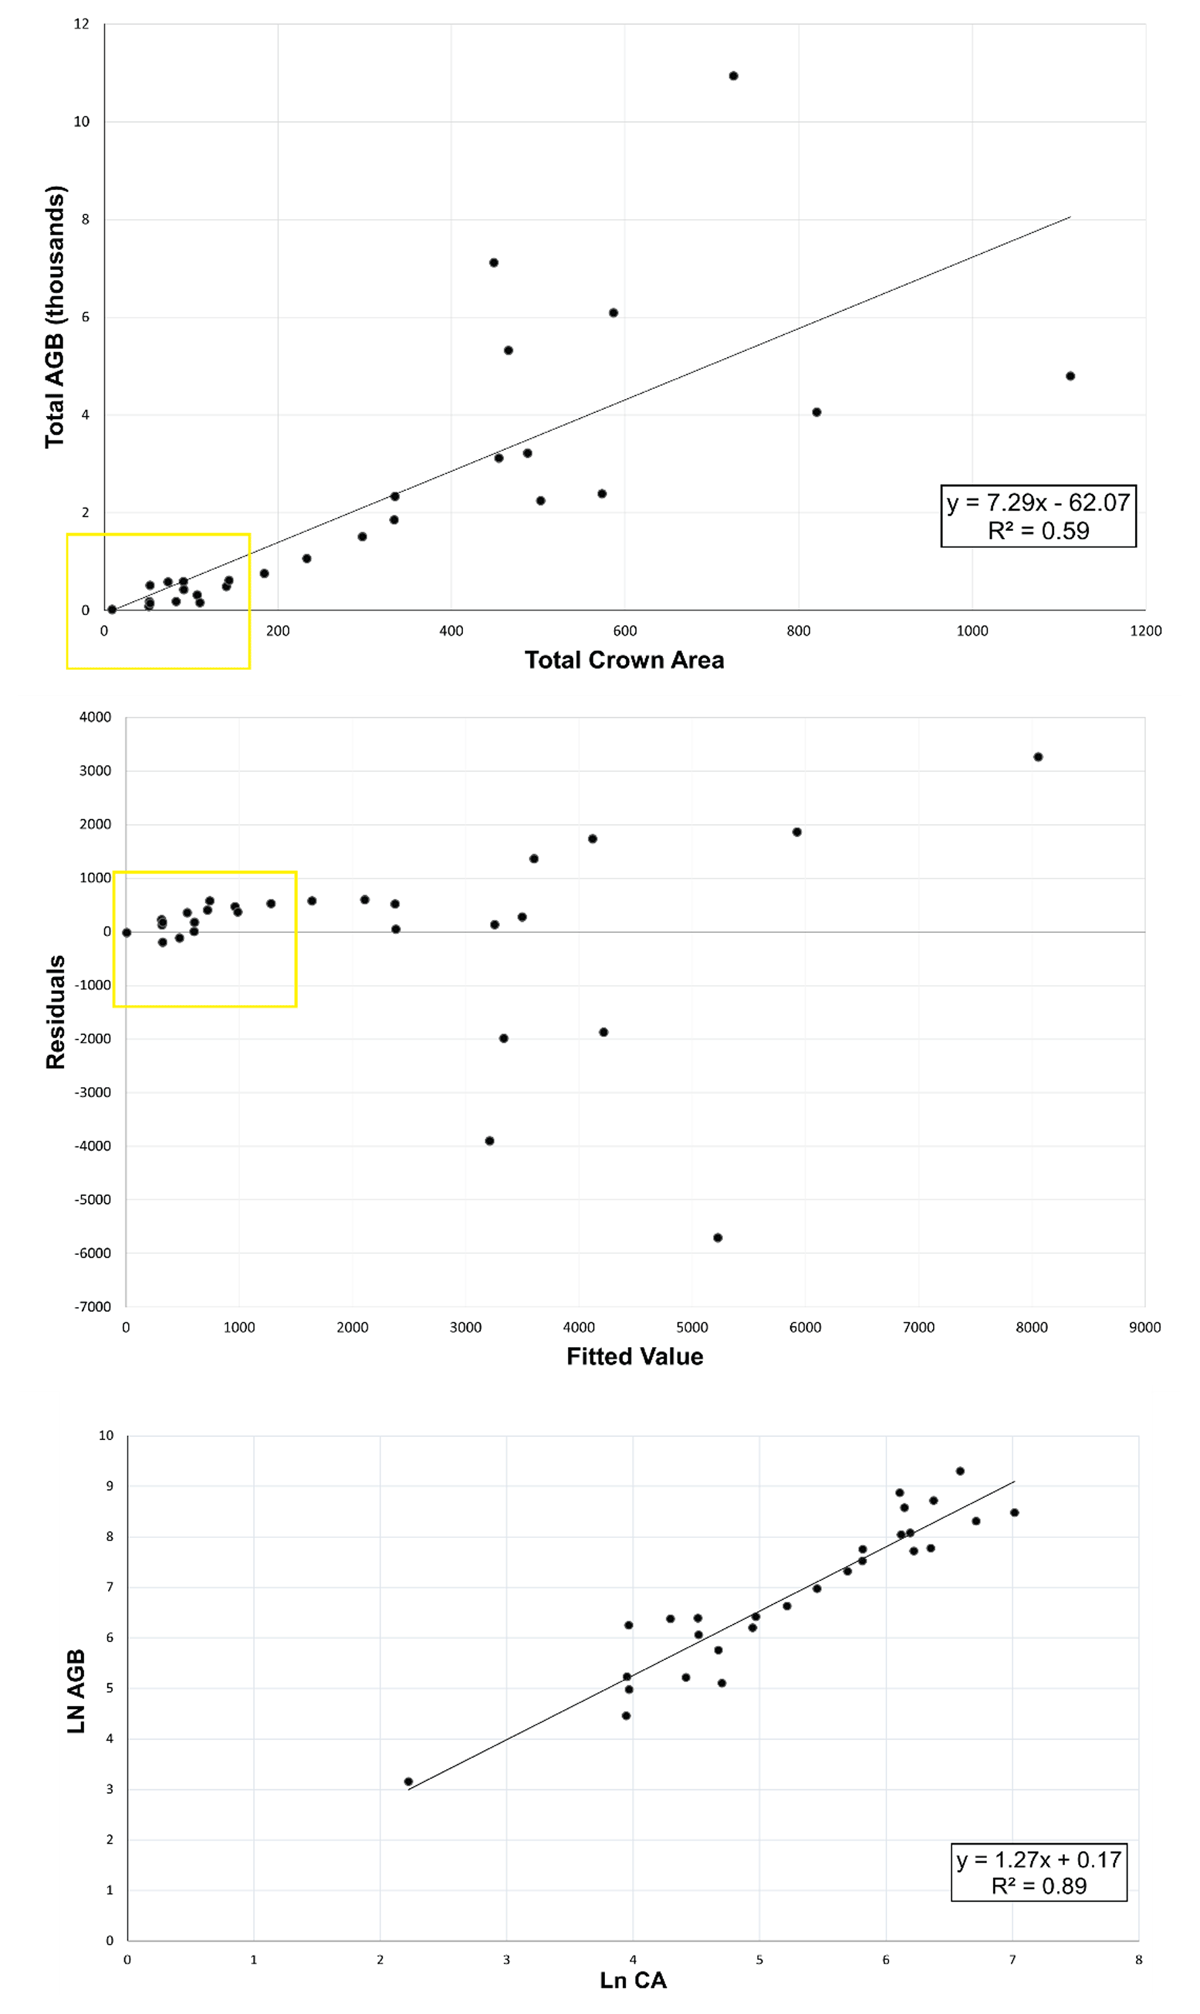
Figure 7
The regression analysis process on the aggregated crown areas (CA) in square meters vs. aggregated above-ground biomass (AGB) in kilograms in 27 observed 100 × 100 m areas of land. There are some overlapping points in the yellow rectangles.

Figure 8
Biomass availability in the vicinity of Wadi Raki divided by half-hour walking time intervals.
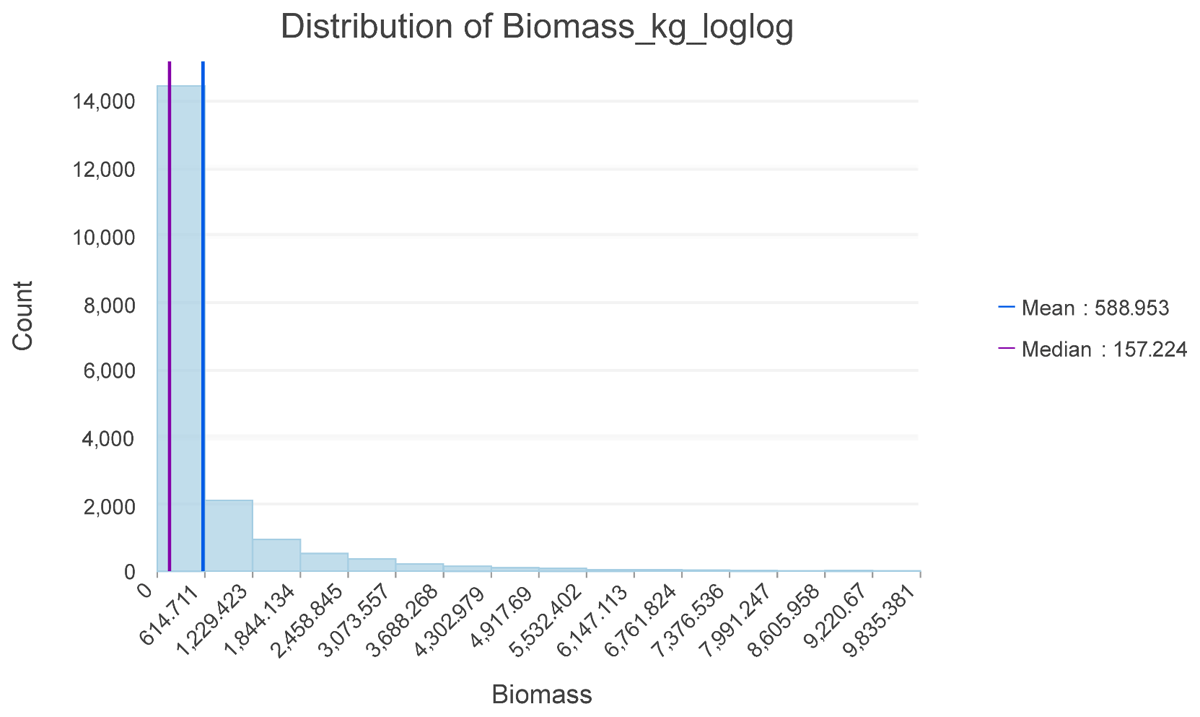
Figure 9
Histogram of woody biomass (kg) per hectare.