
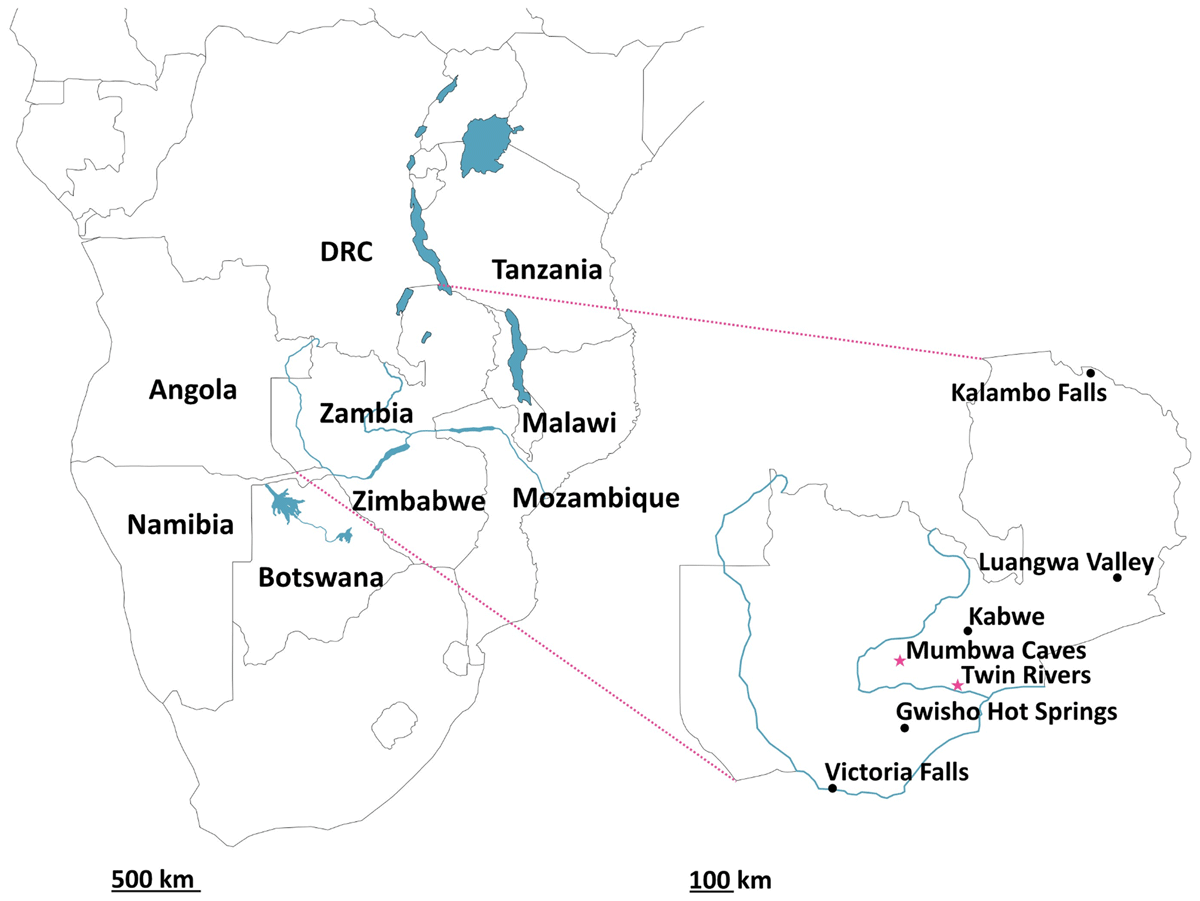
Figure 1
Left: Map of southern Africa highlighting the South-Central African region with major current water bodies; Right: Map of Zambia highlighting key archaeological sites. Those included in this study (Twin Rivers and Mumbwa Caves) are highlighted with pink stars.
Table 1
Tooth enamel samples analysed in this study; numbers in brackets indicate the number of individual teeth/fragments sampled. For more detailed sample information please see the supplementary data.
| SITE NAME | EXCAVATION | TAXON | |
|---|---|---|---|
| CAVITY | LEVEL | ||
| Twin Rivers | E5/F5 | 1 | Rhinocerotid (3), Suid (1), Equid (1), Bovid (1) |
| 2 | Bovid (1) | ||
| E4/F4 | 1 | Suid (3), Equid (6) | |
| 3 | Rhinocerotid (3), Equid (1), Bovid (1) | ||
| E5/E6 | 1 | Rhinocerotid (3), Equid (1) | |
| 2 | Rhinocerotid (2), Equid (4) | ||
| 3 | Rhinocerotid (5), Suid (2), Bovid (4) | ||
| 4 | Rhinocerotid (1), Suid (2), Equid (3) | ||
| 5 | Equid (1), Bovid (1) | ||
| G5 | N/A | Bovid (3) | |
| Mumbwa Caves | N/A | N/A | Suid (10), Equid (4), Bovid (13) |
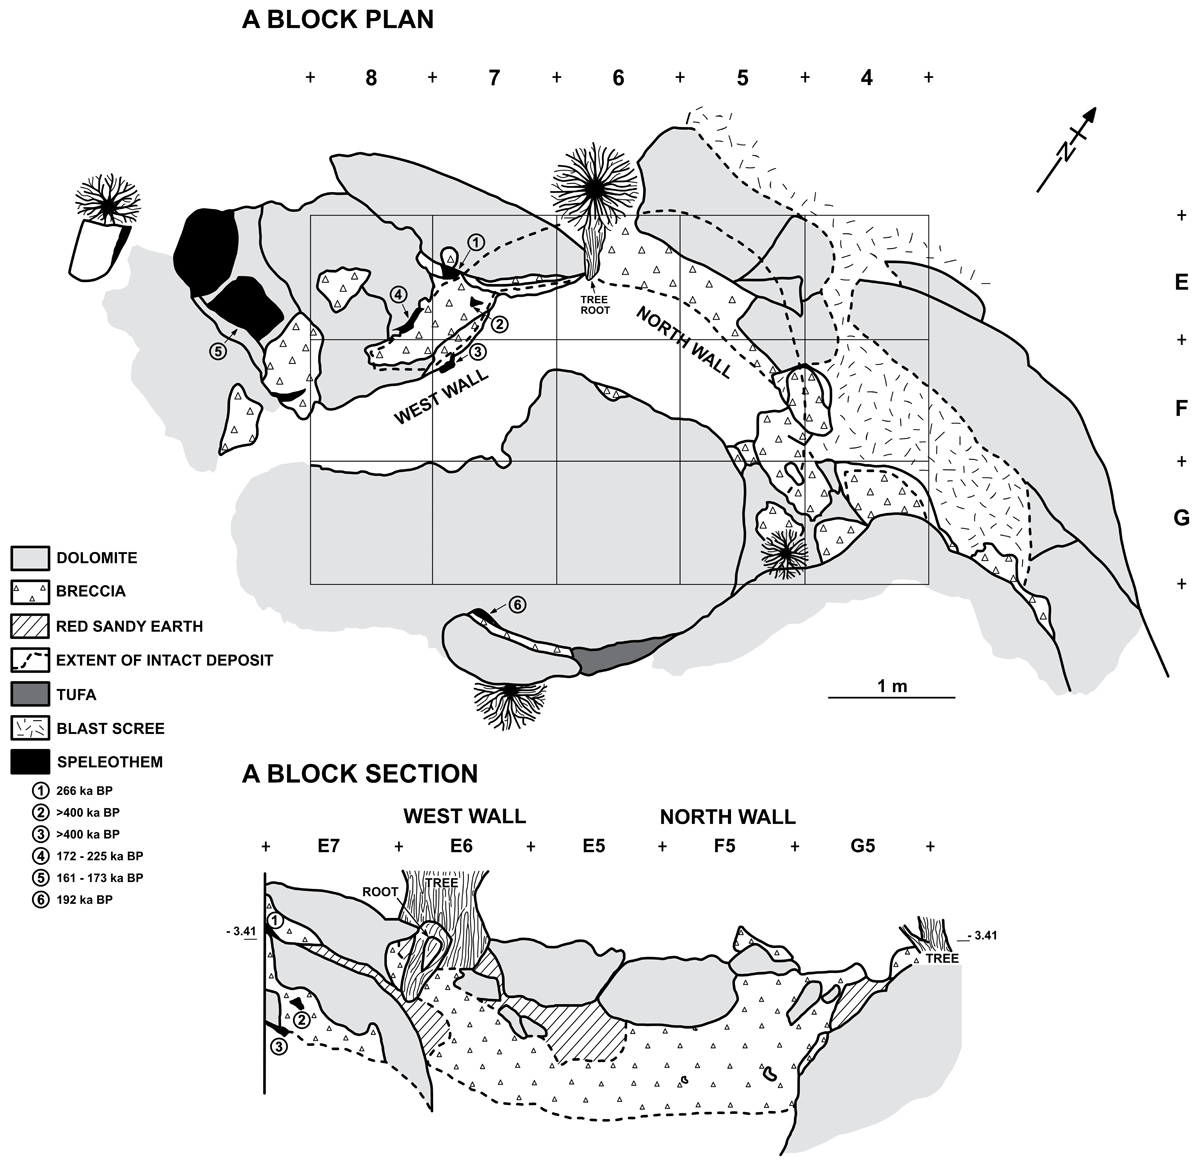
Figure 2
Plan and section (west and north walls) of Twin Rivers A Block excavated in 1999. Previously dated speleothem samples are shown with associated uranium-thorium dates (sample 1 = 266 ka BP, sample 2 = >400 ka BP, sample 3 = >400 ka BP, sample 4 = 172–225 ka BP, sample 5 = 161–173 ka BP, sample 6 = 192 ka BP). All tooth enamel samples analysed for AAG were excavated from red sandy earth sediments which filled multiple discrete cavities between the cave walls and the rim of the intact breccia. Due to the irregular shape of the cave passage and deposits within, not all excavation cavities and no excavation levels are visible in this section.
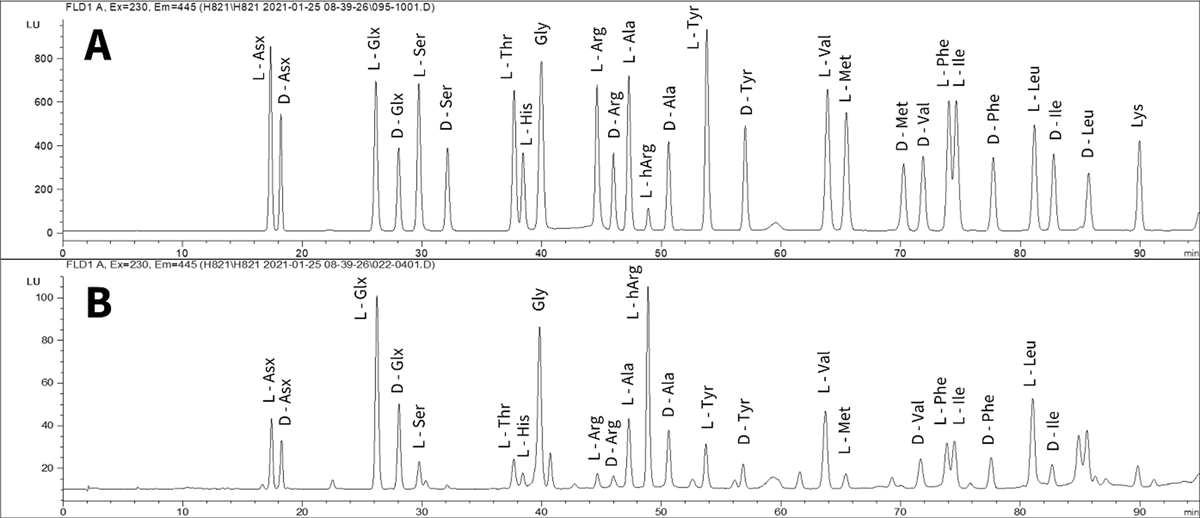
Figure 3
Example chromatograms of A – 0.5 standard, B – rhinocerotid tooth enamel THAA sample.

Figure 4a
a Relationship between racemisation values (D/L) in free (FAA) vs total hydrolysable (THAA) amino acids, for subsample replicates, in two taxonomic groups of enamel samples (A – rhinocerotid; B – equid), for two example amino acids (Asx, Glx). Mumbwa Caves samples were all excavated from one deposit (Barham, 2000). Twin Rivers samples were excavated from four areas within the A Block cave passage (Barham, 2000).
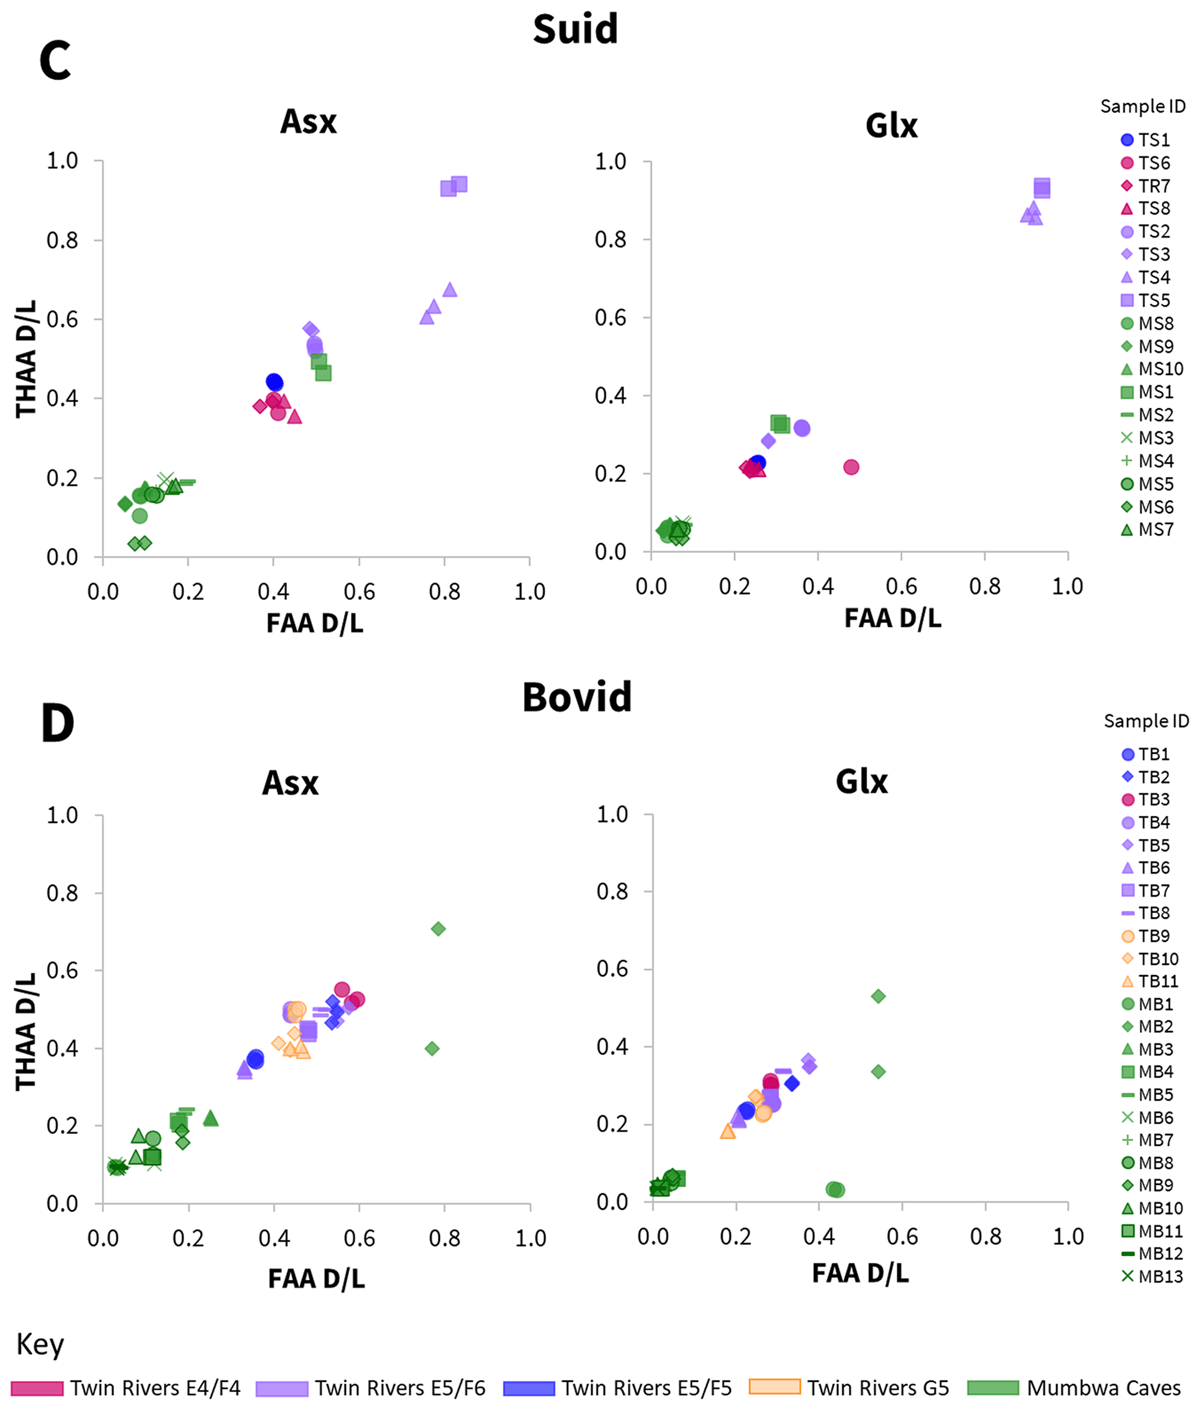
Figure 4b
Relationship between racemisation values (D/L) in free (FAA) vs total hydrolysable (THAA) amino acids, for subsample replicates, in two taxonomic groups of enamel samples (C – suid; D – bovid), for two example amino acids (Asx, Glx). Mumbwa Caves samples were all excavated from one deposit (Barham, 2000). Twin Rivers samples were excavated from four areas within the A Block cave passage (Barham, 2000).
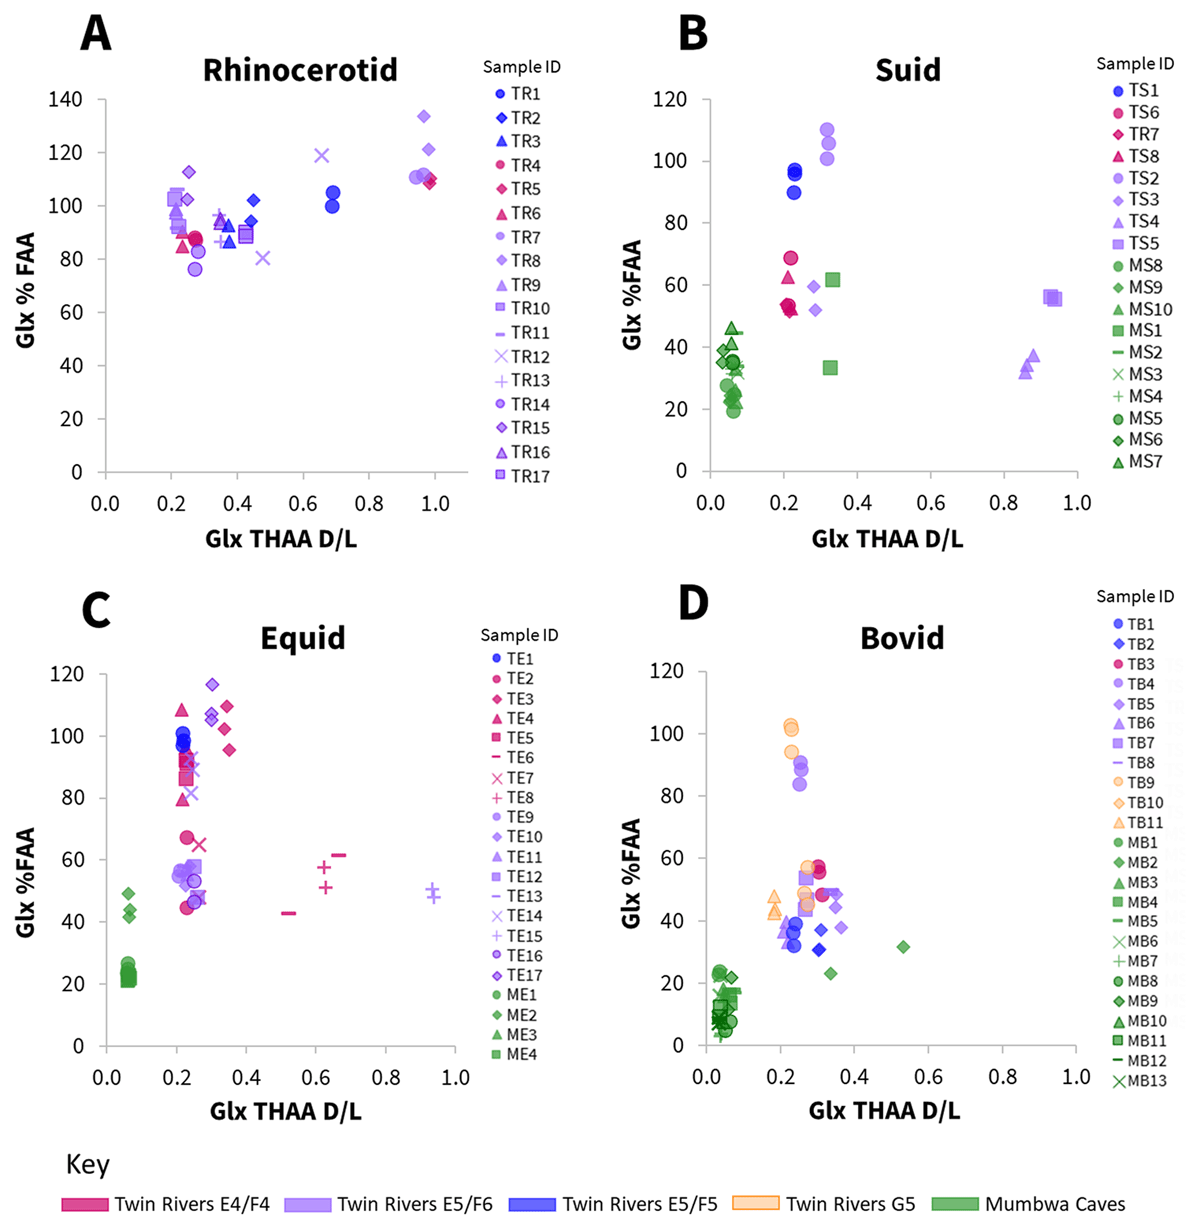
Figure 5
Relationship between racemisation values (THAA D/L) in Glx vs the percentage of free Glx, for subsample replicates, in four taxonomic groups of fossil enamel samples (A – rhinocerotid; B – suid; C – equid; D – bovid). Mumbwa Caves samples were all excavated from one deposit (Barham, 2000). Twin Rivers samples were excavated from four areas within the A Block cave passage (Barham, 2000).

Figure 6
Covariance plots of average Glx racemisation vs serine decomposition in four taxonomic groups (A – rhinocerotid; B – suid; C – equid; D – bovid). No rhinocerotid samples were excavated from Mumbwa Caves, which all came from one deposit (Barham, 2000). Twin Rivers samples were excavated from four areas within the A Block cave passage (Barham, 2000).
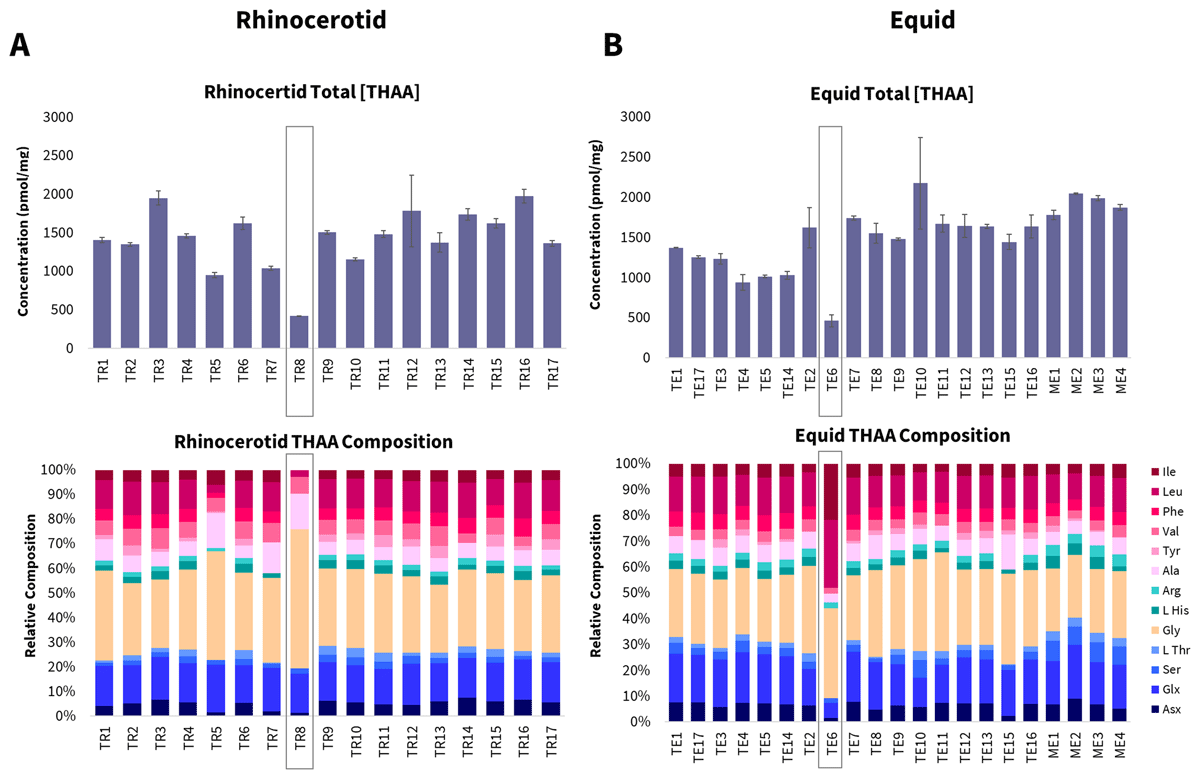
Figure 7
Top – average total amino acid concentration, bottom – relative amino acid composition, for each enamel sample (A – rhinocerotid; B – equid). Boxes highlight low concentrations and atypical composition profiles.
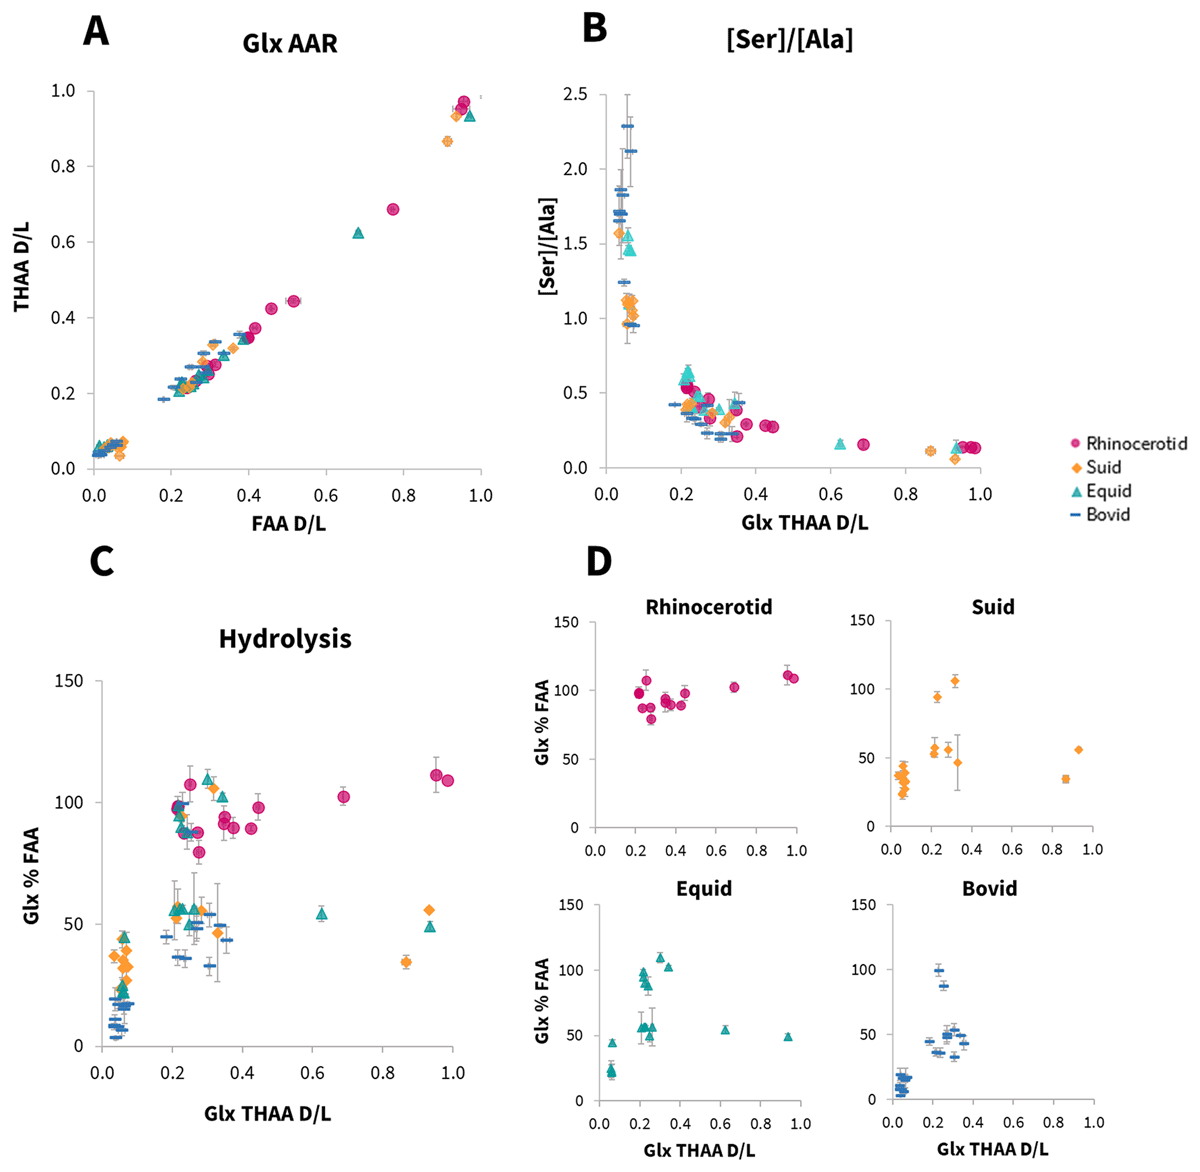
Figure 8
Investigation of family level taxonomic effect on the intra-crystalline protein degradation trends in rhinocerotid, suid, equid and bovid enamel samples. A – relationship between the average free (FAA) vs total hydrolysable (THAA) Glx racemisation values (D/L). B – relationship between serine decomposition vs total hydrolysable (THAA) Glx racemisation values (D/L). C – overlay of the relationship between percentage free (%FAA) Glx vs total hydrolysable (THAA) Glx racemisation values (D/L). D – individual taxonomic plots from C.
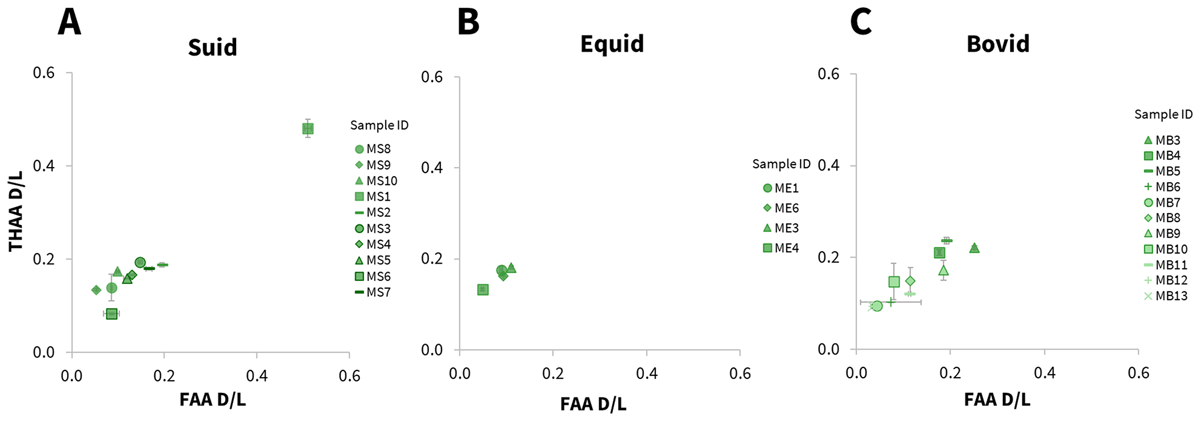
Figure 9
Relationship between the average free (FAA) vs total hydrolysable (THAA) Asx racemisation values (D/L) in three taxonomic groups of enamel samples present at Mumbwa Caves (A – suid; B – equid; C – bovid).
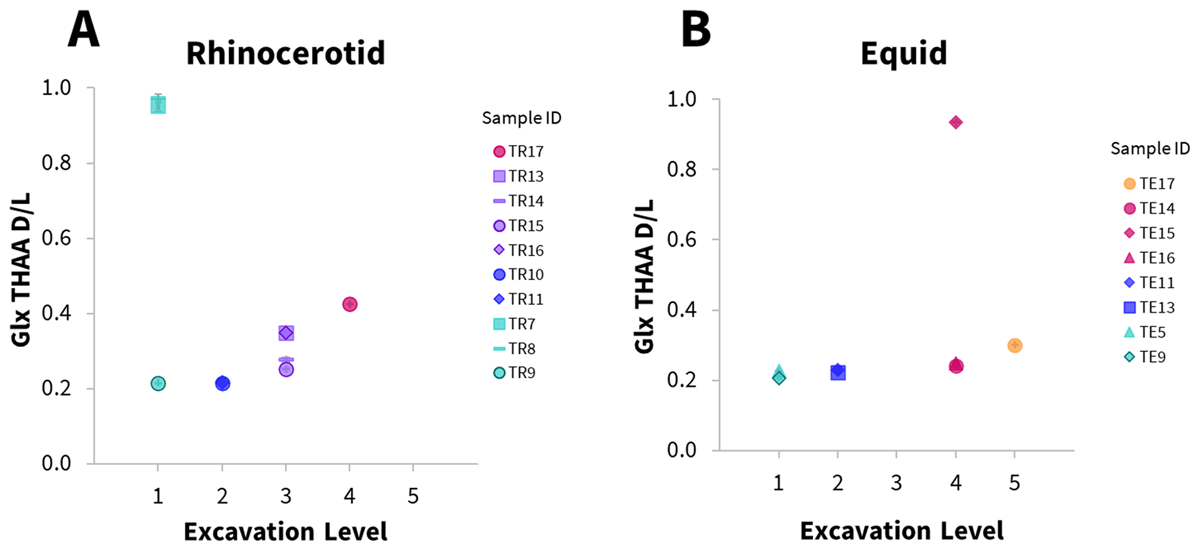
Figure 10
Average total hydrolysable amino acid (THAA) racemisation in Glx plotted against excavation level (1 = top 5 = bottom) in one excavation cavity (E5/E6) for rhinocerotid (A) and equid (B) samples. Error bars represent the standard deviation about the mean for subsample experimental replicates.
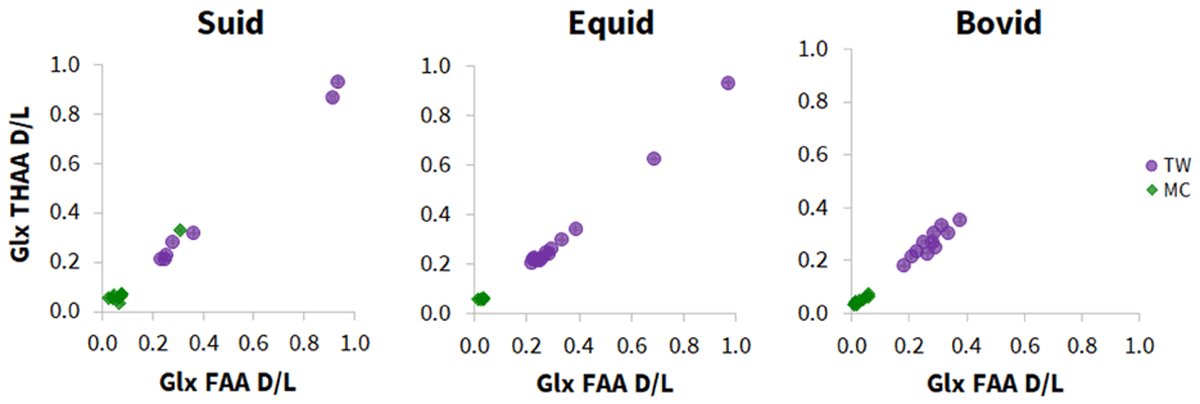
Figure 11
Relationship of the average free (FAA) vs total hydrolysable (THAA) Glx racemisation values (D/L) in the three taxonomic groups (suid, equid, bovid) of enamel samples present from both Mumbwa Caves (MC) and Twin Rivers (TW).