
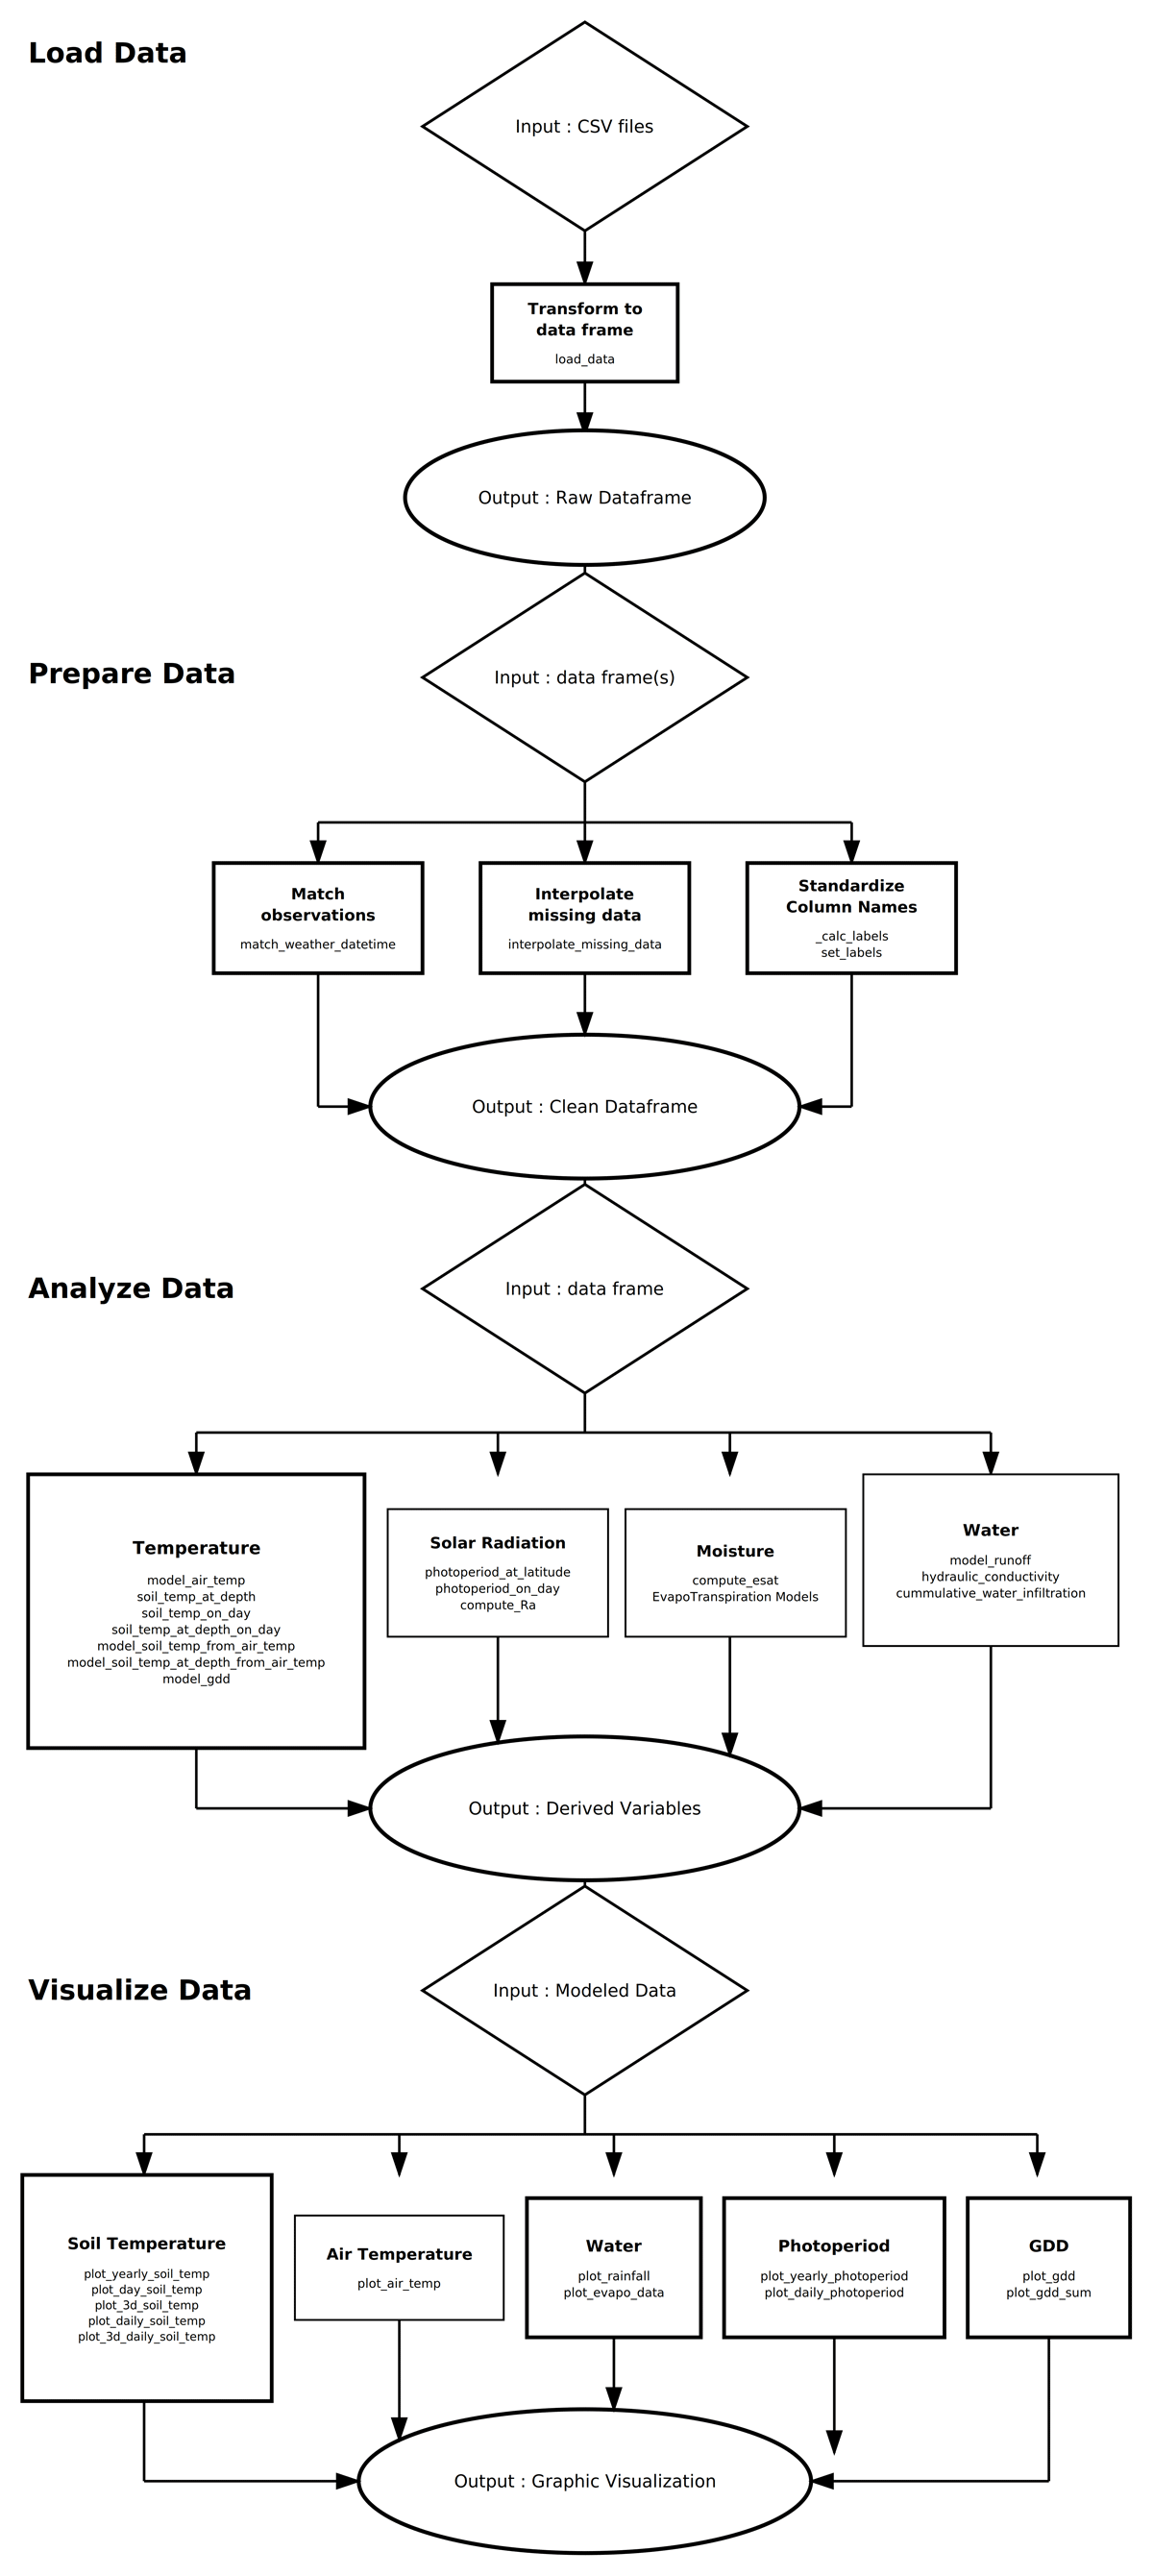
Figure 1
Overview of the AgroEcoMetrics data processing pipeline.
This flowchart illustrates the core stages of the AgroEcoMetrics workflow for modeling agricultural microclimates. The process begins with data loading, where raw CSV files are standardized into a DataFrame. During data preparation, missing values are interpolated, observational data are matched, and column names are standardized. The analysis stage generates derived variables from raw data using temperature, solar radiation, soil moisture, and water balance models. Finally, data visualization modules produce interpretable outputs including GDDs, photoperiod estimates, air and soil temperature profiles, and water-related indices. Each stage takes a DataFrame as input and yields a transformed dataset or visualization-ready output.
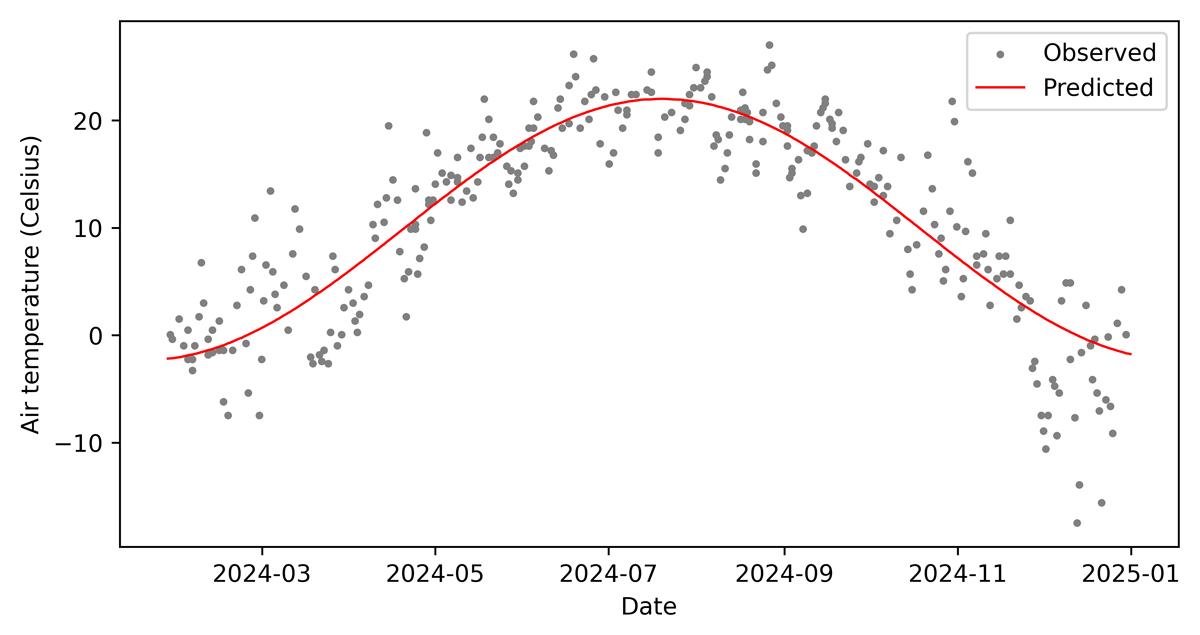
Figure 2
Seasonal pattern of observed and predicted daily air temperature.
Observed daily air temperature values (black points) are compared with predicted values (red line) generated using a smoothing spline interpolation. This approach estimates continuous temperature trends from incomplete or noisy weather station data, providing a basis for downstream modeling tasks such as GDD accumulation and phenological forecasting.
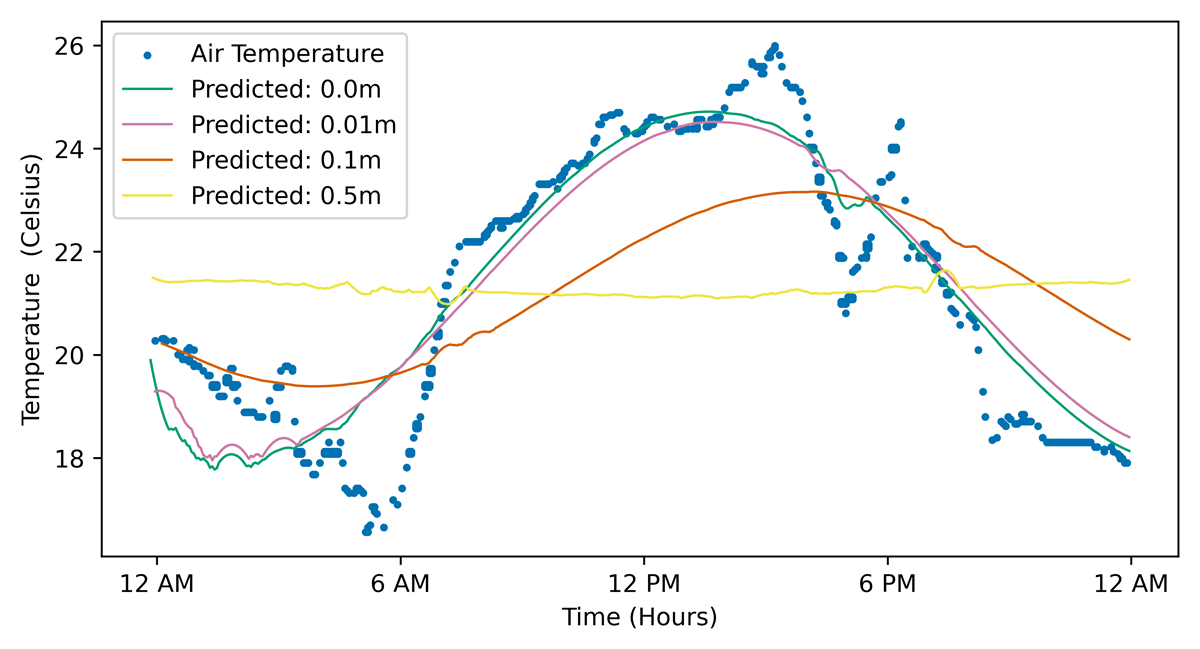
Figure 3
Diurnal variation in observed air temperature and predicted soil temperatures.
This plot shows observed air temperature (°C) and simulated soil temperature (°C) across 24 hours at depths of 0.0, 0.01, 0.1, and 0.5 m. Diurnal fluctuations are most pronounced at the soil surface, closely tracking atmospheric temperature dynamics, and progressively diminish with depth. The model captures the characteristic attenuation and phase lag of the daily heating-cooling cycle, with shallow layers responding quickly to changes in air temperature and deeper layers exhibiting delayed, muted responses. These results highlight the strong coupling between surface conditions and near-surface soils, while also illustrating the stabilizing thermal inertia present at depth.
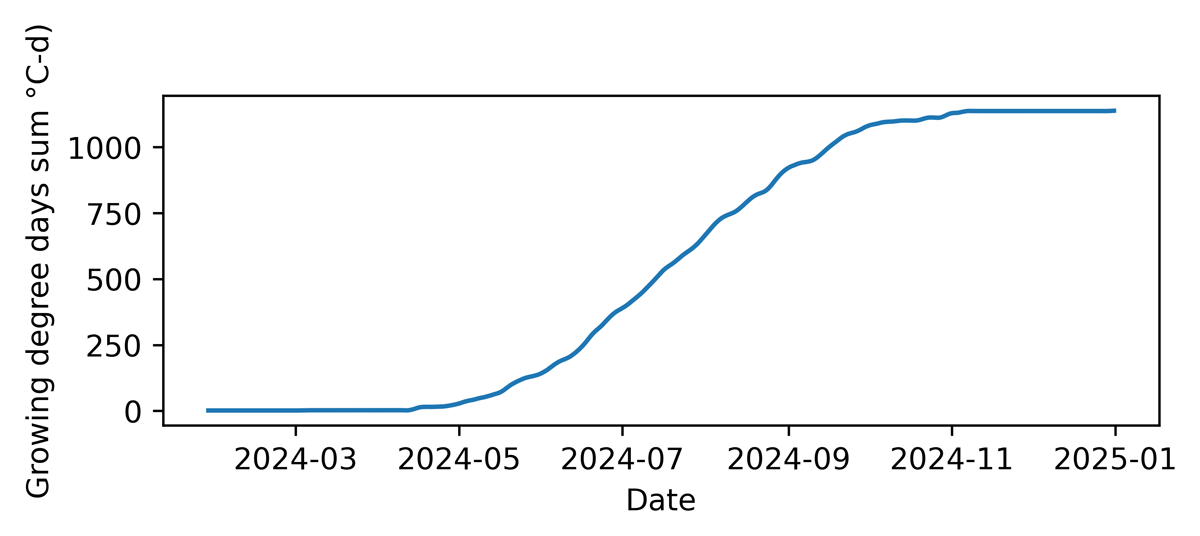
Figure 4
Seasonal accumulation of GDDs (°C-d).
This line graph shows the cumulative accumulation of GDDs (°C-d) from January through December 2024. Degree days remain negligible through winter and early spring, then rise steadily beginning in late May as daily temperatures exceed the base threshold.
Accumulation is most rapid during mid-summer, reflecting extended periods of warm conditions conducive to crop and pest development, before plateauing in late autumn as temperatures decline. This seasonal trajectory illustrates how GDDs integrate daily temperature fluctuations into a biologically relevant measure of thermal time.
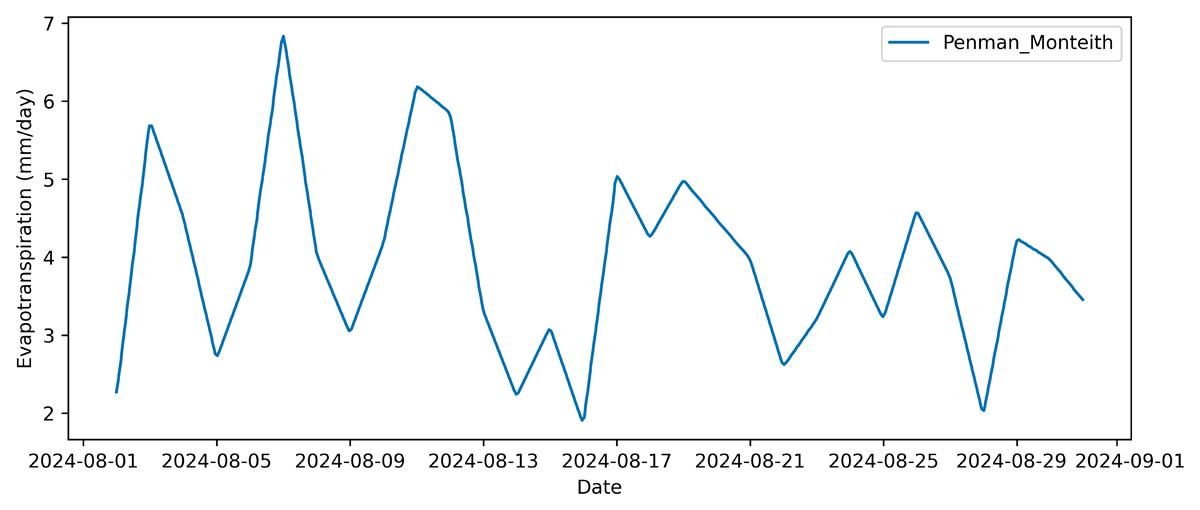
Figure 5
Daily evapotranspiration estimated by the Penman-Monteith method.
This time series depicts daily potential evapotranspiration (PET; mm/day) for August 2024 in Wisconsin, estimated using the Penman-Monteith model. PET values fluctuate in response to daily variation in temperature, humidity, solar radiation, and wind, with peaks corresponding to warm, dry periods with high solar radiation, which drive increased atmospheric demand of water by plants. Such patterns provide insight into short-term water balance dynamics, offering a basis for applications in irrigation scheduling, crop stress monitoring, and hydrologic modeling. By integrating multiple weather variables, the Penman-Monteith approach captures the physiological and environmental drivers of water loss more comprehensively than temperature-based methods alone.