
(1) Overview
Introduction
Modern agricultural systems increasingly depend on high-resolution environmental data to support evidence-based decision-making. This is in part due to weather’s critical influence on crop and pest development (1, 2, 3), resulting in the need to develop more accurate predictive yield and pest risk models. Climate change has introduced greater variability, uncertainty, and unpredictability in weather patterns, reducing the reliability of seasonal benchmarks (4, 5). These trends drive a shift toward more data-intensive agricultural decision-making, where models and environmental data support complex daily management decisions to maximize economic return and reduce environmental impacts. Concurrently, the emergence of low-cost environmental sensors has facilitated the large-scale collection of high-frequency data, giving rise to extensive sensor networks and climatological databases (6). When appropriately processed and analyzed, these data resources offer substantial potential for addressing complex challenges in agricultural management (2, 7).
To fully leverage these emerging data resources, researchers require decision-support tools that are both adaptable and capable of supporting complex workflows. Several existing Python packages address components of this challenge, but remain narrowly focused in scope. PyEt (8) provides robust estimation of potential evapotranspiration using 20 methods, but does not extend to broader microclimate modeling. Thermofeel (9) focuses specifically on thermal comfort indices for human-centric applications. SunPy (10), while exemplary in its modular design for solar physics data, illustrates how domain-specific packages often lack the cross-variable integration needed for agricultural research. Many of these environmental modeling tools offer limited visualization capabilities or are not easily extended to accommodate the diverse data types and modeling needs encountered in agricultural research. This creates a barrier for researchers and practitioners seeking to translate high-frequency environmental data into actionable insights. AgroEcoMetrics responds to this need as a generalizable, modular toolkit designed to bridge the gap between raw environmental data and site-specific outputs that inform agricultural decision-making.
The AgroEcoMetrics Python package provides an accessible and extensible framework for agricultural researchers and crop consultants to analyze and visualize weather and other environmental data relevant to agronomic decision-making. It integrates a suite of models capable of estimating site-specific environmental conditions and forecasting phenological events. In addition, it offers a range of pre-configured visualizations designed to facilitate the interpretation and validation of results. By incorporating and adapting established modeling approaches within a streamlined Python environment, AgroEcoMetrics enhances usability and supports analysis of large, complex datasets. The following sections describe the structure and functionality of the package, introduce its core components, and present an illustrative case study demonstrating its practical application.
AgroEcoMetrics is structured around three primary modules: data.py, equations.py, and visualizations.py. Together, these enable a modular pipeline for ingesting raw weather station data, transforming it into biologically meaningful variables, and visualizing spatiotemporal trends relevant to agriculture and agroecology. Figure 1 outlines the data flow through the package: from comma-separated values (CSV) import and preprocessing, through modeling routines, to outputting static, publication-ready figures.
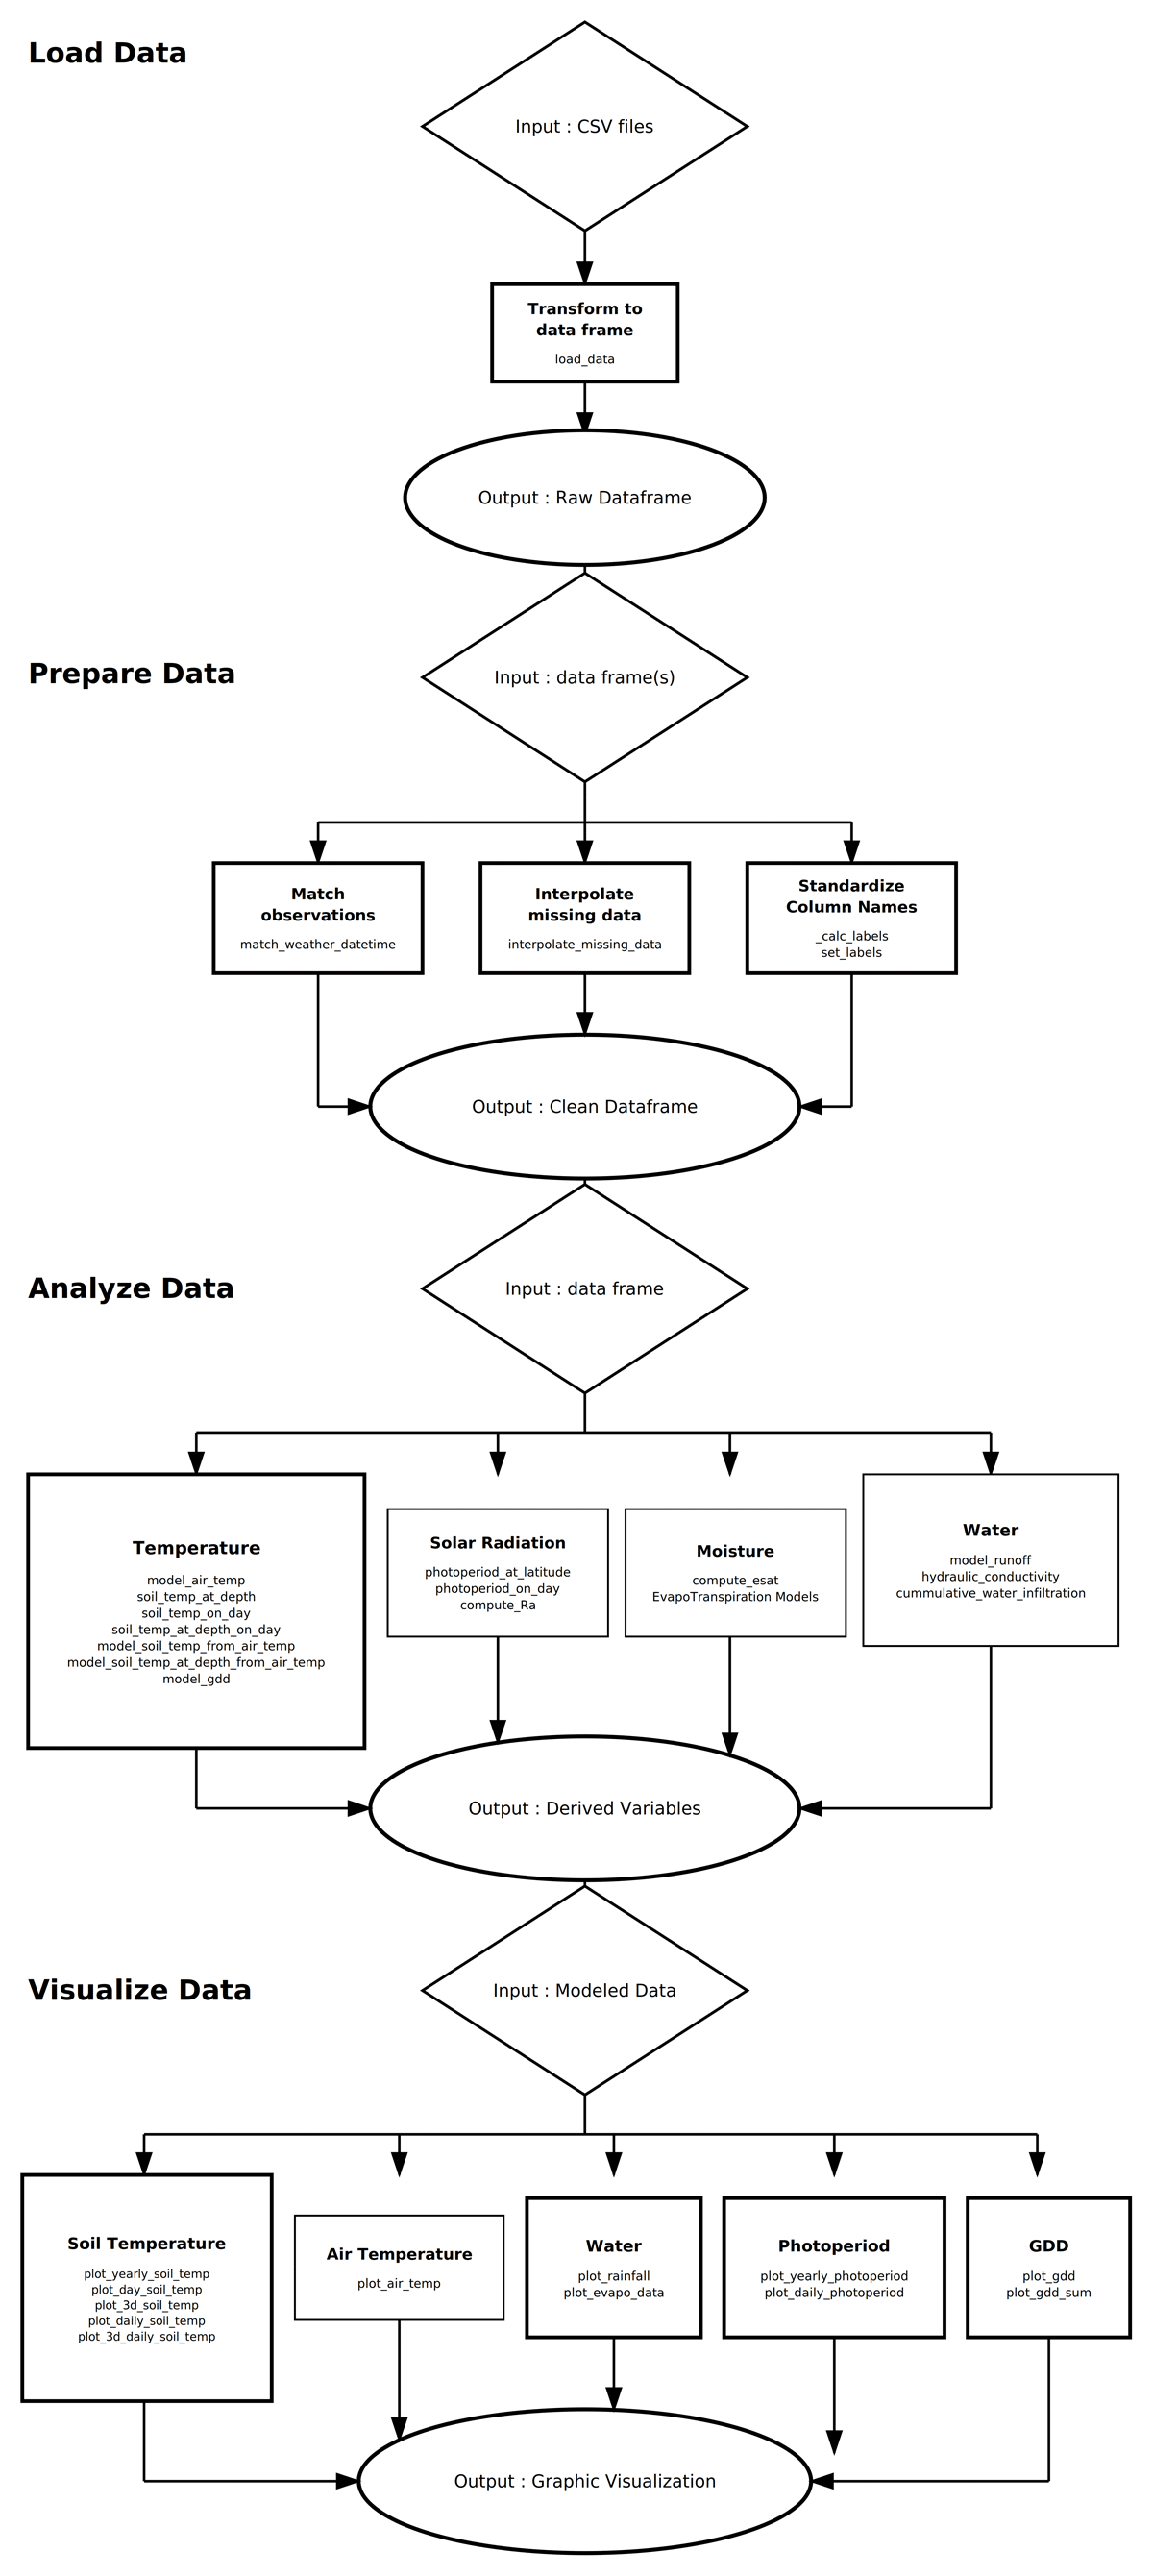
Figure 1
Overview of the AgroEcoMetrics data processing pipeline.
This flowchart illustrates the core stages of the AgroEcoMetrics workflow for modeling agricultural microclimates. The process begins with data loading, where raw CSV files are standardized into a DataFrame. During data preparation, missing values are interpolated, observational data are matched, and column names are standardized. The analysis stage generates derived variables from raw data using temperature, solar radiation, soil moisture, and water balance models. Finally, data visualization modules produce interpretable outputs including GDDs, photoperiod estimates, air and soil temperature profiles, and water-related indices. Each stage takes a DataFrame as input and yields a transformed dataset or visualization-ready output.
Implementation and architecture
Data handling (data.py)
The data handling module provides a unified interface for importing and preparing environmental time-series data. It standardizes raw CSV inputs into structured Pandas DataFrames, applies consistent datetime parsing, and automatically derives useful temporal variables such as day and year. The module includes flexible tools for filtering data to specified date ranges, interpolating missing observations, and aligning timestamps across multiple sources to facilitate multi-sensor integration. Export utilities allow users to save cleaned datasets or convert them into alternative structures for downstream workflows. By centralizing these preprocessing steps, the module ensures that diverse weather and sensor datasets can be efficiently harmonized prior to modeling.
Environmental modeling (equations.py)
The environmental modeling module provides the scientific core of AgroEcoMetrics, implementing a collection of mechanistic and empirical models that translate weather observations into ecologically and agronomically meaningful metrics. Rather than focusing on isolated calculations, this module is designed as a coherent suite of modeling tools that characterize foundational components of agricultural microclimate analysis, such as thermal environments, moisture dynamics, and biological time.
A major emphasis of the module is temperature modeling. It includes sinusoidal representations of daily and annual air temperature cycles, as well as soil temperature models derived from classical heat diffusion theory (11). These routines allow users to estimate subsurface temperatures at fixed depths, across multiple depths, or over continuous time, offering flexibility for applications ranging from crop emergence modeling to soil biogeochemical simulations. By coordinating air-soil temperature relationships within a consistent framework, the module enables users to capture temporal trends and vertical gradients in thermal conditions without requiring specialized numerical solvers. Figure 2 illustrates the outputs generated from an example dataset using the daily air temperature estimation calculation methods. Figure 3 illustrates the outputs generated from an example dataset using these multi-depth soil temperature estimation calculation methods.
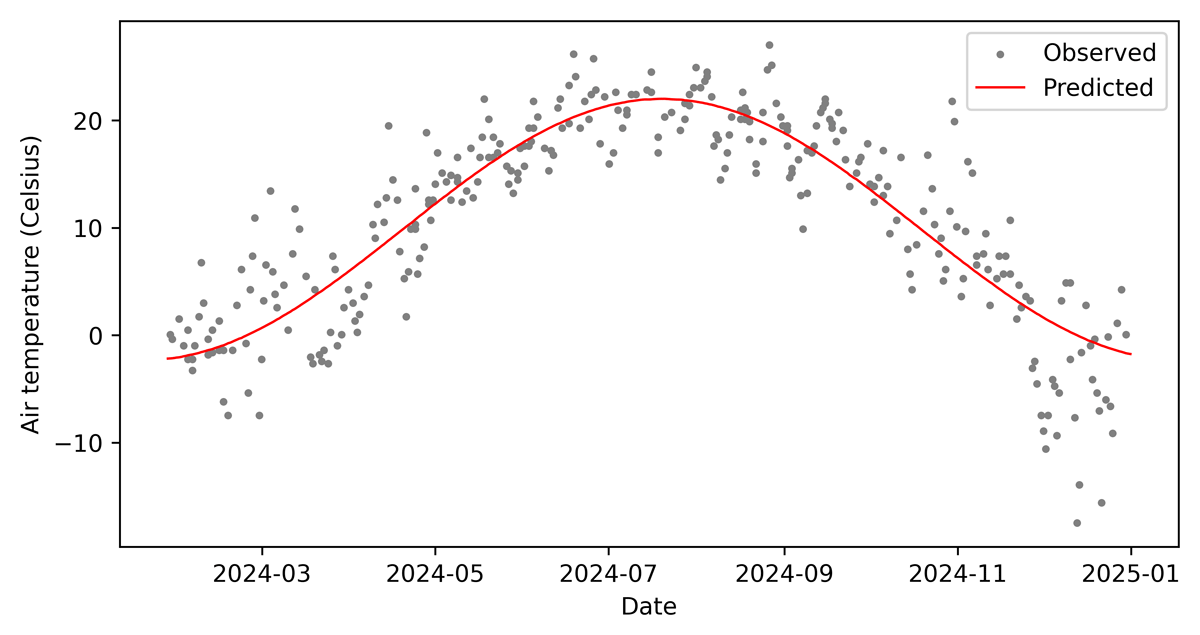
Figure 2
Seasonal pattern of observed and predicted daily air temperature.
Observed daily air temperature values (black points) are compared with predicted values (red line) generated using a smoothing spline interpolation. This approach estimates continuous temperature trends from incomplete or noisy weather station data, providing a basis for downstream modeling tasks such as GDD accumulation and phenological forecasting.
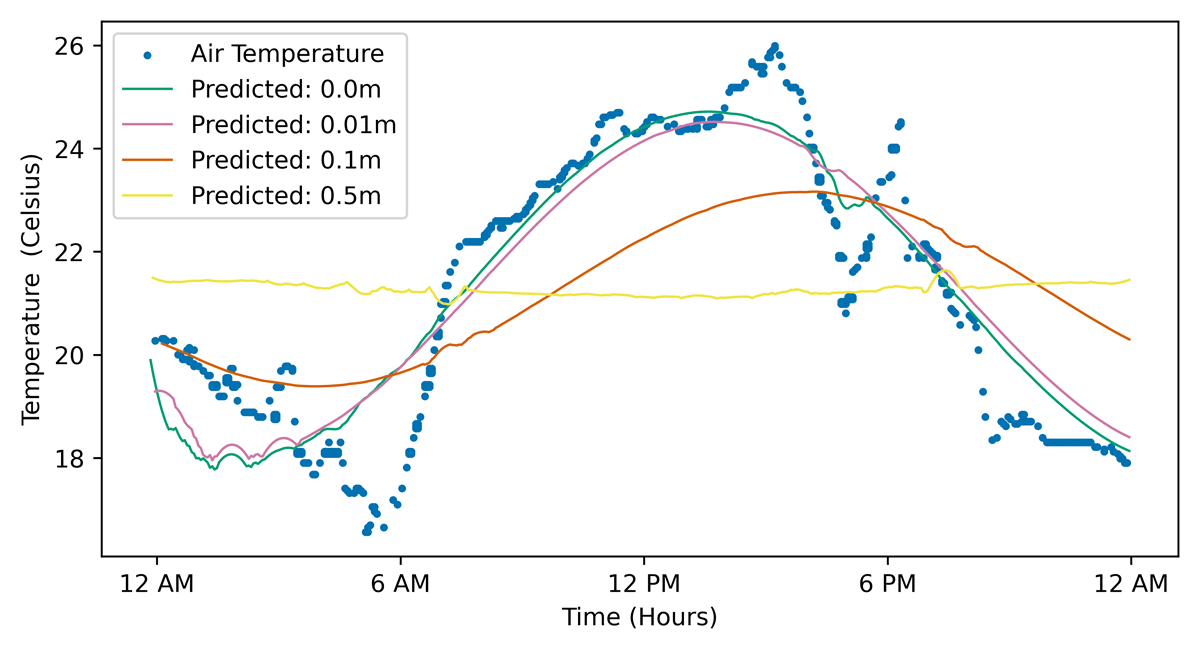
Figure 3
Diurnal variation in observed air temperature and predicted soil temperatures.
This plot shows observed air temperature (°C) and simulated soil temperature (°C) across 24 hours at depths of 0.0, 0.01, 0.1, and 0.5 m. Diurnal fluctuations are most pronounced at the soil surface, closely tracking atmospheric temperature dynamics, and progressively diminish with depth. The model captures the characteristic attenuation and phase lag of the daily heating-cooling cycle, with shallow layers responding quickly to changes in air temperature and deeper layers exhibiting delayed, muted responses. These results highlight the strong coupling between surface conditions and near-surface soils, while also illustrating the stabilizing thermal inertia present at depth.
The module also incorporates models for biological timing and photoperiod. Growing degree day (GDD) calculations offer both linear and temperature-response-based formulations (12), enabling users to estimate developmental progress under simple or more nuanced assumptions about thermal performance. Photoperiod functions calculate day length across latitudes and times of year (13), supporting integration of light-dependent processes into phenology or growth models. Figure 4 illustrates the outputs generated from an example dataset using these GDD calculation methods.
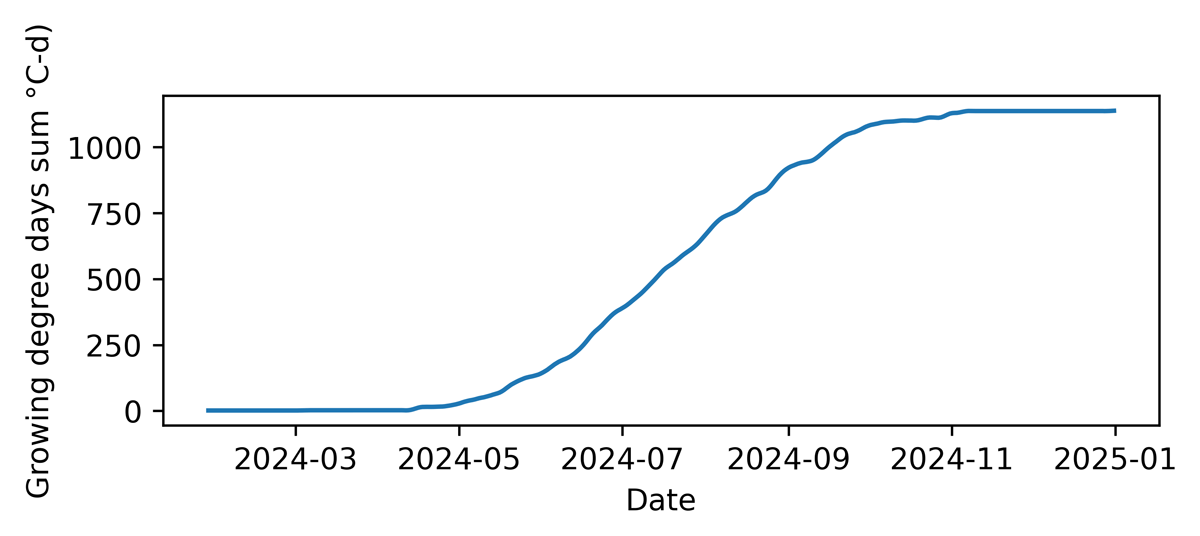
Figure 4
Seasonal accumulation of GDDs (°C-d).
This line graph shows the cumulative accumulation of GDDs (°C-d) from January through December 2024. Degree days remain negligible through winter and early spring, then rise steadily beginning in late May as daily temperatures exceed the base threshold.
Accumulation is most rapid during mid-summer, reflecting extended periods of warm conditions conducive to crop and pest development, before plateauing in late autumn as temperatures decline. This seasonal trajectory illustrates how GDDs integrate daily temperature fluctuations into a biologically relevant measure of thermal time.
Hydrometeorological processes are addressed through models for evapotranspiration and rainfall-runoff. The implementation of the Penman-Monteith equation (14) allows for physically based estimation of potential evapotranspiration using standard meteorological inputs, supporting assessments of atmospheric water demand and plant stress. The inclusion of the USDA Curve Number method (15) provides a simple yet widely applied approach to estimating daily runoff and infiltration potential, facilitating analyses of soil moisture availability and stormwater response in agricultural landscapes. Figure 5 summarizes an example dataset and demonstrates the corresponding evapotranspiration and runoff calculations produced by these models.
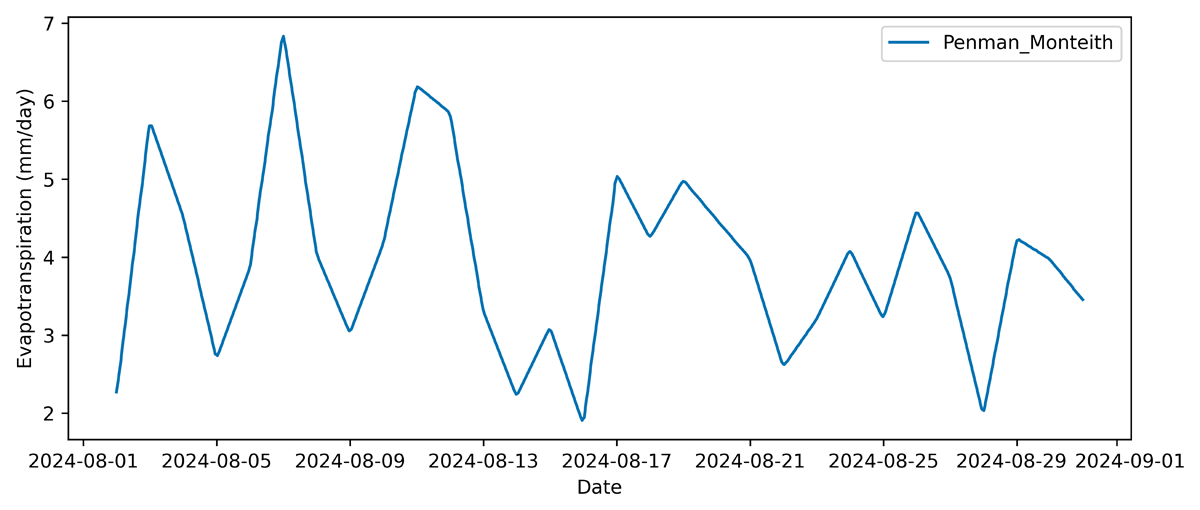
Figure 5
Daily evapotranspiration estimated by the Penman-Monteith method.
This time series depicts daily potential evapotranspiration (PET; mm/day) for August 2024 in Wisconsin, estimated using the Penman-Monteith model. PET values fluctuate in response to daily variation in temperature, humidity, solar radiation, and wind, with peaks corresponding to warm, dry periods with high solar radiation, which drive increased atmospheric demand of water by plants. Such patterns provide insight into short-term water balance dynamics, offering a basis for applications in irrigation scheduling, crop stress monitoring, and hydrologic modeling. By integrating multiple weather variables, the Penman-Monteith approach captures the physiological and environmental drivers of water loss more comprehensively than temperature-based methods alone.
Finally, the module provides first-order hydrologic soil functions, including hydraulic conductivity and cumulative infiltration estimates (16, 17), offering users a means of approximating water movement into the soil profile under varying moisture conditions. Together, these modeling components form an extensible scientific engine for AgroEcoMetrics, enabling users to derive a wide range of microclimate indicators from raw weather data. By housing these routines within a consistent architectural framework, the module supports reproducible, transparent modeling pipelines that can be adapted to diverse agricultural and ecological research contexts.
Visualization (visualizations.py)
The visualization module provides a standardized framework for translating modeled environmental variables into clear, publication-quality graphics. Designed to integrate directly with outputs from the equations module, it enables users to generate figures that summarize key microclimate processes while maintaining consistent formatting, labeling, and file-saving conventions. All visualization functions accept model outputs and a user-defined file path, producing static PNG images suitable for analysis, reporting, or dissemination.
A central set of functions supports the visualization of temperature dynamics, including plots of observed versus modeled air temperatures, annual and daily soil-temperature profiles, and three-dimensional representations of temperature variation across soil depth and time. These figures facilitate inspection of model behavior, comparison across depths or seasons, and evaluation of thermal patterns relevant to crop and soil processes.
Additional routines allow users to visualize evapotranspiration estimates from multiple modeling approaches, rainfall and modeled runoff over time, and daily or cumulative GDD trajectories. These tools help contextualize moisture balance, storm response, and phenological development in agricultural systems. The module also includes functions for generating photoperiod curves, either across a full year at a given latitude or across multiple latitudes for specific days of the year, providing useful reference visualizations for day-length-driven ecological processes.
By offering an organized suite of plotting tools that directly match the structure of the modeling outputs, the visualization module supports efficient interpretation of results and ensures that analyses conducted with AgroEcoMetrics can be communicated clearly and consistently.
Quality control
Users can verify that AgroEcoMetrics has been installed and configured correctly by executing the automated test suite included with the package. All quality-control routines are distributed with the source code and are intended to allow users to independently confirm the correctness of data ingestion, model execution, and numerical outputs.
The repository contains a dedicated tests directory, which includes a Python testing script (tests.py), two example datasets, and a folder of expected outputs. Running the tests.py script executes a comprehensive set of unit tests covering all core modeling functions implemented in the equations module, as well as tests for data-loading and preprocessing routines. If the package is functioning correctly, all tests complete successfully and print confirmation messages to the console. If a test fails, the script reports which function and parameter configuration caused the failure.
The test datasets are derived from observational weather data collected at Arlington, Wisconsin, and are designed to exercise the full range of temporal resolutions supported by the package. The file 5_min_Data.csv contains five-minute averaged measurements of air temperature, wind speed, precipitation, solar radiation, relative humidity, and atmospheric pressure for July 7, 2025, allowing validation of sub-daily modeling workflows. The file Daily_Data.csv contains daily summaries for the same variables, with minimum and maximum values reported where appropriate, and spans the entire month of July 2025. These datasets enable testing of both high-frequency and daily-scale analyses. Each function in the equations module is evaluated under multiple parameter settings to ensure numerical stability and robustness across realistic input ranges. For every test case, the size and shape of the output arrays are verified.
In addition to automated testing, the example datasets included in the repository function as end-to-end validation cases that mirror typical user workflows. By loading the example data, applying temperature models, evapotranspiration calculations, GDD accumulation, runoff estimation, and photoperiod calculations, users can qualitatively inspect outputs and visualizations to confirm that results are biologically and physically reasonable.
Together, these automated tests and example workflows provide a transparent and reproducible quality-control framework. They allow users to confirm that AgroEcoMetrics is operating as intended, while also providing developers with safeguards that support ongoing extension and refinement of the package without compromising scientific validity.
(2) Availability
Operating system
This package is platform-independent and can be run on any operating system (GNU/Linux, macOS, or Windows) that supports Python.
Programming language
Python 3.9+
Additional system requirements
512 MB RAM, ~10 MB disk space. Requires the ability to write/read CSV and PNG files.
Dependencies
Matplotlib ≥ 3.10.5
NumPy ≥ 2.3.2
Pandas ≥ 2.3.1
SciPy ≥ 1.7.1
List of contributors
N/A
Software location
Archive
Code repository
Name: Github
Identifier: https://github.com/bicklabuw/AgroEcoMetrics
Licence: MIT
Date published: 10/20/2025
Archive
Name: Zenodo
Persistent identifier: 10.5281/zenodo.20562687
Licence: MIT
Publisher: Scarlett Olson
Version published: 0.1.0
Date published: 11/21/25
Language
Python, with comments and documentation in English.
(3) Reuse Potential
AgroEcoMetrics is designed for reuse across a wide spectrum of agricultural, ecological, and environmental research disciplines where microclimate data serve as a foundation for understanding biological and physical processes. Its modular structure enables flexible integration into existing research pipelines. Potential user communities include:
Agricultural and crop scientists using the package to model GDDs, evapotranspiration, and soil temperature to forecast crop growth or optimize irrigation scheduling.
Plant geneticists conducting genotype-by-environment studies who may derive site- and time-specific environmental covariates for linking with genomic or phenotypic datasets.
Ecologists and evolutionary biologists modeling phenology or thermal niches.
Pest and disease researchers incorporating temperature and humidity metrics into life-history or dispersal models.
Or hydrologists or soil scientists adapting the evapotranspiration and infiltration routines to study soil-water-energy dynamics.
Because AgroEcoMetrics is built on transparent data structures (Pandas DataFrames and NumPy arrays) and clear variable labeling conventions, it can be readily incorporated into automated data pipelines, dashboards, and machine learning workflows for predictive modeling and decision support.
The software is intentionally designed for extensibility and modular expansion. Future development could incorporate routines for modeling the energy budget and heat exchange of animals with their environments as mediated by fur, feather, or tissue conductance properties. Additional extensions could include simulation of carbon assimilation in plants through photosynthesis and transpiration, estimation of leaf area index (LAI) and light transmission through canopies, or the inclusion of microclimate wind dynamics within crop canopies. These extensions would expand AgroEcoMetrics’ relevance to ecological physiology and ecosystem modeling.
Researchers interested in contributing additional functionality, fixing bugs, or proposing new modeling routines are encouraged to contact the Bick Lab at the University of Wisconsin–Madison via the GitHub Issues page or the project email listed in the repository. All code contributions are managed through version-controlled pull requests and follow the repository’s contribution guidelines.
User support for the AgroEcoMetrics package is provided through a combination of online documentation, open-source community resources, and ongoing maintenance by the Bick Lab. The GitHub repository includes comprehensive usage guides, example datasets, and workflow demonstrations for key functions such as degree-day modeling, evapotranspiration estimation, and soil temperature simulation. Bug reports and feature requests are managed through GitHub Issues, and users are encouraged to engage in discussions or contribute improvements through pull requests. Periodic updates and changelogs ensure reproducibility and traceability across versions. Although no formal helpdesk system currently exists, users seeking assistance or collaboration opportunities may reach out directly to the project maintainers through the contact information provided in the repository.
Author Contributions
Fletcher Robbins: Conceptualization, Formal Analysis, Investigation, Methodology, Project Administration, Software, Validation, Writing – Original Draft, Writing – Review & Editing, Project Lead.
Scarlett Olson: Data Curation, Formal Analysis, Investigation, Methodology, Software, Visualization, Writing – Original Draft, Writing – Review & Editing, Lead Developer.
Christopher Kucharik: Formal Analysis, Resources, Validation, Writing – Review & Editing.
Alexander Arovas: Developer, Writing – Review and Editing.
Emily Bick: Conceptualization, Funding Acquisition, Project Administration, Resources, Supervision, Writing – Review & Editing Principal Investigator.