
(1) Overview
Introduction
The amount of solar irradiation energy harvested by a solar collector depends on several factors. These include the time of irradiation (both the time of day and the day of the year), the latitude and climate of the location, and the shape and orientation of the solar panel [179]. A solar collector can be positioned at a fixed orientation to maximize energy reception for a specific time period, such as daily, weekly, monthly, or seasonally, or it can be fixed for optimal performance throughout the year (Figure 1). The orientation can then be adjusted for the next time period. Solar irradiation is composed of three components: the direct beam, sky diffusion, and ground reflection. For flat solar panels, we focus on direct beam irradiation, which contributes the most to solar irradiation. There are various models available for different climate types. We assume a clear sky condition with no clouds in the sky and an atmosphere free of pollutants. However, a cloudy sky or polluted air may affect the amount of solar energy received on Earth. There are some other issues which may require careful consideration and further investigation in future studies, such as panel efficiency, energy conversion, and the effects of air pollution. In our case, we use Hottel’s model to estimate the transmittance of direct solar radiation through a clear and sunny atmosphere [310].

Figure 1
A flat solar panel is placed at a latitude ϕ, aligned along the North–South direction with a tilt angle β. The incidence angle θ is the angle between the Sun’s rays and the normal vector to the solar collector, n. The solar zenith angle θz is the angle between the Sun’s rays and the normal vector to the horizontal plane at the observation point.
The pysolorie’s features include, but are not limited to:
Finding the optimal tilt angle for a fixed solar panel, assuming a clear-sky condition.
Plotting the optimal tilt angle over a range of days.
Plotting the daily direct irradiation energy over a range of days.
Generating a CSV, JSON, or XML report detailing the optimal tilt angle over a range of days.
Utilizing Hottel’s model to quantify a clear-sky condition and estimate the atmospheric transmission of clear-sky beam radiation [1011].
In our previously published research paper [1], we demonstrated that the energy collected by a flat solar panel can be calculated using the formula in Equation (1), where:
n is the day of the year where n = 1 corresponds to January 1st in the Julian calendar,
ϕ is the latitude of the observer in degrees,
I(n) is the amount of extraterrestrial solar energy received per unit area per second [58] on day number n of the year,
Ω is the Earth angular velocity around its axis with the value 7.27 × 10⁻⁵ rad/s,
θ is the angle between the position vector of the sun and the normal vector to the solar panel (incidence angle) [12],
ωs is the sunrise hour angle in radians,
ωt is the sunset hour angle in radians,
H is the Heaviside step function,
τb is the beam atmospheric transmittance [10].
Using the energy calculated with Equation (1) enables us to find the optimal tilt angle that maximizes the energy received by the flat solar panel.
There are other tools that may be of interest, and this section highlights the differences between pysolorie and those tools (Table 1).
Table 1
Comparison between pysolorie, pvlib-python, and astropy
| pysolorie | pvlib-python | astropy | |
|---|---|---|---|
| Use Case | Optimal tilt angle calculation for flat solar panels | Simulation of photovoltaic energy systems | Astronomy and astrophysics tools |
| Sun Tracking | No Sun Tracking (panel is fixed at optimal tilt angle) | Implements one-axis sun tracking, including backtracking and shading [213] | Not Supported |
| Optimization Target | Maximize beam energy via optimal fixed tilt | Minimize incidence angle with one-axis tracking | Not applicable |
| Astronomical Calculations | Basic solar position for energy modeling | Includes solar position, irradiance, and system modeling | Comprehensive celestial mechanics, coordinate systems, etc. |
pvlib-python is a library for simulating the performance of photovoltaic energy systems [6]. pvlib-python implements two papers related to sun tracking [213]. In the paper by Anderson & Mikofski, the idea of backtracking and shading effect for a field of one-axis sun-trackers is discussed [2]. pysolorie, in contrast, considers a single flat-plate collector. This collector does not track the Sun and its orientation is optimally fixed. In the paper by Marion & Dobos, the optimal tracking angle for one-axis solar tracker is discussed [13]. With the constraint of one-axis tracking, the incidence angle is minimized. However, pysolorie focuses on finding the optimal tilt angle for the solar panel, instead of sun tracking.
The astropy library is the most well-known Python package with comprehensive functionality for astronomy and astrophysics [4]. It provides astronomical coordinate systems, cosmological calculations, and many more features. However, it lacks the ability to determine the optimal orientation of a flat solar panel, a feature that pysolorie provides.
Implementation and architecture
pysolorie is implemented in Python and follows a modular architecture. The easiest way to install pysolorie is from PyPI.
python3 -m pip install pysolorie
The main components of the library and their responsibilities are as follows:
Direct Irradiation: Finds the optimal orientation and calculates the direct irradiation for a solar panel. The calculation method is based on our prior research publication [1].
Observer: Models an observer based on horizontal and equatorial representations of the Sun–Earth geometry.
Sun Position: Models the sun’s position, including hour angle, solar time, and declination.
Atmospheric Transmission: Calculates the effective atmospheric transmission coefficient of the direct beam.
Hottel Model: Implements Hottel’s clear-sky transmission model.
Solar Irradiance: Calculates the extraterrestrial solar irradiance for a given day of the year.
Plotter: Visualizes the optimal orientation and irradiation.
Report Generator: Exports results in multiple formats (CSV, JSON, XML).
The following diagram illustrates how the main components work together to determine the optimal orientation of solar panels under Hottel’s clear-sky assumptions, visualize the results, and generate user reports (Figure 2).
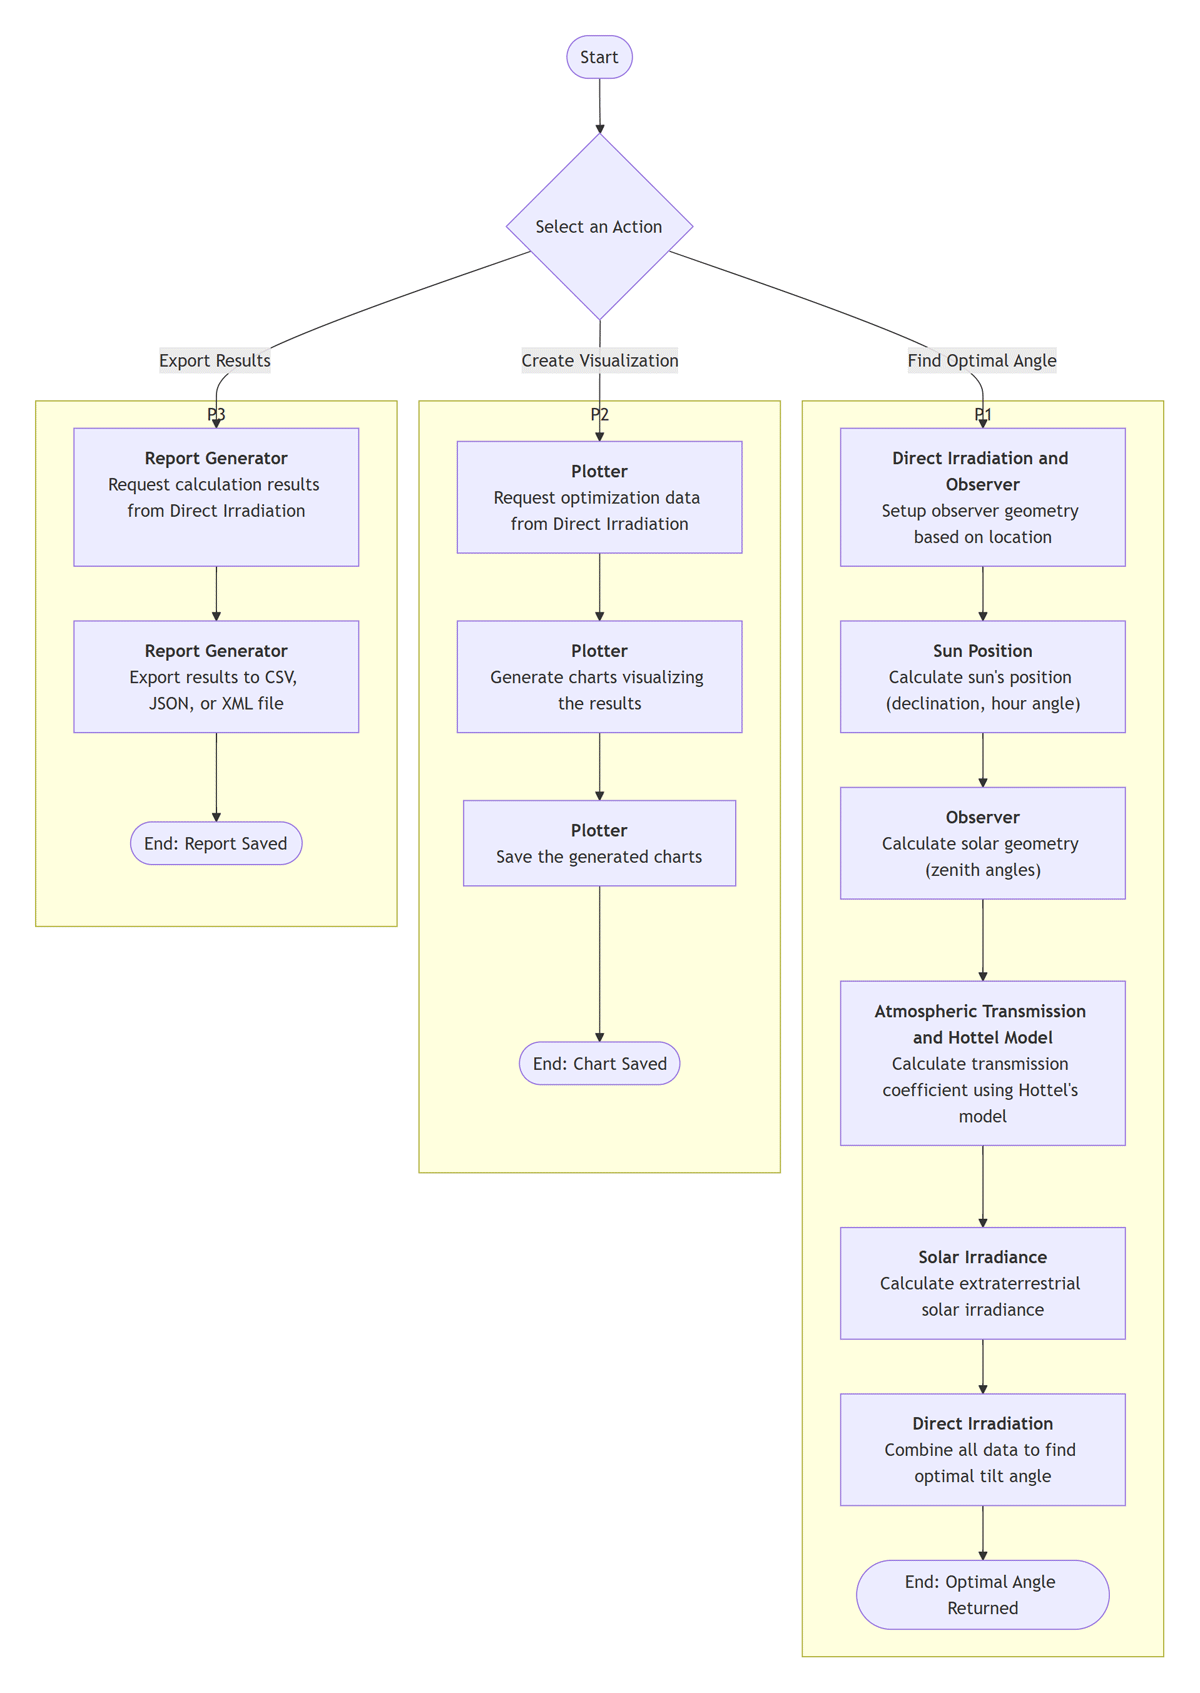
Figure 2
Main components and their interactions for calculating the optimal orientation of solar panels.
Let’s walk you through a typical scenario of how a solar engineer, let’s say Sarah, who lives in Tehran, can exploit pysolorie. She begins by using the Direct Irradiation calculator with the city’s geographic coordinates (latitude 35.6892°, altitude 1200 m) and selecting MIDLATITUDE SUMMER as the climate type. The modular architecture of pysolorie coordinates multiple components: the Observer models the sun-earth geometry for this specific location, while the Hottel’s Model provides atmospheric transmission coefficients based on clear-sky assumptions for midlatitude summer conditions. When she requests the optimal panel orientation for June 21st (day 172), the Direct Irradiation component orchestrates calculations across all modules. The Sun Position component determines solar declination and hour angles, the Observer calculates corresponding zenith angles, the Atmospheric Transmission applies Hottel’s clear-sky corrections, and the Solar Irradiance component computes extraterrestrial solar energy values. Through numerical optimization, which is backed by the theory in our previously published paper [1], the system returns an optimal tilt angle. If she wants, she can leverage pysolorie’s visualization or report generation capabilities. The Plotter produces year-long visualizations showing seasonal variations in optimal angles under a clear-sky condition. The Report Generator supports CSV, JSON, and XML files containing daily optimization results.
Quality control
To ensure correct and accurate implementation, we wrote 52 test cases covering different components of the system. The expected values of these test cases were calculated analytically based on our previously published paper [1]. We also included edge cases, such as specific days of the year (e.g., June 21 and December 21), various locations, and climate types to ensure correctness.
The line coverage of the test cases is 100%. We implemented CI/CD pipelines using GitHub Actions to ensure that all test cases pass on different operating systems (Ubuntu, Windows, and macOS) with various Python versions (3.9+). Thanks to the CI/CD pipeline, the documentation is automatically built for each release and published online at Read the Docs. The package itself is also automatically published to PyPI.
We use pre-commit hooks to run linter validations before allowing code to be pushed to the remote repository. We enforce strict type checking using mypy. We use tox to manage environments and run our tests.
Interested researchers can run these tests locally with the tox command. For example, to run the linter, you would use the following command:
tox -e lint
If you want to reformat the source code. You can use the following command:
tox -e format -- src tests
To verify the correctness of the formatting, execute the command below:
tox -e format
To check the types in the code with mypy, use this:
tox -e typecheck
To run unit tests for the python, e.g., python 3.10, you can run this command:
tox -e py310
(2) Availability
Operating system
pysolorie can be run on any operating system in which Python is installed and pip is available.
Programming language
pysolorie requires Python 3.9 or higher.
Additional system requirements
None
Dependencies
For users who only want to use pysolorie:
matplotlib>=3.8.2
scipy>=1.11.4
For developers who want to extend pysolorie or work directly with the source code, additional requirements are necessary:
tox>=4.11.1
pre-commit>=3.3.3
build>=0.10.0
sphinx
mypy
List of contributors
None
Software location
Archive
Name: Zenodo
Persistent identifier: https://doi.org/10.5281/zenodo.13832738
Licence: Apache-2.0 license
Publisher: Alireza Aghamohammadi
Version published: 1.5.8
Date published: 09/24/2024
Code repository
Name: Github
Identifier: https://github.com/aaghamohammadi/pysolorie
Licence: Apache-2.0 license
Date published: 09/24/2024
Language
English
(3) Reuse potential
With the pysolorie package, you can plot the optimal orientation of a solar panel based on the climate type, altitude, and latitude of a location. The package supports four climate types: MIDLATITUDE SUMMER, MIDLATITUDE WINTER, TROPICAL, and SUBARCTIC SUMMER. Altitude should be provided in meters above sea level (e.g., 1200 m), and latitude in degrees (e.g., 35.6892° for Tehran).
For example, the following code plots the optimal orientation for each day of the year for the city of Tehran (Figure 3).
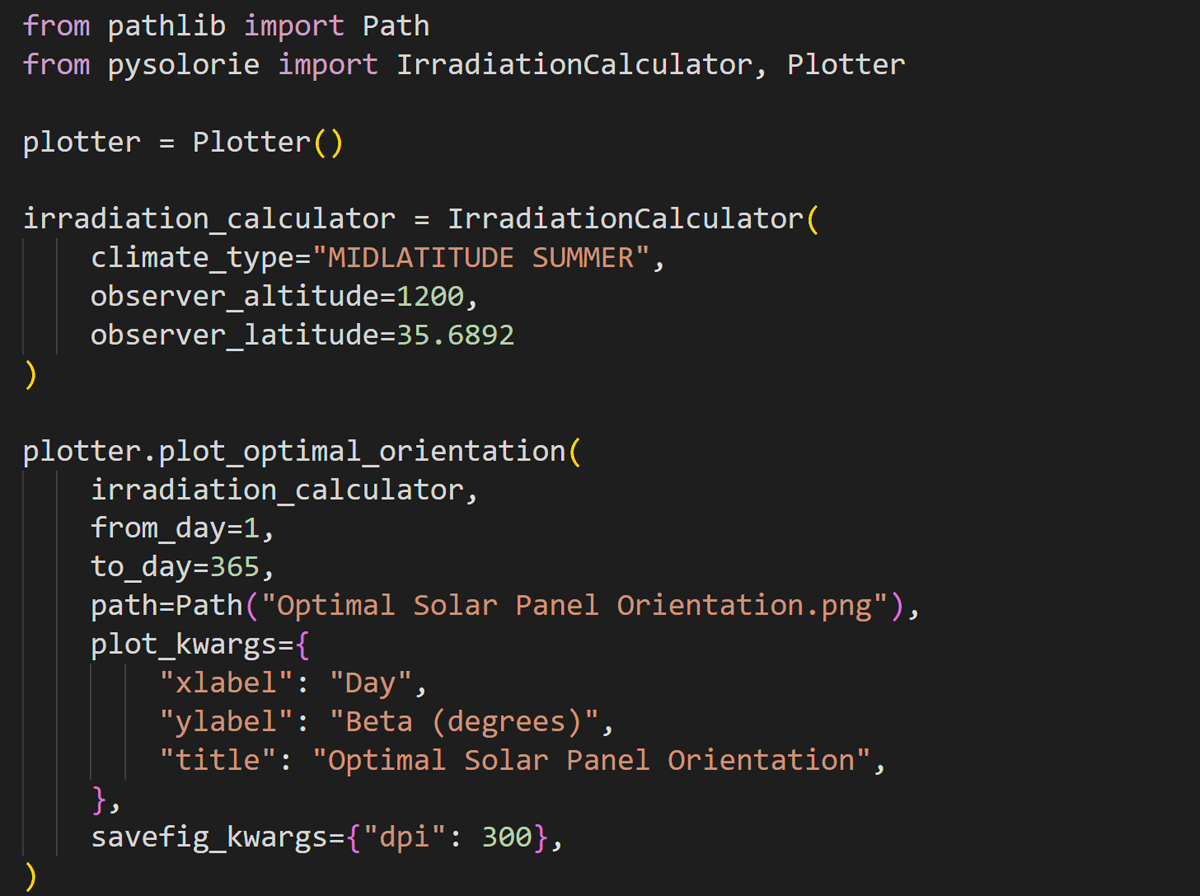
Figure 3
The code plots the optimal orientation for each day of the year for the city of Tehran.
Figure 4, generated by the example code, illustrates the optimal orientation of a solar panel for each day of the year in Tehran. The x-axis represents the day of the year, while the y-axis shows the optimal tilt angle (Beta) in degrees. As shown, the optimal angle varies throughout the year, emphasizing the importance of adjusting the panel’s orientation to maximize solar energy capture.
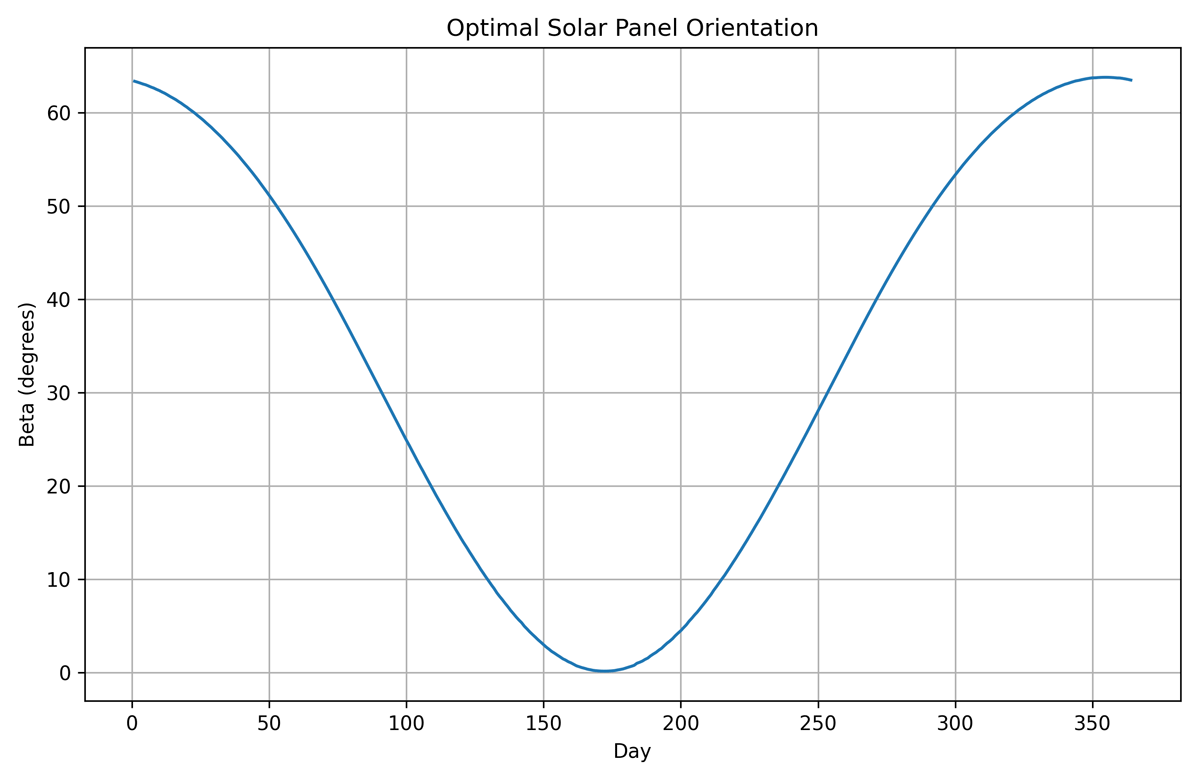
Figure 4
The optimal orientation of a solar panel for each day of the year in Tehran.
For more examples, please refer to the Getting started section of our online documentation. All the documentation, including how to use the package, its internal components, APIs with their inputs and outputs, and instructions on how to extend the project, is available online at Read the Docs.
With a well-defined, user-friendly, and extensible API, multiple audiences can benefit from pysolorie. These include solar energy researchers, solar panel manufacturers and installers, and instructors. API References are well-documented and available online. Developers and researchers are welcome to contribute to the pysolorie project.
Here are some ways people can contribute. The easiest way is to open an issue on GitHub if they want to request a feature, report a bug, or raise any other concerns related to the pysolorie package. Currently, there are 52 unit tests written to ensure the quality of the pysolorie package. Contributors can write additional tests and explore more edge cases. After making changes and ensuring all tests pass, contributors can submit their contributions by creating a pull request on GitHub. Additionally, for feature requests, bug reports, or any matters related to the software, they can simply communicate via email with the first author at al.aghamohammadi@gmail.com.
Acknowledgements
Amir Aghamohammadi would like to acknowledge the research council of the Alzahra University for the financial support. We would like to acknowledge that we used ChatGPT to help proofread the manuscript and correct grammatical mistakes.
Competing Interests
The authors have no competing interests to declare.
Author Contributions
Alireza Aghamohammadi designed, developed, and deployed the software package. Amir Aghamohammadi and M. Ebrahim Foulaadvand provided the formal verification and analysis of the theory and results presented in the paper.