
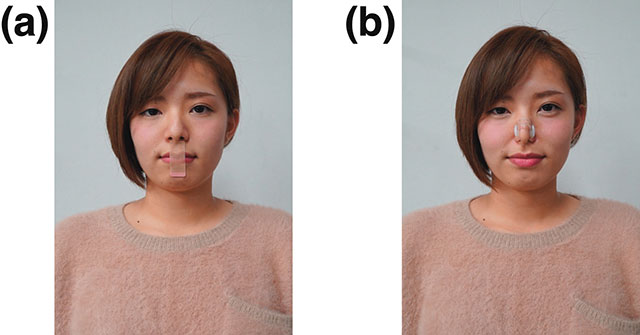
Figure 1
Experimental manipulation. A participant wearing a (a) strip of surgical tape or (b) nasal plug.

Figure 2
Three sample displays from Experiment 1. (a) Different colour search for target, and distractor in set size 9. (b) Different orientation search for target, and distractor in set size 31. (c) Different orientation and colour (conjunction) search for target, and distractor in set size 31.
Table 1
Mean Search Slopes (ms/item) and Intercepts (ms) with Standard Errors (in Brackets) in Experiment 1.
| Slope | ||||||
|---|---|---|---|---|---|---|
| Present | Absent | |||||
| Breathing style | Colour | Orientation | Conjunction | Colour | Orientation | Conjunction |
| Control | 1.08 (0.54) | 0.39 (0.43) | 9.82 (1.99) | 0.34 (0.49) | 2.24 (0.94) | 26.46 (2.88) |
| Nasal | 0.42 (0.36) | –0.53 (0.37) | 9.08 (1.38) | 0.22 (0.69) | 2.43 (0.60) | 27.31 (4.40) |
| Mouth | 0.62 (0.42) | 0.16 (0.49) | 9.40 (2.41) | –0.21 (0.51) | 4.38 (1.09) | 24.27(3.73) |
| Intercept | ||||||
| Control | 463.68 (13.93) | 532.91 (21.47) | 626.10 (37.74) | 472.39 (21.53) | 554.87 (26.23) | 422.41 (36.97) |
| Nasal | 488.00 (23.45) | 546.03 (17.96) | 669.21 (36.75) | 513.07 (34.21) | 561.98 (18.16) | 418.3 (37.31) |
| Mouth | 483.22 (23.44) | 550.45 (17.41) | 696.56 (55.22) | 513.15 (32.00) | 572.53 (18.16) | 462.06 (50.82) |
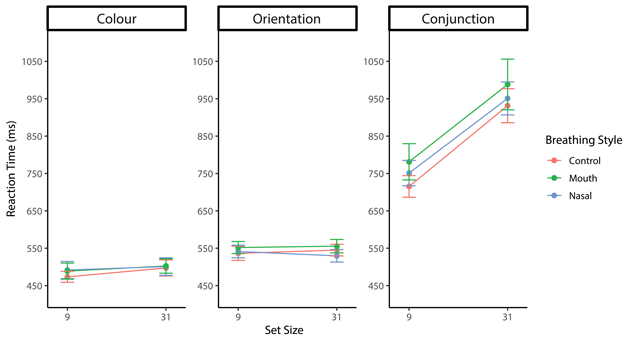
Figure 3
Mean RTs for each target-feature plotted as a function of breathing style and set size in target-present trials for Experiment 1. Error bars represent the standard error of the mean.

Figure 4
Mean RTs for each target-feature plotted as a function of breathing style and set size in target-absent trials for Experiment 1. Error bars represent the standard error of the mean.

Figure 5
Sample displays for each set size from Experiment 2. The left array of stimuli indicates the display in which the target is tilted at 6° in set size 37. The right array of stimuli indicates the display in which the target is tilted at 4° in set size 19.
Table 2
Mean Search Slopes (ms/item) and Intercepts (ms) with Standard Errors (in Brackets) in Experiment 2.
| Slope | ||||||
|---|---|---|---|---|---|---|
| Present | Absent | |||||
| Breathing style | 4° | 5° | 6° | 4° | 5° | 6° |
| Control | 0.54 (0.54) | –0.50 (0.26) | 0.20 (0.24) | –0.25 (0.21) | 0.22 (0.15) | –0.01 (0.09) |
| Nasal | 0.14 (0.17) | –0.06 (0.17) | –0.12 (0.15) | 0.12 (0.17) | –0.02 (0.09) | –0.02 (0.15) |
| Mouth | 0.25 (0.16) | 0.01 (0.10) | 0.03 (0.11) | 0.32(0.19) | 0.21 (0.11) | 0.14 (0.08) |
| Intercept | ||||||
| Control | 771.67 (45.17) | 688.13 (35.57) | 695.65 (36.68) | 779.52 (45.18) | 681.93 (33.40) | 643.28 (26.47) |
| Nasal | 747.04 (37.69) | 730.79 (37.71) | 645.7 (28.80) | 748.99 (37.22) | 732.79 (37.45) | 644.47 (29.15) |
| Mouth | 806.08 (45.81) | 695.65 (36.68) | 642.72 (30.48) | 805.47 (46.87) | 693.99 (36.09) | 641.74 (30.36) |

Figure 6
Mean RTs for each orientation contrast plotted as a function of breathing style and set size in target-present trials for Experiment 2. Error bars represent the standard error of the mean.
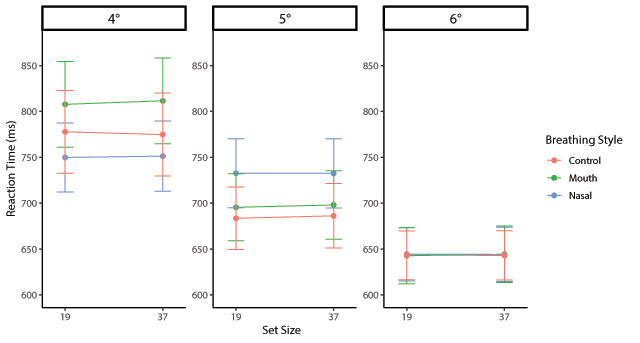
Figure 7
Mean RTs for each orientation contrast plotted as a function of breathing style and set size in target-absent trials for Experiment 2. Error bars represent the standard error of the mean.