
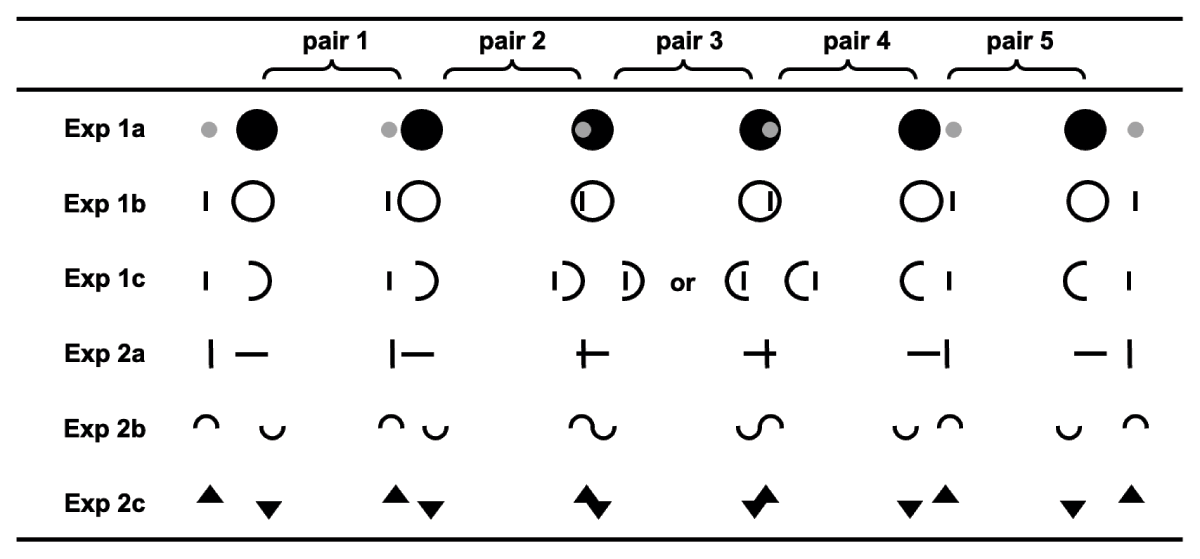
Figure 1
Stimulus Sets. Each row shows the stimuli of one experiment, and any two adjacent columns form a stimulus pair. Exp 1a, 1b, 2a, 2b, and 2c: Pairs 1, 3, and 5 differed in relative distance, not in inside/outside relation or connectedness. Pairs 2 and 4 differed in topological properties (i.e., inside vs. outside, connected vs. unconnected). (i.e., Exp 1a: The small circles were white in the experiment, presented in gray for display reasons here). Exp 1c: The inside/outside topological category boundary was removed.
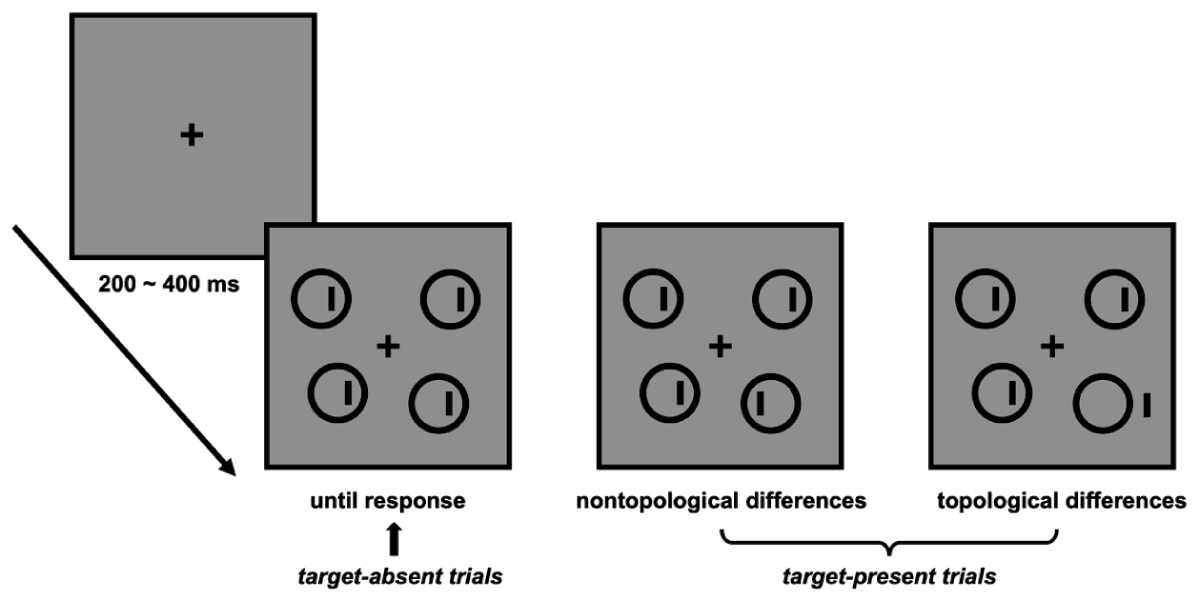
Figure 2
Experiment task flow. In the trial flow (target-absent trials), participants were expected to press the identical button as the visual stimuli in the four quadrants were the same. In the two trials on the right (target-present trials), participants were expected to press the different button as the stimulus in one quadrant differed from the rest: local geometric differences (all inside relations or all outside relations) and topological property differences (difference in inside/outside relations). The visual stimuli do not appear aligned in the square array due to the random jitter in the experiments.
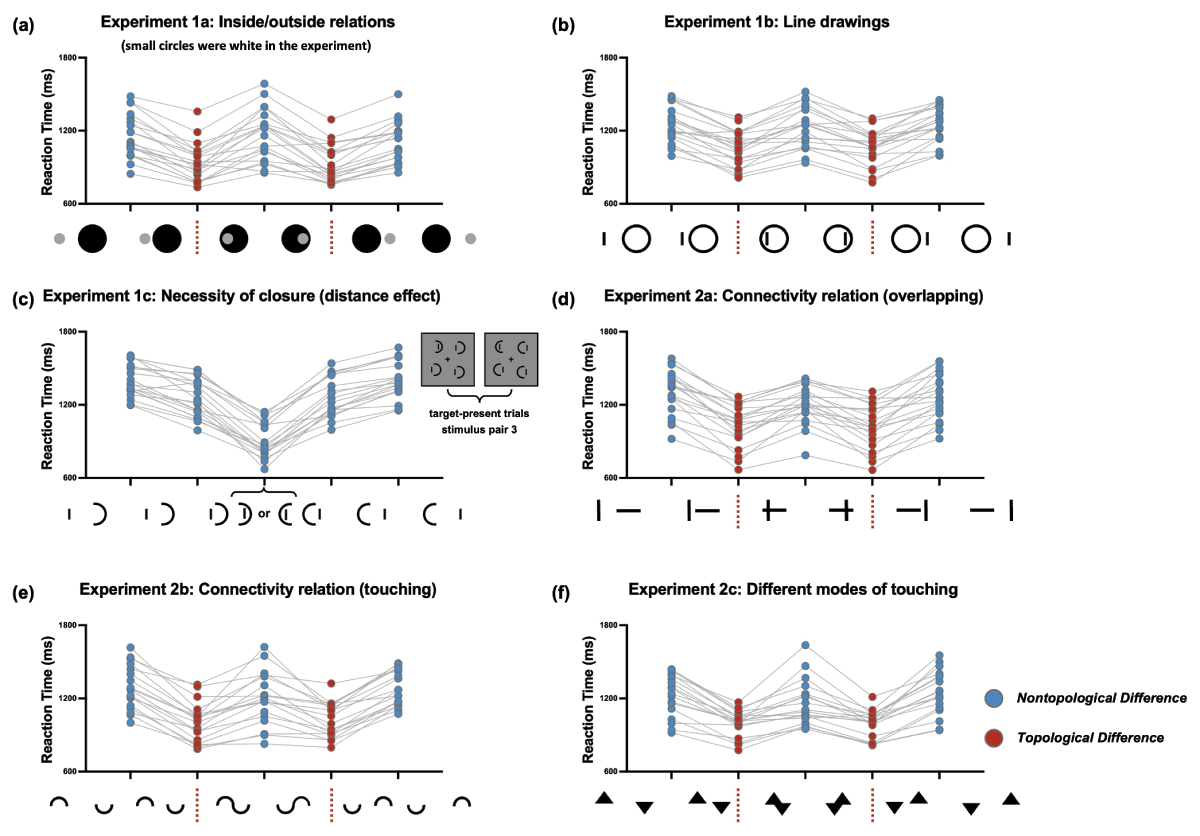
Figure 3
Results from experiments. Exp 1a, 1b, 1c, 2a, 2b and 2c, panels a-f. (a) Exp 1a: A small white circle and a large black circle were adopted to test inside/outside relations. The small circles were white in the experiment, presented in gray for display reasons here. (b) Exp 1b: A closed circle and a bar were adopted to exclude the influence of occlusion in Exp 1a. (c) Exp 1c: The inside/outside topological category boundary was removed. (d) Exp 2a: Two bars were adopted to test connectivity defined by overlapping. (e) Exp2b: Two arc stimuli were adopted to test connectivity defined by touching. (f) Exp 2c: Two triangles were adopted to examine connectivity with a larger touching area. Exp 1a, 1b, 2a, 2b, and 2c: Most participants showed a W-shape pattern between different conditions, with faster response times for topological differences (red dots) than for nontopological differences (blue dots). Exp 1c: Most participants showed a V-shape pattern between different conditions, and the response time increased with the distance between the two objects (blue dots). Each dot represents the results of one participant.