
Table 1
Information about the lexico-semantic norms used in Study 1 and 2: Amount of words, number of raters per word, and split-half reliabilities.
| Study 1 | Study 2 | |||||
|---|---|---|---|---|---|---|
| Words | Raters | Reliability | Words | Raters | Reliability | |
| Valencea | 4,299 | 64 | .99d | 13,915 | 20 | .91 |
| Arousala | 4,299 | 64 | .97d | 13,915 | 20 | .69 |
| Dominancea | 4,299 | 64 | .96d | 13,915 | 20 | .77 |
| AoAb | 4,299 | 32 | .97d | 30,121 | 18+ | .92 |
| Concretenessc | 30,070 | 15 | .91–.93d,e | 37,058 | 25+ | – |
[i] a Norms from Moors et al. (2013) for Study 1 and from Warriner et al. (2013) for Study 2. b Norms from Moors et al. (2013) for Study 1 and from Kuperman et al. (2012) for Study 2. c Norms from Brysbaert, Stevens, et al. (2014) for Study 1 and from Brysbaert, Warriner, and Kuperman (2014) for Study 2. d Spearman-Brown corrected split-half correlations calculated on 10,000 different randomizations of the participants. e Reliabilities of each of five lists of ca. 6,000 words were within this range.
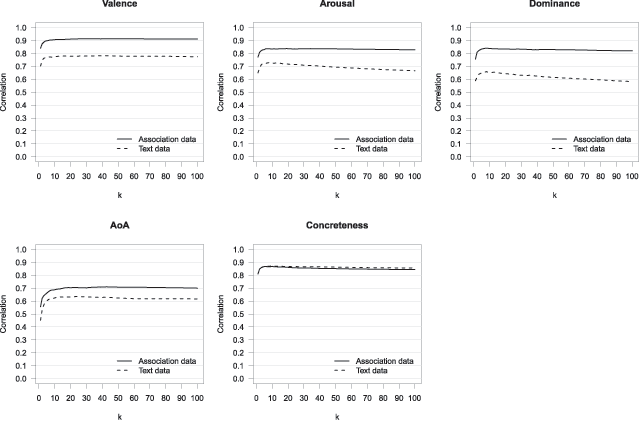
Figure 1
Correlations between predicted ratings and human ratings for valence, arousal, dominance, AoA, and concreteness, using association data or word co-occurrence data. Values of k are 1 to 50, 60, 70, 80, 90, and 100.
Table 2
The highest correlations and 95% confidence intervals for each variable per source of data (associations and text co-occurrences) using k-NN. All cross-validation correlations use the leave-one-out principle. The respective size of k is listed between square brackets.
| k-NN | |||
|---|---|---|---|
| N | Associations | Word co-occurrences | |
| Valence | 2,831 | .91 (.91–.92) [50] | .78 (.77–.80) [38] |
| Arousal | 2,831 | .84 (.83–.85) [19] | .73 (.71–.75) [8] |
| Dominance | 2,831 | .84 (.83–.85) [8] | .66 (.64–.68) [8] |
| AoA | 2,831 | .71 (.69–.73) [43] | .64 (.61–.66) [24] |
| Concreteness | 2,831 | .87 (.86–.88) [10] | .87 (.86–.88) [11] |

Figure 2
Correlations between estimated values based on the word association data and human ratings for valence, arousal, dominance, AoA, and concreteness. Values of k are 1 to 50, 60, 70, 80, 90, and 100.
Table 3
Highest correlations (r), 95% confidence intervals (95% CI), sample size (N) for each variable using k-NN with their respective value of k (k). All cross-validation correlations use the leave-one-out principle.
| N | r | 95% CI | k | |
|---|---|---|---|---|
| Valence | 8770 | .86 | (.86–.87) | 24 |
| Arousal | 8770 | .69 | (.68–.70) | 44 |
| Dominance | 8770 | .75 | (.74–.76) | 25 |
| AoA | 10032 | .59 | (.58–.61) | 26 |
| Concreteness | 10957 | .87 | (.86–.87) | 8 |
Table 4
Highest correlations (r), 95% confidence intervals (95% CI), sample size (N) for each variable using k-NN with their respective value of k (k), for the ANEW (Bradley & Lang, 1999) norms. All cross-validation correlations use the leave-one-out principle.
| N | i | 95% CI | k | |
|---|---|---|---|---|
| Valence | 946 | .92 | (.91–.93) | 11 |
| Arousal | 946 | .74 | (.71–.77) | 10 |
| Dominance | 946 | .83 | (.81–.85) | 10 |
Table 5
Highest correlations (r), 95% confidence intervals (95% CI), sample size (N) for each variable using k-NN with their respective value of k (k). Data is trained on the Warriner et al. (2013) norms, and tested with the ANEW (Bradley & Lang, 2017) norms.
| N | r | 95% CI | k | |
|---|---|---|---|---|
| Valence | 2156 | .89 | (.88–.89) | 13 |
| Arousal | 2156 | .71 | (.68–.73) | 24 |
| Dominance | 2156 | .76 | (.74–.77) | 23 |