
Table 1
Correlations between the Different Visual Properties of the Arrays.
| Variable | Convex hull | Average diameter | Density | Total surface area | Total circumference | Numerosity |
|---|---|---|---|---|---|---|
| Convex hull | – | |||||
| Average diameter | 0.08 | – | ||||
| Density | .139* | .574* | – | |||
| Total surface area | 0.064 | .657* | .564* | – | ||
| Total circumference | .202* | .567* | .464* | .667* | – | |
| Numerosity | .219* | –0.039 | –.077* | –.213* | .265* | – |
[i] Note. N = 504; the values represent the Pearson correlation coefficient; * = p < .05.
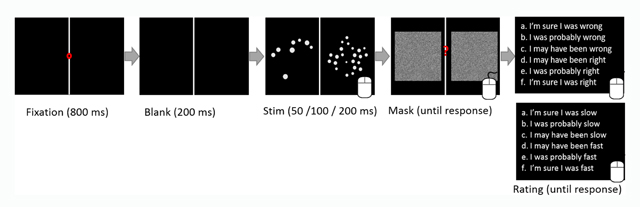
Figure 1
Procedure. The procedure was identical in both conditions. The only difference was replacing the words ‘right’ and ‘wrong’ in the accuracy emphasis condition with the words ‘fast’ and ‘slow’, respectively, in the speed emphasis condition. We used letters (a–f) and not numbers in order not to prompt any number representation. The rating scaled appeared in Hebrew since the participants were Hebrew speakers. The speed/accuracy manipulation was made between subjects.
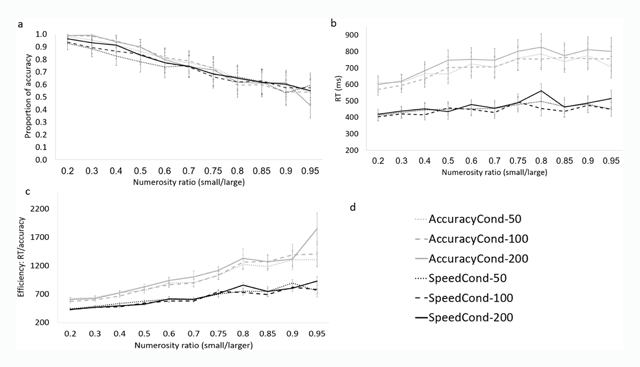
Figure 2
The influence of emphasis manipulation and stimuli exposure duration on performance. a) Accuracy as a function of stimuli exposure duration. b) RT as a function of stimuli exposure duration. c) Efficiency as a function of stimuli exposure duration; note that high efficiency = lower score. d) Legend. “AccuracyCond-50” means accuracy emphasis condition and stimuli exposure duration of 50 ms. “AccuracyCond-100” means accuracy emphasis condition and stimuli exposure duration of 100 ms, etc.
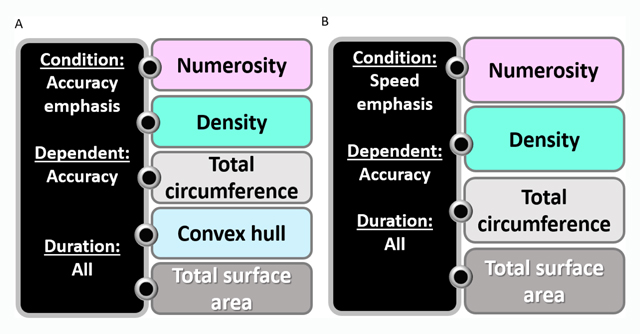
Figure 3
The hierarchical relationship between different magnitude ratios predicting accuracy in the accuracy and the speed emphasis conditions for all durations. A) Accuracy emphasis condition. B) Speed emphasis condition. The different colors represent different magnitudes. This chart is based on stepwise regression analysis with RT as the dependent measure. The magnitudes are written from top to bottom, representing the most to the least influential predictor. For more details about the regression analysis, see the Supplementary Material.
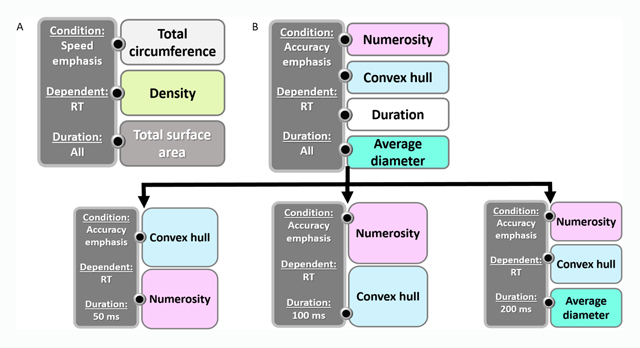
Figure 4
The hierarchical relationship between different magnitude ratios predicting accuracy in the speed and the accuracy emphasis conditions. A) Speed emphasis condition. B) Accuracy emphasis condition. Since duration predicted RT, a separate regression analysis was performed for every duration. The different colors represent different magnitudes. This chart is based on stepwise regression analysis with RT as the dependent measure. The magnitudes are written from top to bottom representing the most to least influential predictor. For more details about the regression analysis, see the Supplementary Material.