
Table 1
Abbreviations of Variable Names.
| pCorr | Proportion correct |
| pL | Proportion of error trials in which the selection is made from the list items only |
| pEFL | Proportion of errors from list |
| #L | Number of response choices from the list |
| #N | Number of response choices not from the list |
| pLRG | Proportion of the erroneous list responses that come from random guesses |
| k | Number of items in working memory (with or without their serial positions) |
| L | List length |
| R | Number of incorrect choices available that come from the list |
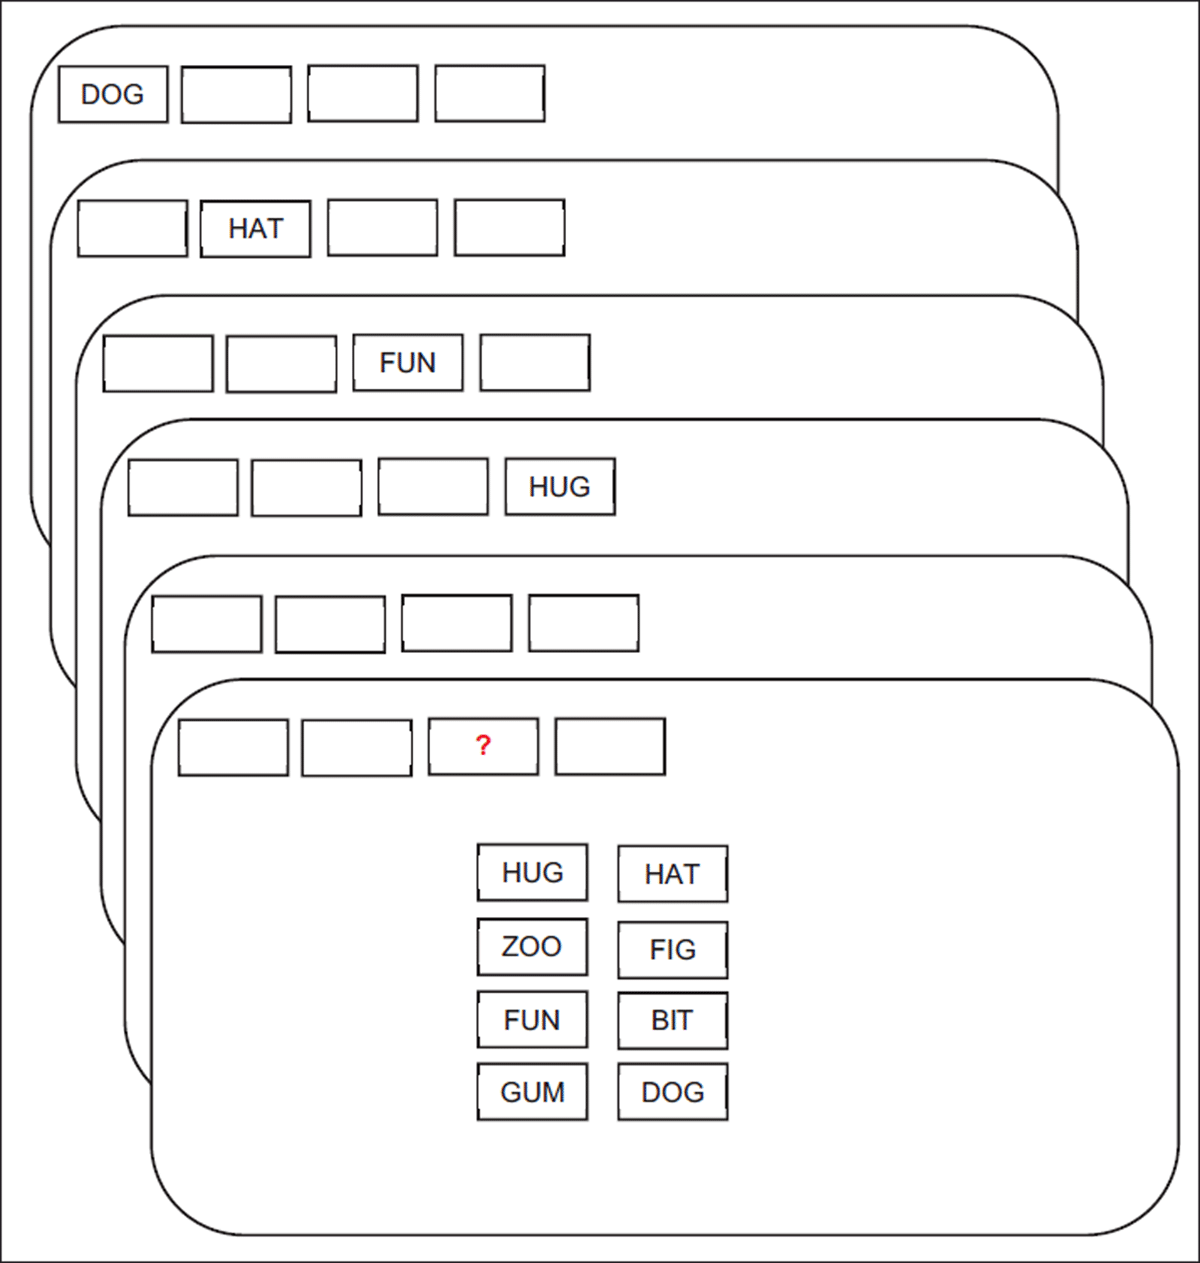
Figure 1
A trial with a list length of 4 words and a response choice set including 4 words from the list and 4 words from outside of the set. List Lengths 2, 4, 6, and 8 were used. When possible, 1, 2, 4, 6, or 8 items from the list appeared in the response set along with 0, 1, 2, or 4 words that were not in the list. There were also trials in which the response was serial recall. Figure reproduced from Oberauer (2019, Figure 1).
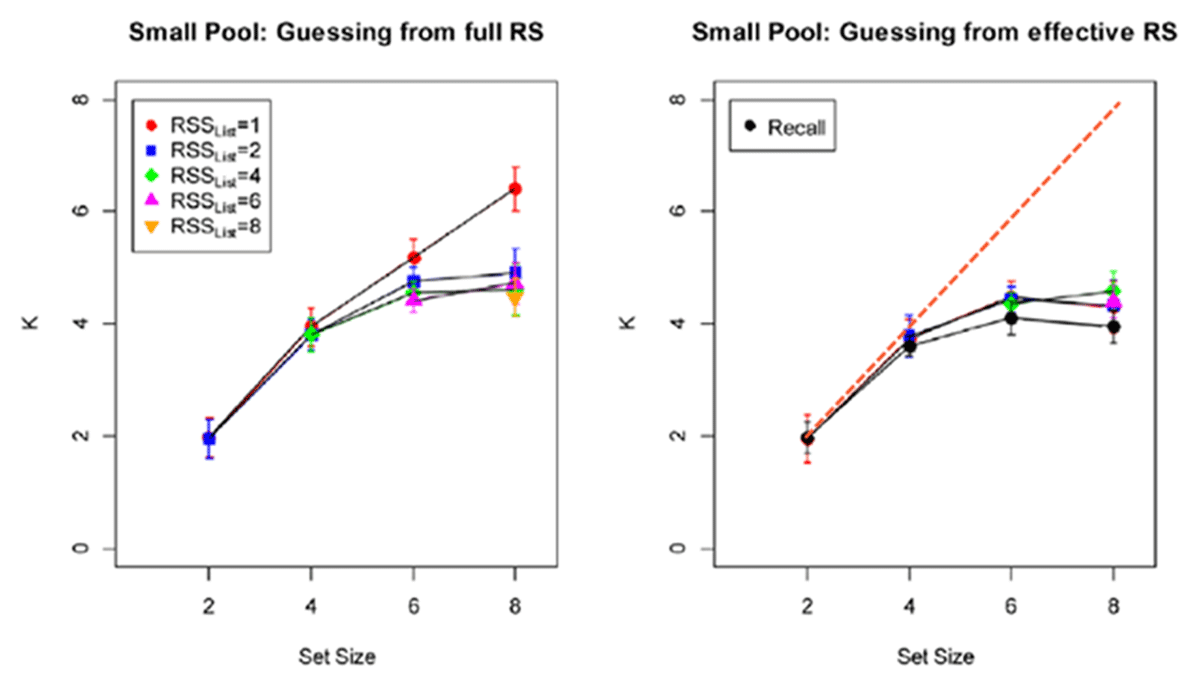
Figure 2
Capacity estimates for guessing from the full response set (left-hand panel) or the effective response set, i.e., excluding lures provided outside of the list items (right-hand panel). Reproduced from Oberauer (2019), Figure 7, bottom half of figure, except that the dashed line on the right has been added to represent the prediction of ceiling-level performance for the RSSList = 1 condition.
Table 2
Data For lists of 4, 6, or 8 Items Tabulated from Oberauer (2019, Experiment 2), and the Distribution of Response Choices When Both Kinds of Errors were Possible.
| List | Response Choices | pCorr | p(Errors from List) | n of pL | SEM of pL | |||
|---|---|---|---|---|---|---|---|---|
| Length | In List | Not inList | pEFL | pLRG | pL | |||
| 4 | 2 | 2 | 0.95 | .02 | 0.33 | 0.36 (.68) | 10 (7) | 0.20 (.16) |
| 4 | 4 | 4 | 0.96 | .04 | 0.43 | 0.91 (.91) | 8 (8) | 0.06 (.06) |
| 6 | 2 | 2 | 0.86 | .08 | 0.33 | 0.48 (.62) | 18 (15) | 0.11 (.10) |
| 6 | 4 | 4 | 0.80 | .14 | 0.43 | 0.55 (.59) | 17 (16) | 0.09 (.08) |
| 6 | 6 | 4 | 0.75 | .21 | 0.48 | 0.48 (.71) | 20 (16) | 0.13 (.08) |
| 8 | 2 | 2 | 0.75 | .13 | 0.33 | 0.20 (.30) | 20 (17) | 0.07 (.05) |
| 8 | 4 | 4 | 0.62 | ,24 | 0.43 | 0.40 (.48) | 20 (18) | 0.09 (.08) |
| 8 | 6 | 4 | 0.62 | .30 | 0.56 | 0.51 (.61) | 20 (17) | 0.08 (.06) |
| 8 | 8 | 4 | 0.62 | .29 | 0.64 | 0.40 (.60) | 20 (15) | 0.10 (.08) |
[i] Note: Abbreviations: pCorr is proportion correct, pEFL refers to the proportion of responses that were selections of lures coming from the list, and pLRG is the proportion of errors that should be to lures coming from the list if random guessing always occurs among all choices, not just the choices from the list. The term pL is the estimated proportion of erroneous responses that occurred through the process of guessing only from the list items, as opposed to guessing from all choices. The number of participants n for pL in some conditions is limited because of the exclusion of participants with error-free performance. The numbers in parentheses occur when individual negative estimates of pL are omitted. SEM is the standard error of the mean of pL. A mixture of trials with guessing from the list items and from all items can be inferred because pLRG < pL < 1.
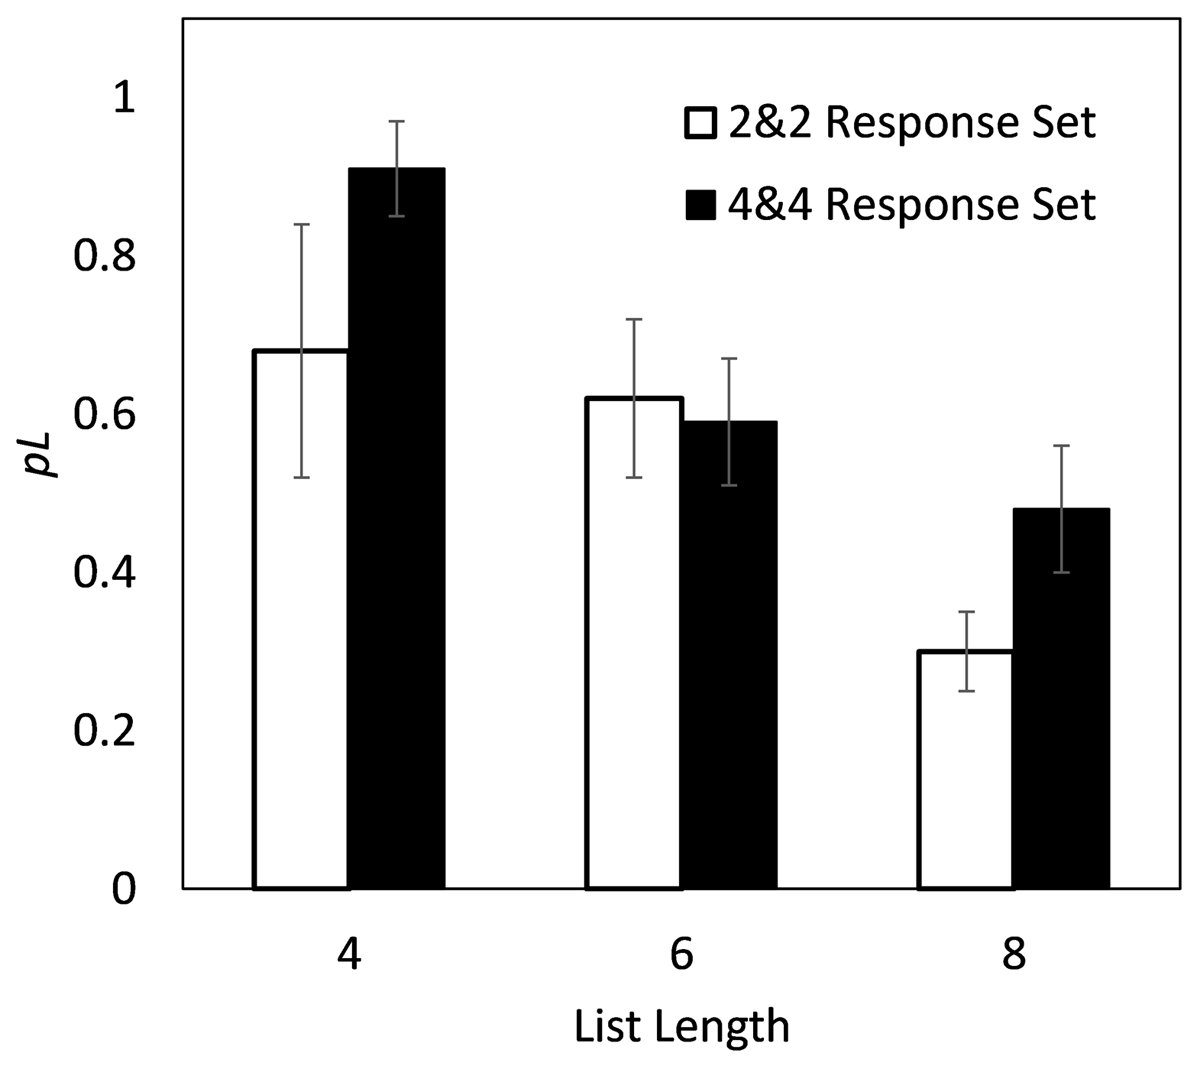
Figure 3
The decrease in the mean pL, the estimated proportion of erroneous responses based on guessing from only the list items, as a function of list length with two different response sets (trials with 2 items from the list and 2 not from the list, and trials with 4 items from the list and 4 not from the list). The graph is based on the data depicted in parentheses in Table 2, with estimates of pL below zero removed. Error bars reflect plus and minus one standard error of the mean.