
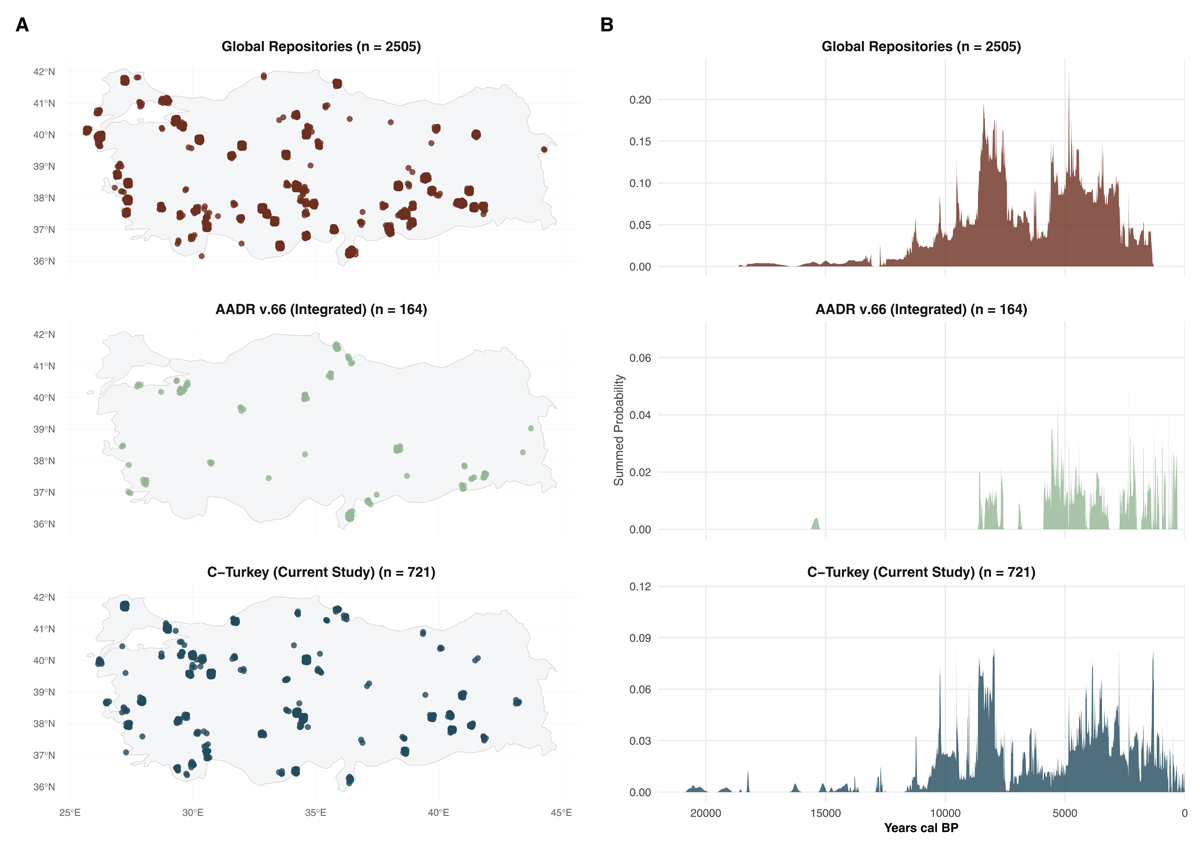
Figure 1
Spatial and Temporal Distribution of the C-Turkey Dataset.
(A) Faceted maps showing the density of radiocarbon sites across Türkiye. Top panel represents records harvested from global repositories via C14bazaar; middle panel shows direct dates integrated from the AADR v.66 [6]; bottom panel displays the newly curated entries from regional literature and excavation reports.
(B) Summed Probability Distributions (SPD) of radiocarbon determinations (calibrated with IntCal20) for each data source [7]. The SPD illustrate the chronological coverage and research intensity, highlighting the contribution of the C-Turkey dataset in filling regional temporal gaps. All dates are shown in years cal BP.
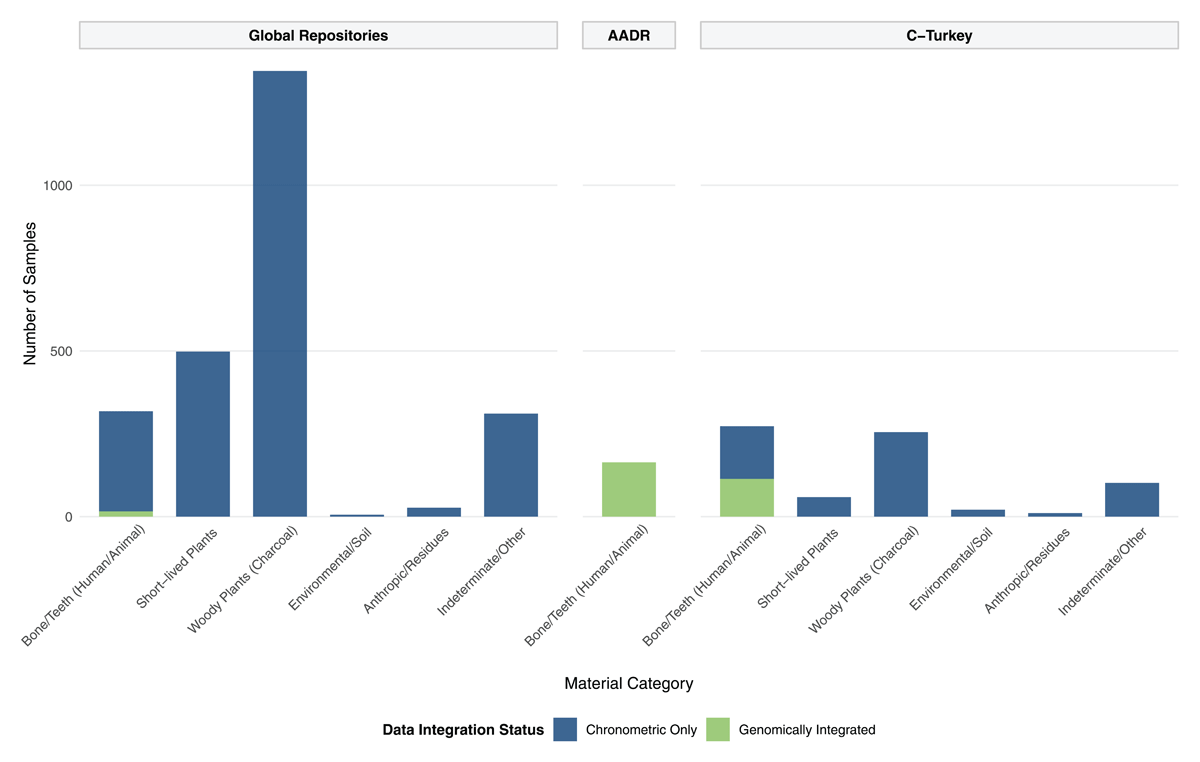
Figure 2
Taxonomic Composition and Genomic Integration of the C-Turkey Dataset.