
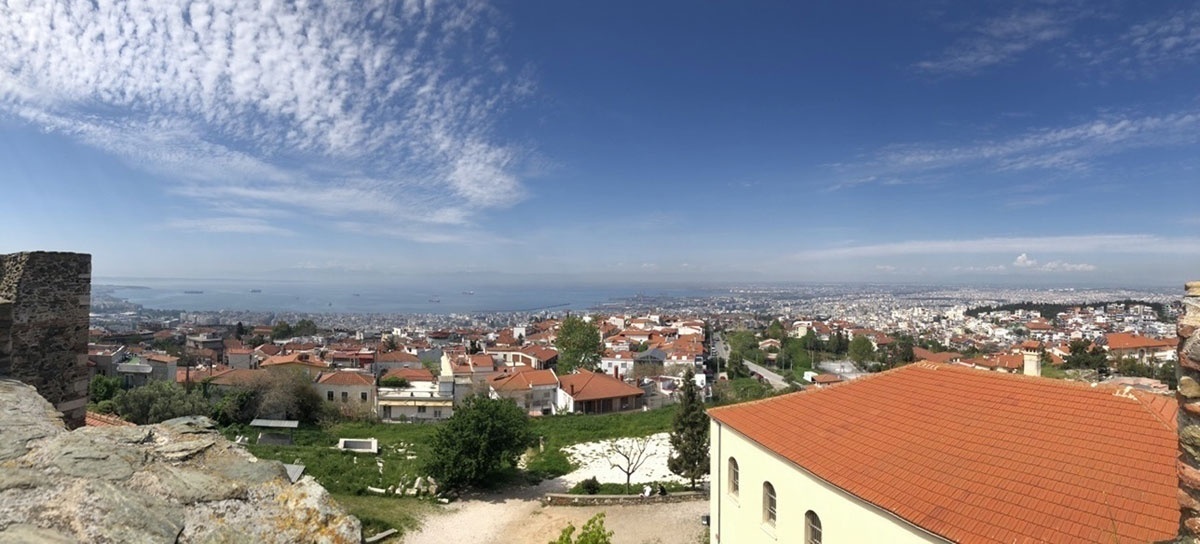
Figure 1
View of Thessaloniki from the Eptapyrgio fortress (photo by the author).
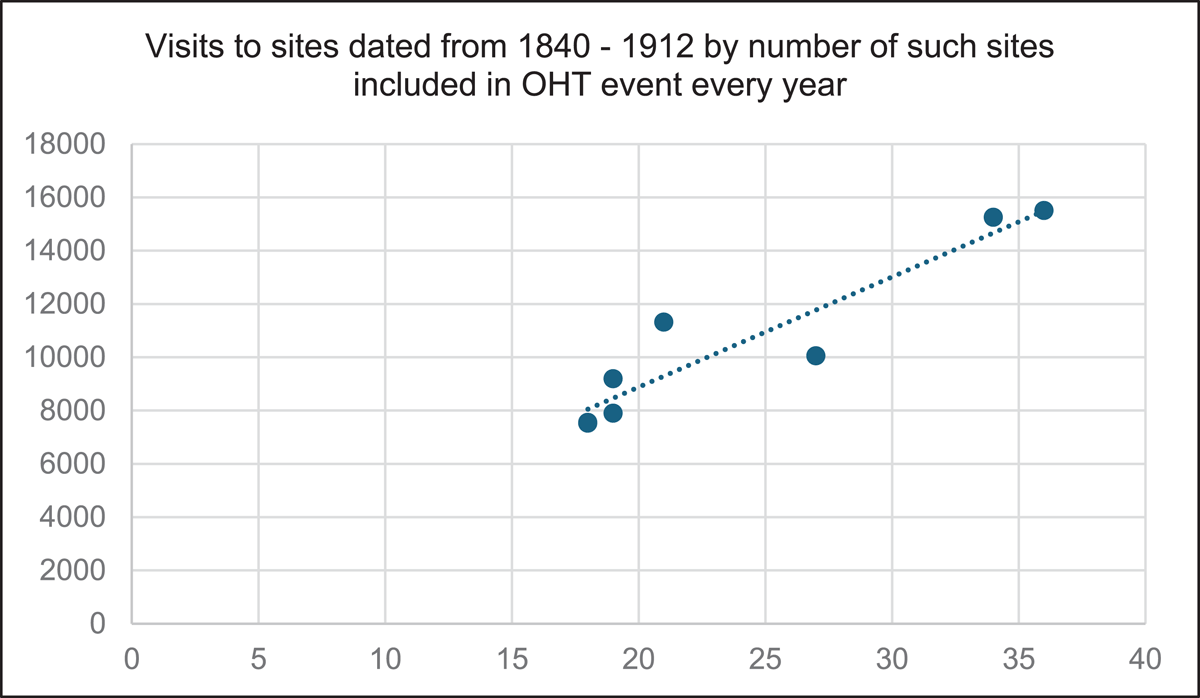
Graph 1
Example of Scatter Plot demonstrating the relationship between number of visits and number of sites dating from 1840 up to 1912 for the period between 2016 and 2025, excluding 2020 and 2021.
Table 1
Total number of sites included in every Open House Thessaloniki event from 2016–2025.
| 316/315 BC – 330 AD | 331 AD – 1430 | 1431 – 1839 | 1840 – 1912 | 1913 – 1947 | 1948 – 1978 | 1979 – TODAY | TOTAL | |
|---|---|---|---|---|---|---|---|---|
| 2016 | 2 | 4 | 5 | 21 | 18 | 12 | 21 | 83 |
| % | 2% | 5% | 6% | 25% | 22% | 14% | 25% | |
| 2017 | 3 | 4 | 4 | 26 | 26 | 15 | 20 | 98 |
| % | 3% | 4% | 4% | 27% | 27% | 15% | 20% | |
| 2018 | 3 | 6 | 6 | 33 | 27 | 8 | 18 | 101 |
| % | 3% | 6% | 6% | 33% | 27% | 8% | 18% | |
| 2019 | 4 | 8 | 4 | 36 | 27 | 10 | 14 | 103 |
| % | 4% | 8% | 4% | 35% | 26% | 10% | 14% | |
| 2020 | . | . | . | . | . | . | . | . |
| 2021 | . | . | . | . | . | . | . | . |
| 2022 | 2 | 4 | 1 | 19 | 21 | 8 | 10 | 65 |
| % | 3% | 6% | 2% | 29% | 32% | 12% | 15% | |
| 2023 | 4 | 3 | 2 | 18 | 17 | 12 | 15 | 71 |
| % | 6% | 4% | 3% | 25% | 24% | 17% | 21% | |
| 2024 | 2 | 6 | 2 | 18 | 15 | 14 | 13 | 70 |
| % | 3% | 9% | 3% | 26% | 21% | 20% | 19% | |
| 2025 | . | 6 | 3 | 18 | 18 | 14 | 14 | 73 |
| % | . | 8% | 4% | 25% | 25% | 19% | 19% |