
(1) Overview
Context
This dataset is a georeferenced and digitized version of the Map of Indian Tribes of North America, published initially by Driver et al. in 1953 [1]. The digital dataset faithfully reproduces and spatially references the ethnolinguistic boundaries depicted on the printed map. The original map served as a foundational spatial resource for two of Driver’s major comparative studies—Comparative Studies of North American Indians [2] and Indians of North America [3], both of which relied on it to visualize and analyze geographic patterns of cultural traits.
Driver’s 1953 map represented the fourth significant anthropological effort to delineate the tribal and linguistic geography of North America, following earlier maps by Kroeber [4], Murdock [5], and Voegelin and Voegelin [6]. It thus occupies a pivotal position in the historical development of anthropological cartography, bridging early twentieth-century ethnographic compilations with the systematic, comparative approaches that characterized mid-century anthropology.
The scholars behind the map, including Harold E. Driver and his collaborators, belonged to what Jorgensen [7] described as the second generation of anthropologists conducting field and archival research among Indigenous peoples of North America. The first generation—figures such as Franz Boas, Alfred Kroeber, Edward Sapir, and Robert Lowie—had established the ethnographic and linguistic foundations on which Driver’s synthesis was built. The 1953 map drew upon this earlier corpus while integrating newly available ethnographic observations published after Kroeber’s 1941 synthesis, as well as unpublished field data and regional expertise contributed by Driver’s colleagues. The linguistic family classifications incorporated into the map derive primarily from Mason [8], Hoijer [9], and Voegelin and Voegelin [6].
Despite its title, the map does not depict discrete “tribes” in the political sense but rather the approximate ranges of ethnolinguistic units defined broadly as “any sort of territorial, political, linguistic, or cultural group that any authority in any area chooses to differentiate from other such groups” [1, p. 2]. This inclusive definition reflects the diversity and uneven quality of the ethnographic record. Many Indigenous groups were incompletely documented, and some had ceased to exist as distinct entities before sustained contact with European observers. The resulting map, therefore, combines cultural, linguistic, and political groupings under a single framework that approximates pre-contact and early-contact distributions.
The original printed map distinguished among three types of boundaries—those of linguistic families, individual languages, and tribes or local groups. In this georeferenced version, these distinctions are not maintained. Instead, each polygon represents the smallest identifiable ethnolinguistic unit that could be reliably extracted from the 1953 map, reflecting the finest spatial resolution available from the source materials.
The dataset carries important temporal and spatial limitations inherent to the map’s compilation. The ethnographic information assembled by Driver and colleagues spans several centuries, combining sources of widely varying dates and reliability. Data for Mexico and Central America derive mainly from the sixteenth to twentieth centuries; for the eastern United States, primarily from seventeenth-century records; for the Plains, from the late eighteenth and early nineteenth centuries; for southern and eastern Canada, from the seventeenth to eighteenth centuries; and for other regions of North America, chiefly from nineteenth-century accounts [1, pp. 1–2]. These chronological disparities mean that the mapped distributions should be interpreted as generalized approximations of ethnolinguistic geography rather than as snapshots of any single historical period.
Certain cartographic generalizations were also introduced by Driver and his collaborators to enhance readability. Uninhabitable or sparsely populated areas—such as mountain crests and arid desert interiors—were excluded even when they may have fallen within broader territorial ranges [1, p. 2]. Conversely, the territories of smaller but ethnographically important groups, particularly in the western United States and Mexico, were intentionally enlarged to ensure visibility on the printed sheet. The Pueblo peoples are among the clearest examples of such cartographic adjustments, reflecting Driver’s intent to produce a map suitable for plotting cultural-trait distributions across the continent.
Given these sources of uncertainty, the dataset is best suited for large-scale or comparative spatial analyses—such as continental or subcontinental studies of cultural, ecological, or linguistic diversity—where local inaccuracies are unlikely to influence analytical outcomes significantly. Users should exercise caution when employing these data for fine-grained or site-specific analyses, as the original map’s precision does not support high-resolution spatial interpretation.
Finally, it is important to acknowledge that this dataset reproduces the tribal and ethnolinguistic names as they appeared in the 1953 publication [1]. Some of these names may have changed, fallen out of use, or come to be regarded as outdated or offensive. The terminology and boundaries presented here reflect the anthropological conventions of their time and should not be interpreted as accurate representations of contemporary Indigenous identities, affiliations, or territorial claims. Consequently, this dataset must not be used for land acknowledgements, territorial assertions, or any legal or administrative purposes.
Spatial coverage
Description: North America and Central America
Northern boundary: 4407384.81
Southern boundary: –3526635.59
Eastern boundary: 2990742.50
Western boundary: - –3610406.78
Temporal coverage
From the 16th to the 20th century
(2) Methods
Steps
The Map of Indian Tribes of North America was first scanned at high resolution and georeferenced using the printed grid intersections visible on the original map. These gridlines were assumed to correspond to the NAD27 geographic coordinate system (EPSG: 4267), a standard reference for many mid-twentieth-century cartographic products. To improve spatial accuracy, additional control points were derived from distinct and geographically stable features—such as prominent river confluences, coastlines, and major lakes—whose real-world coordinates were verified using modern geospatial datasets. A thin-plate spline transformation was applied to account for the map’s local distortions while preserving its overall geometry. Following georeferencing, the raster image was reprojected to the North America Albers Equal Area Conic projection (ESRI:102008) to enable reliable calculation of surface areas and other spatial statistics.
Ethnolinguistic territories were then digitized as polygon features representing the extents depicted on the historical map (Figure 1). During this process, no distinction was made between the various boundary types shown in the original legend, which often reflect differences in data certainty or cultural overlap rather than strict territorial demarcation. Each resulting polygon was attributed with three principal fields:
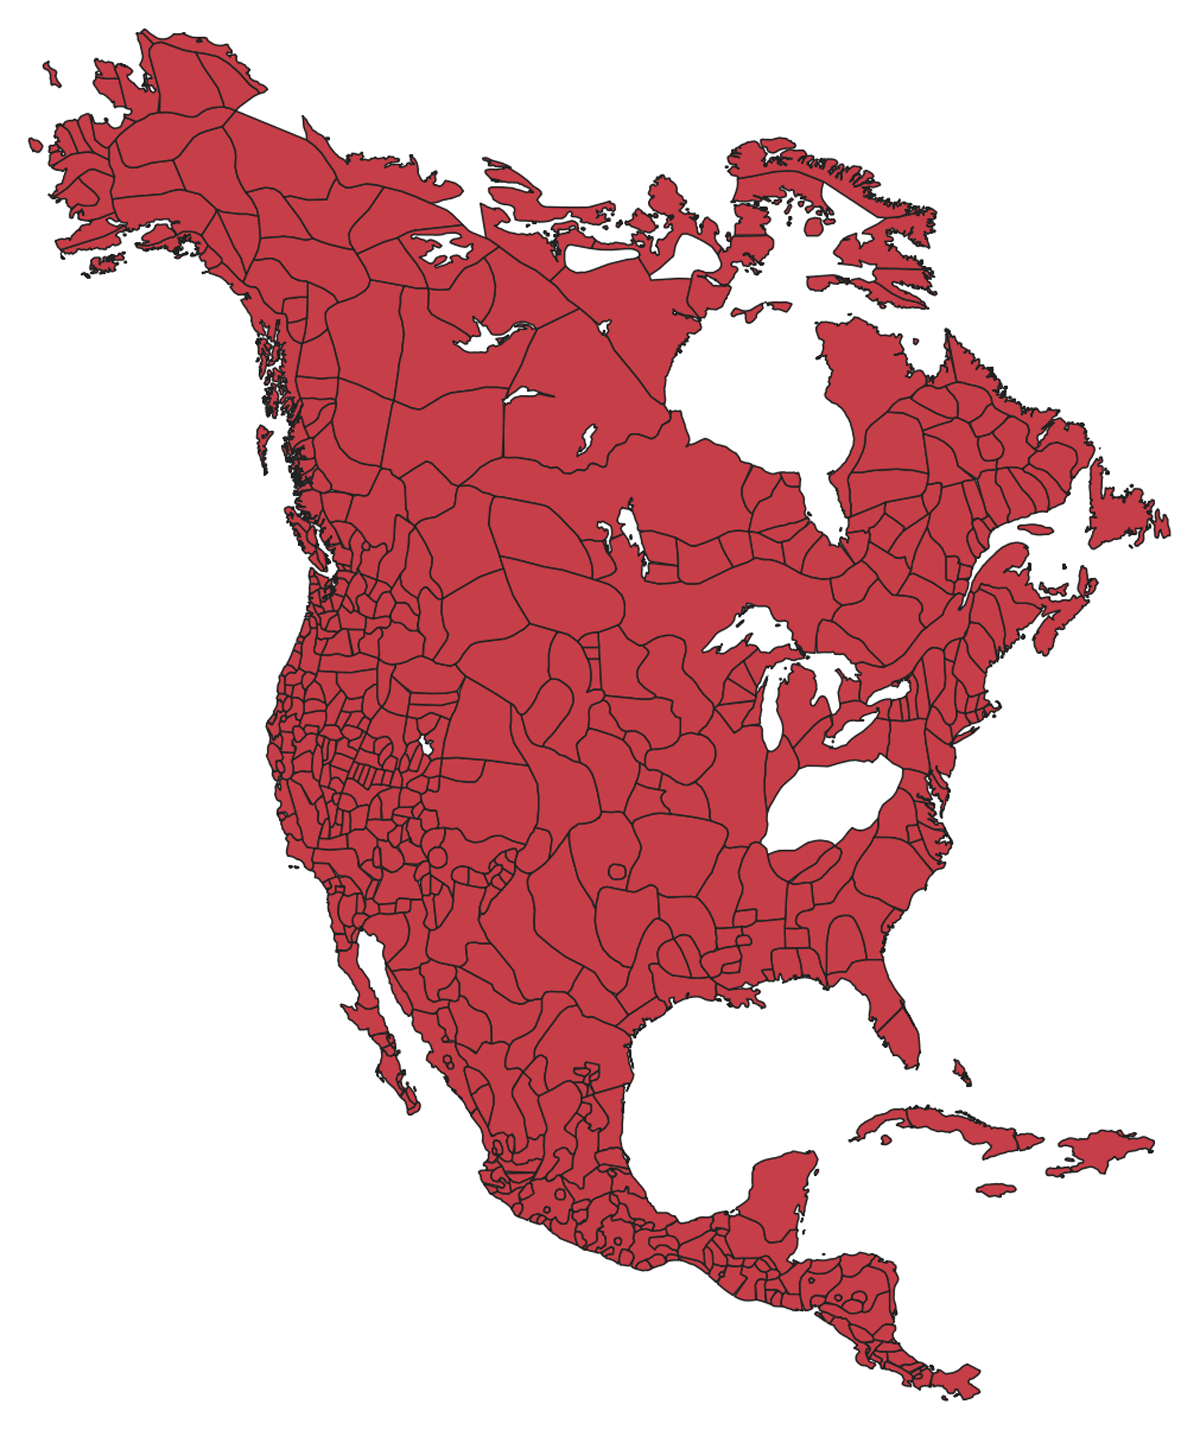
Figure 1
The Driver et al. 1954 Ethnolinguistic territories of America.
Name – the principal ethnolinguistic group associated with the polygon, when such a designation was available. In cases where the original map depicted multiple groups within a shared or composite area, this field records one of those names rather than implying exclusive representation.
Other – alternate names appearing on the map or in related ethnographic sources; and
Language F. – the associated language family, identified using Driver et al.’s Index of Tribal Names [1].
Ambiguous boundaries in the Arctic region, where the source map offered limited precision, were refined using the regional syntheses provided by Damas [10]. To further enhance geographic fidelity, all digitized polygons were adjusted to conform to a high-resolution continental basemap supplied through the IUCN Red List GIS Tools, Software, and Recommended Base Data package [11]. In cases where the scanned map extended beyond the contemporary shoreline, polygon edges were clipped to align with the authoritative coastlines of this reference dataset. These procedures together ensured that the resulting vector dataset accurately represents the ethnolinguistic distributions portrayed on the original map while maintaining compatibility with modern geospatial analyses.
(3) Dataset description
Object name
Driver et al, 1953 Ethnolinguistic territories of America
Data type
Processed geographic data.
Format names and versions
Shapefile (.shp with associated .shx, .dbf, .prj, and .cpg files)
Creation dates
06/01/2025–06/18/2025
Dataset Creators
Charles Perreault, data creator, Arizona State University
Language
English
License
CC BY-NC 2.5.
Repository location
Publication date
October 7, 2025
(4) Reuse potential
This georeferenced polygon dataset of North American Indigenous ethnolinguistic groups offers a robust spatial foundation for a range of comparative, historical, and environmental research. Its core value lies in providing an explicitly geospatial framework for examining the distribution of cultural and linguistic diversity across the continent. By systematically converting a key mid-twentieth-century anthropological synthesis [1] into a modern GIS-compatible format, the dataset enables new forms of quantitative and spatial analysis that were not feasible when the original map was produced.
In comparative and cross-cultural archaeology, the dataset can be reused to investigate how ecological, geographic, or climatic factors have shaped cultural adaptation, subsistence strategies, and social organization. It provides a spatial template for linking cultural-trait distributions—such as kinship systems, settlement patterns, or technological practices—to environmental variables including temperature, precipitation, and biome type. The explicit delineation of territorial ranges allows researchers to compute measures such as range size, habitat diversity, and latitudinal spread, facilitating the kind of large-scale analyses that have become central to macroevolutionary and cultural phylogenetic approaches.
In historical anthropology and linguistics, the dataset can serve as a reference framework for evaluating how ethnolinguistic territories have been conceptualized and represented in successive generations of scholarship. When combined with subsequent linguistic databases or ethnohistorical records, it supports diachronic comparisons of classification schemes, revealing shifts in both geographic knowledge and anthropological theory.
Because the dataset is fully georeferenced, it also integrates readily with other forms of spatial data. It can be intersected or overlaid with ecological, climatic, or biogeographic datasets to explore relationships between human cultural variation and environmental gradients. Similarly, it can be joined with archaeological site databases or cultural-trait inventories to assess spatial autocorrelation, biogeographical patterning, or processes of cultural diffusion. These capabilities make it useful across disciplines that combine spatial analysis with comparative or historical inference, including human ecology, cultural evolution, environmental archaeology, and historical linguistics.
Beyond research applications, the dataset also holds potential for educational and curatorial use. Its visual clarity and historical provenance make it a valuable resource for teaching the history of anthropology, Indigenous studies, and the evolution of ethnographic mapping. Historians of anthropology may find it useful for examining how Indigenous territories were conceptualized, generalized, and represented in twentieth-century anthropological mapping practices. As such, this dataset is suitable not only for empirical analysis but also for critical reflection on the epistemological and representational history of ethnographic cartography.
Competing Interests
The author has no competing interests to declare.