
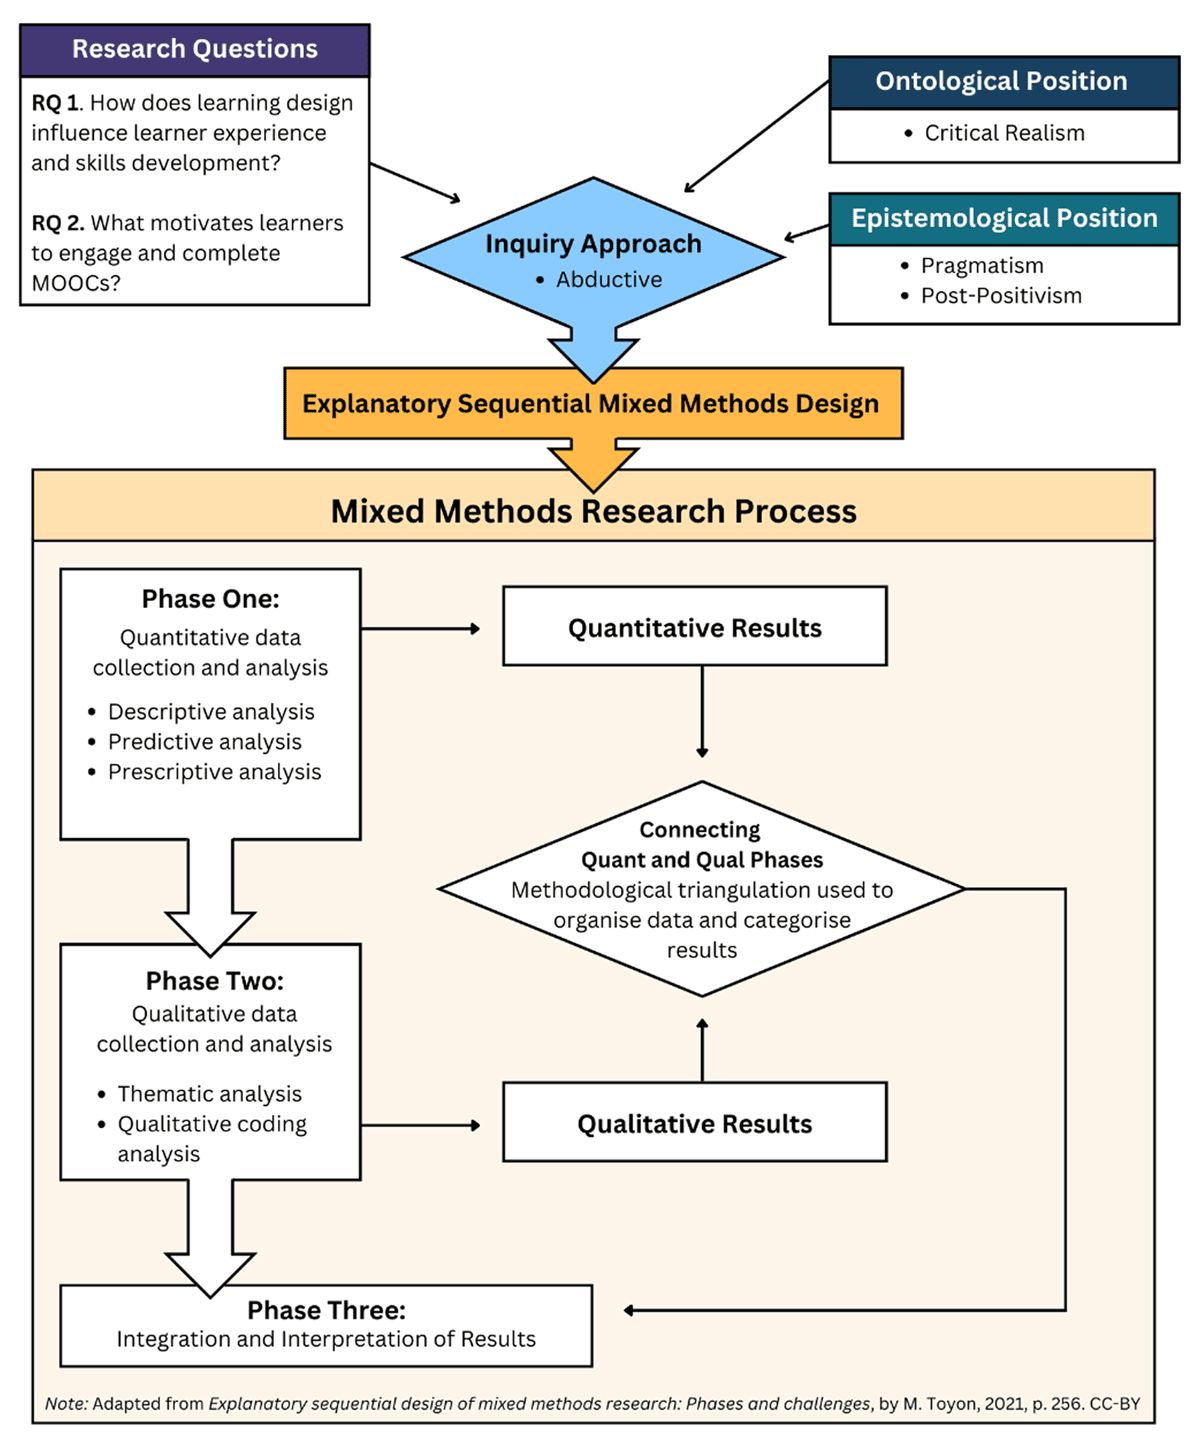
Figure 1
Conceptual Framework for the Explanatory Sequential Mixed Methods Design.
Table 1
Description of MOOCs selected for research.
| SELECTED COURSES | PLATFORM | DISCIPLINE | COURSE DURATION | COURSE LEVEL |
|---|---|---|---|---|
| Course A | Coursera | Medicine and Data Visualisation | 4 Weeks | Intermediate |
| Course B | Coursera | Diversity and Inclusion | 4 Weeks | Intermediate |
| Course C | FutureLearn | Creative Arts and History | 5 Weeks | Beginner |
| Course D | FutureLearn | Education | 3 Weeks | Beginner |
| Course E | FutureLearn | Culture and History | 4 Weeks | Beginner |
| Course F | FutureLearn | Computer Science | 6 Weeks | Intermediate |
| Course G | FutureLearn | Health and Medicine | 2 Weeks | Beginner |
| Course H | FutureLearn | Teaching and Data Science | 3 Weeks | Beginner |
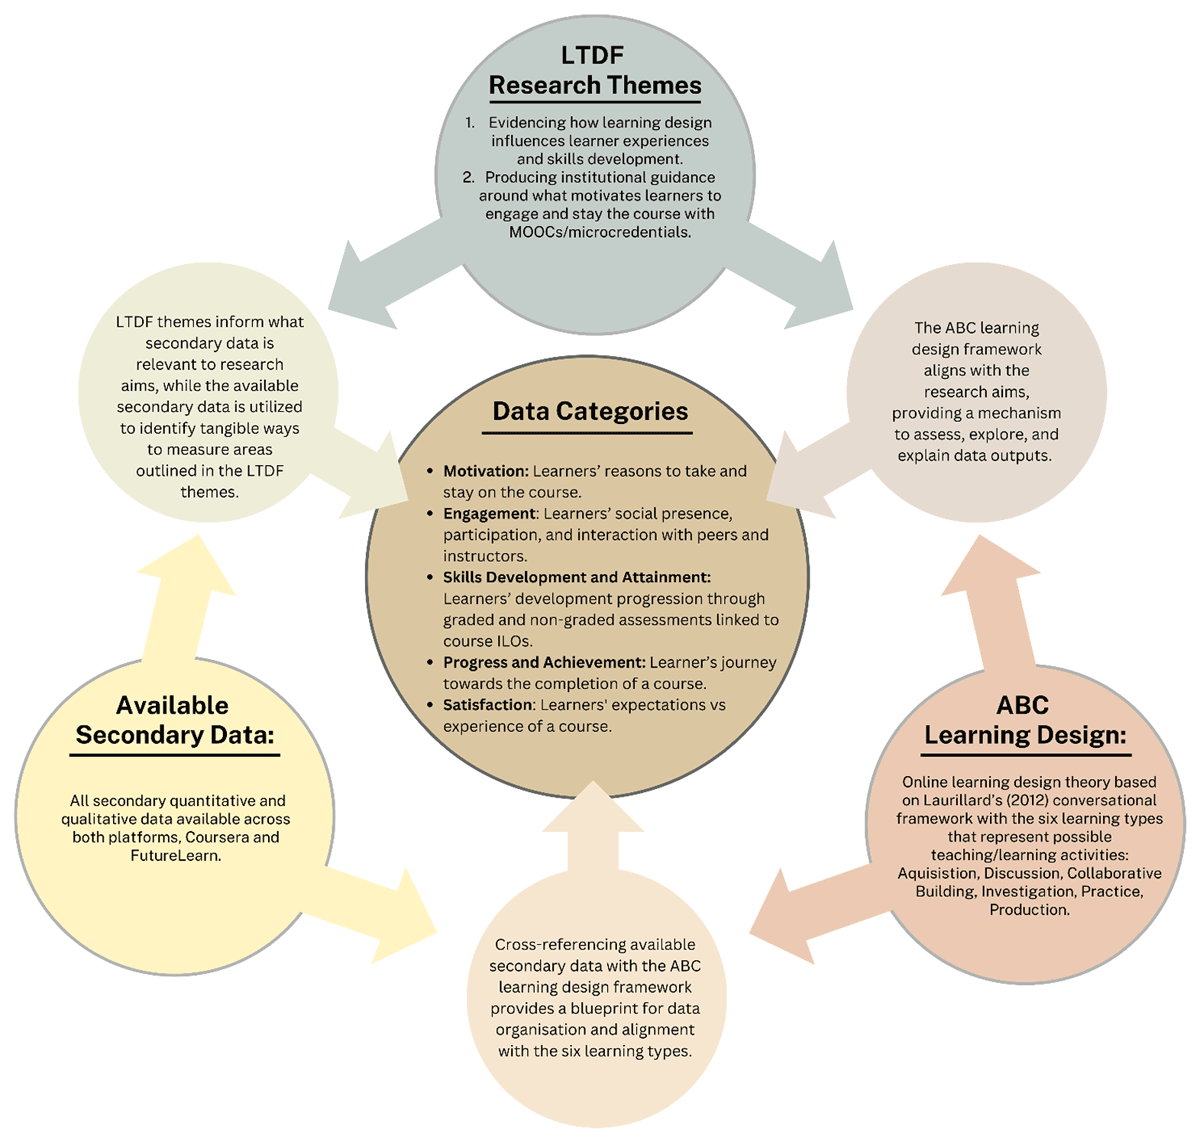
Figure 2
Triangulation Method Used for the Creation of Data Categories.
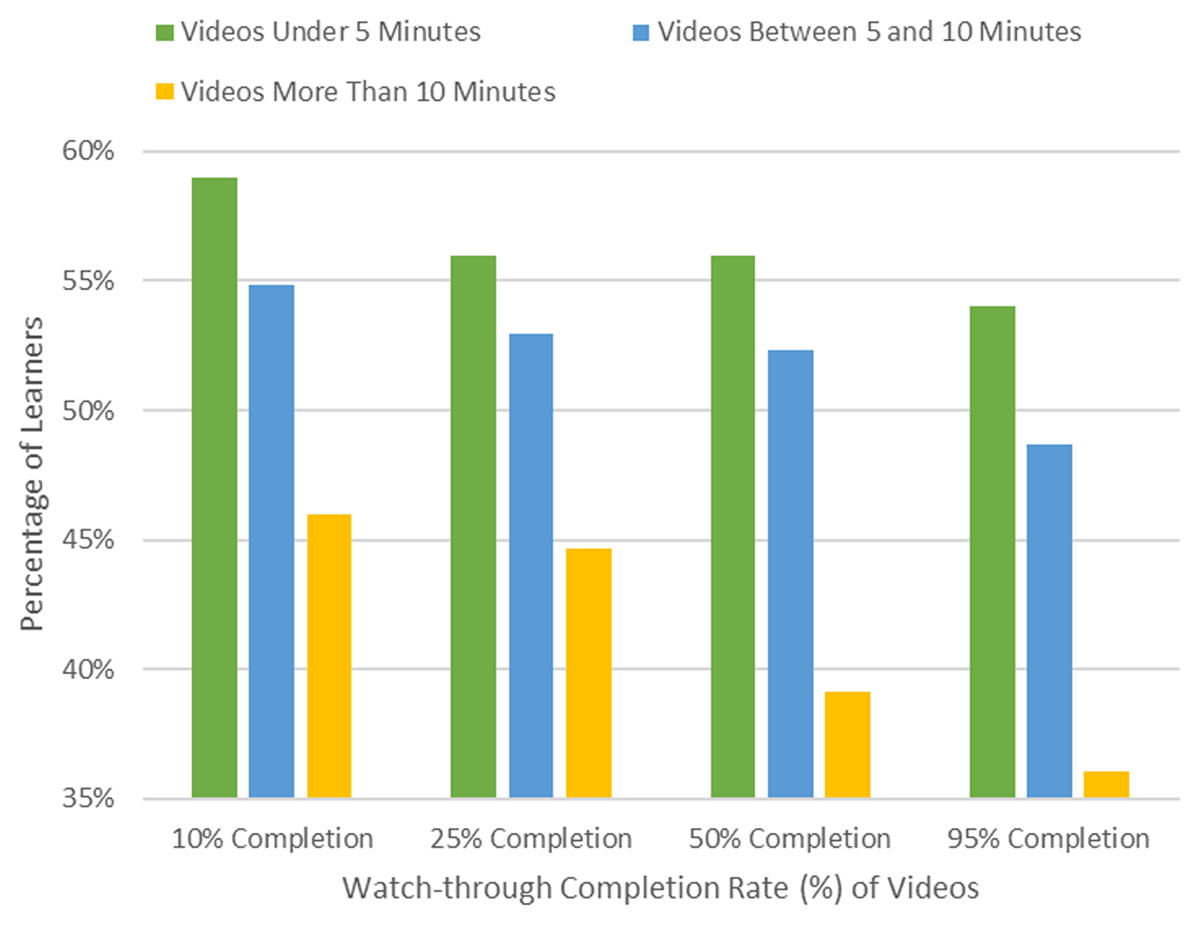
Figure 3
FutureLearn Drop-off Rate.
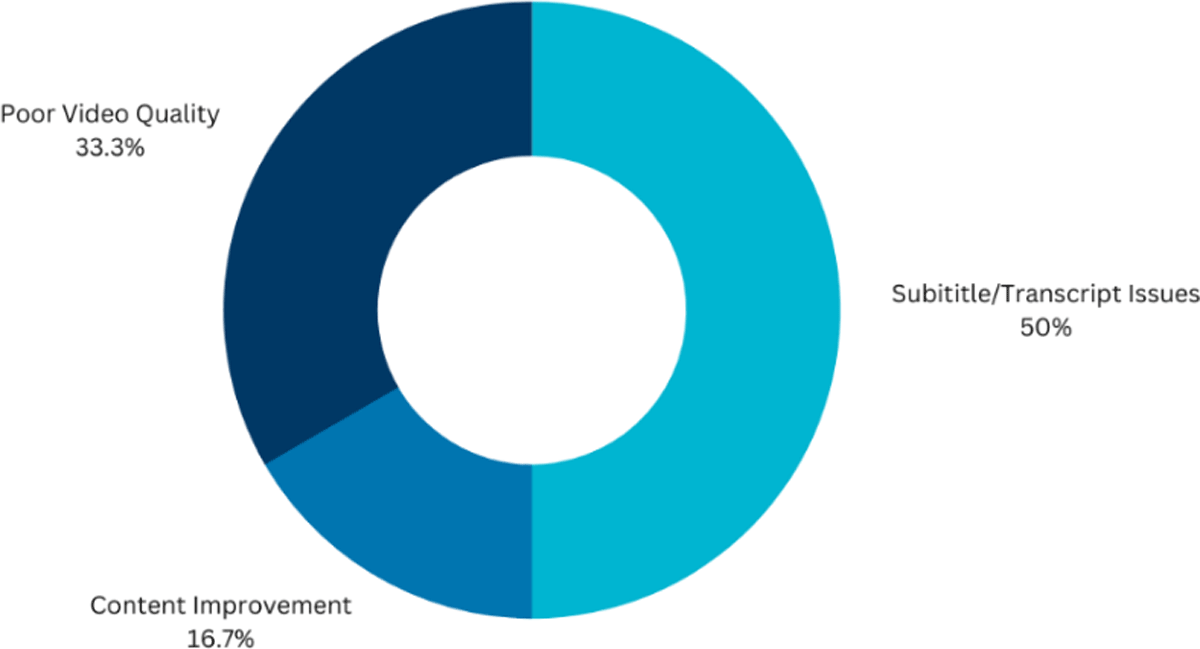
Figure 4
Reasons learners dislike videos, Coursera.
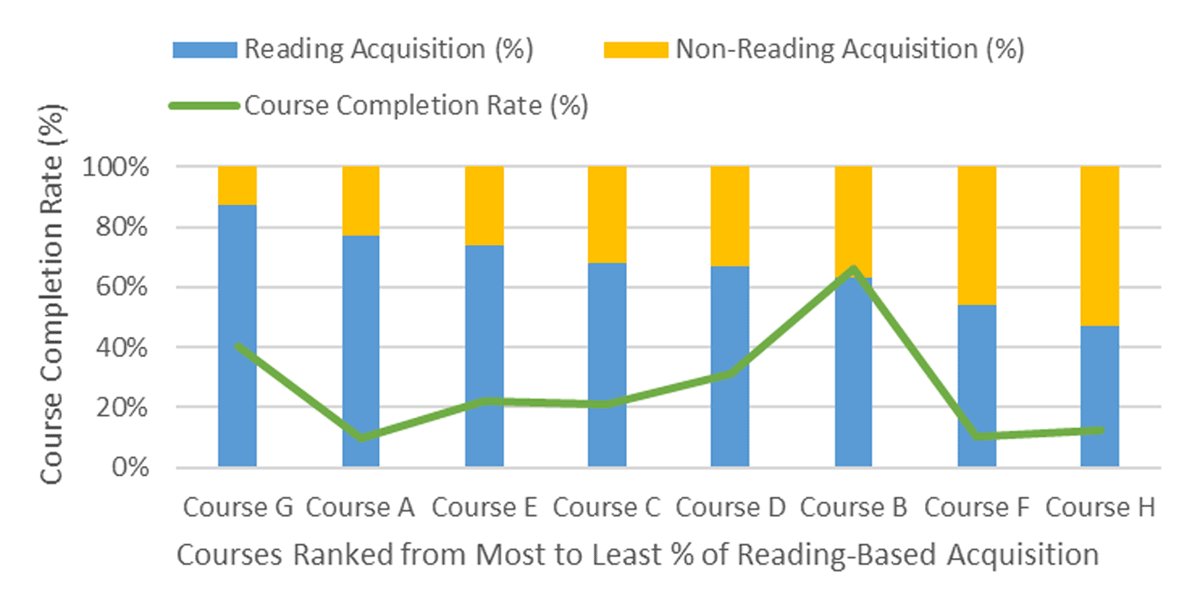
Figure 5
Acquisition Distribution Impact on Course Completion.
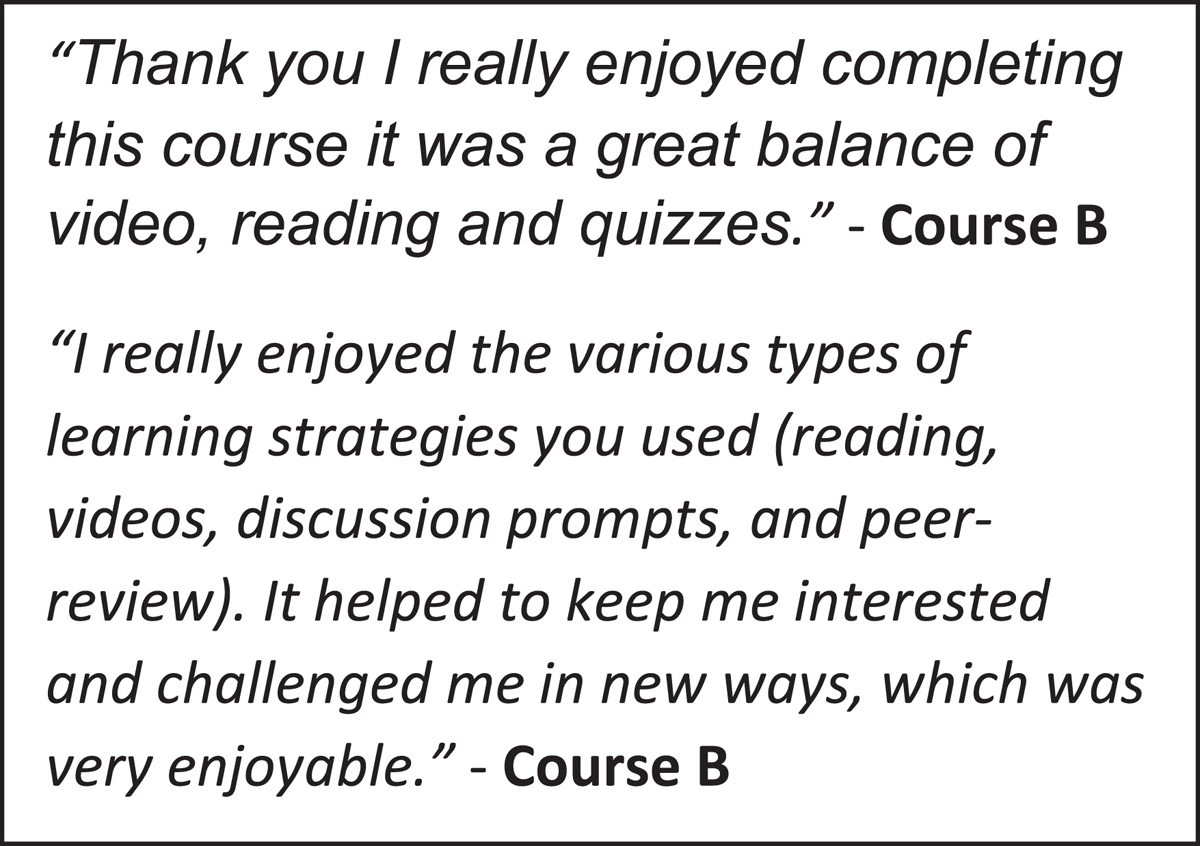
Figure 6
Quotes from Learner Feedback.
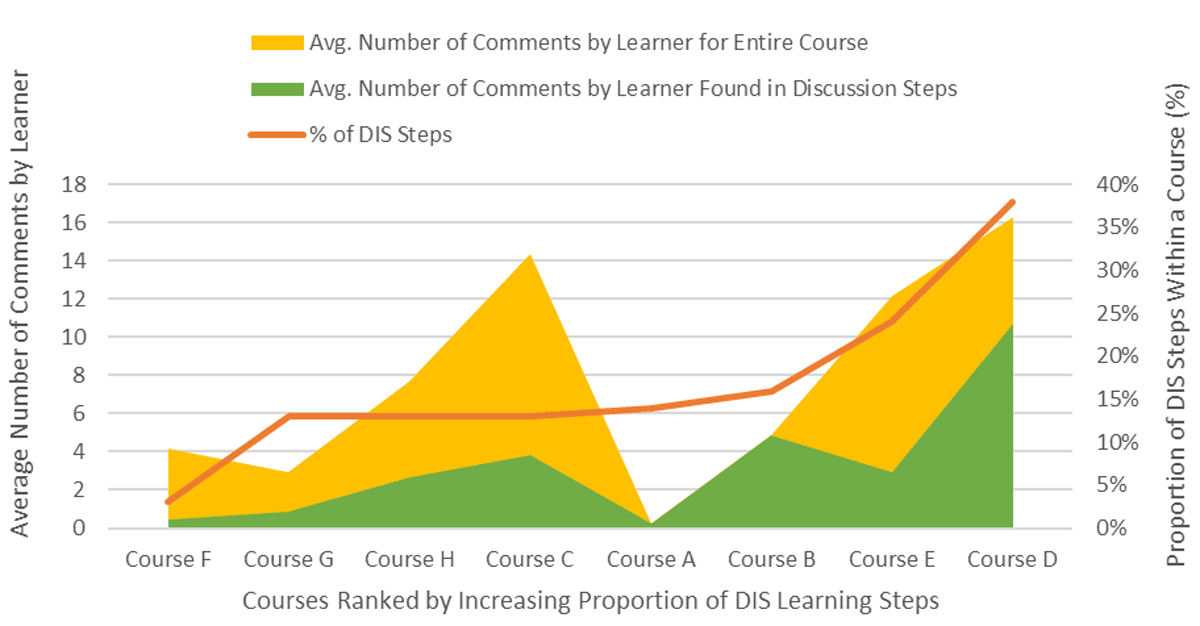
Figure 7
Increased Engagement Caused by Discussion (DIS) Learning Types.
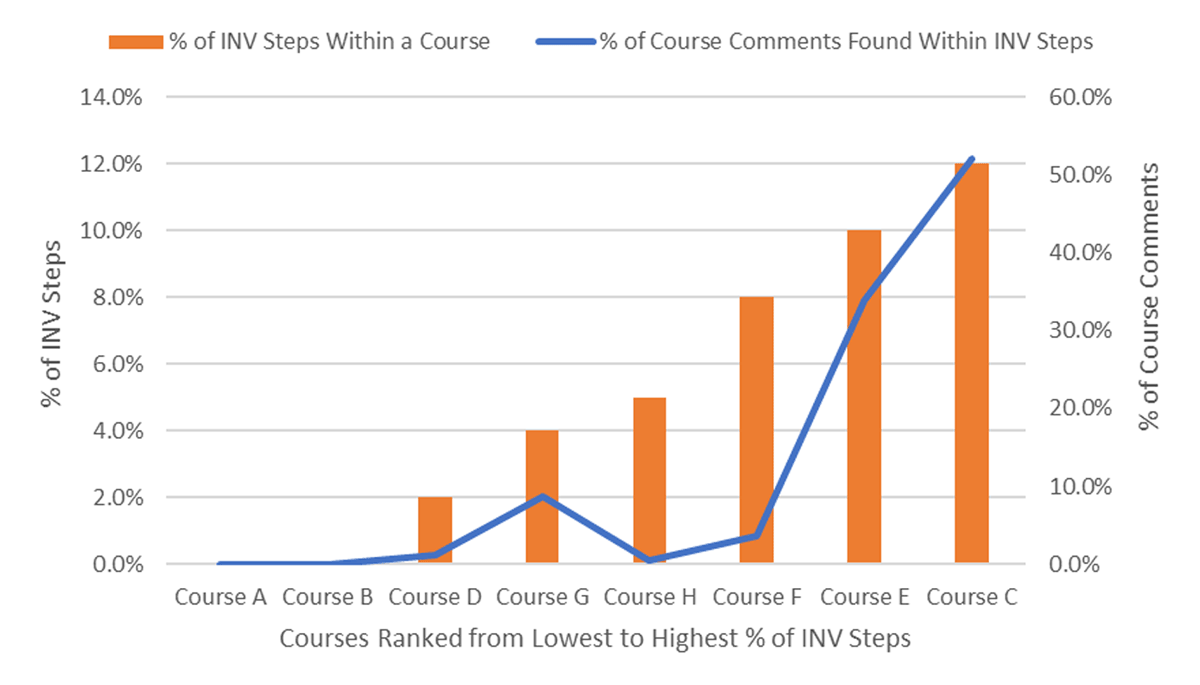
Figure 8
Impact of Effective Investigation (INV) Steps on Engagement.

Figure 9
Quotes from Learner Feedback.
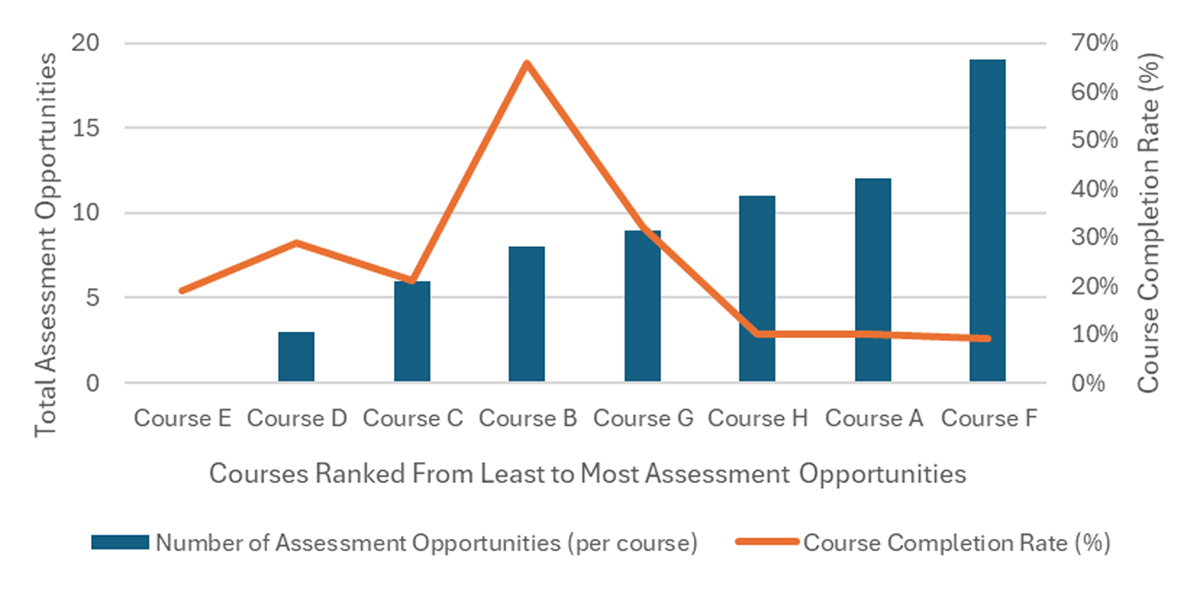
Figure 10
Assessment Opportunity Impact on Course Completion Rate (%).
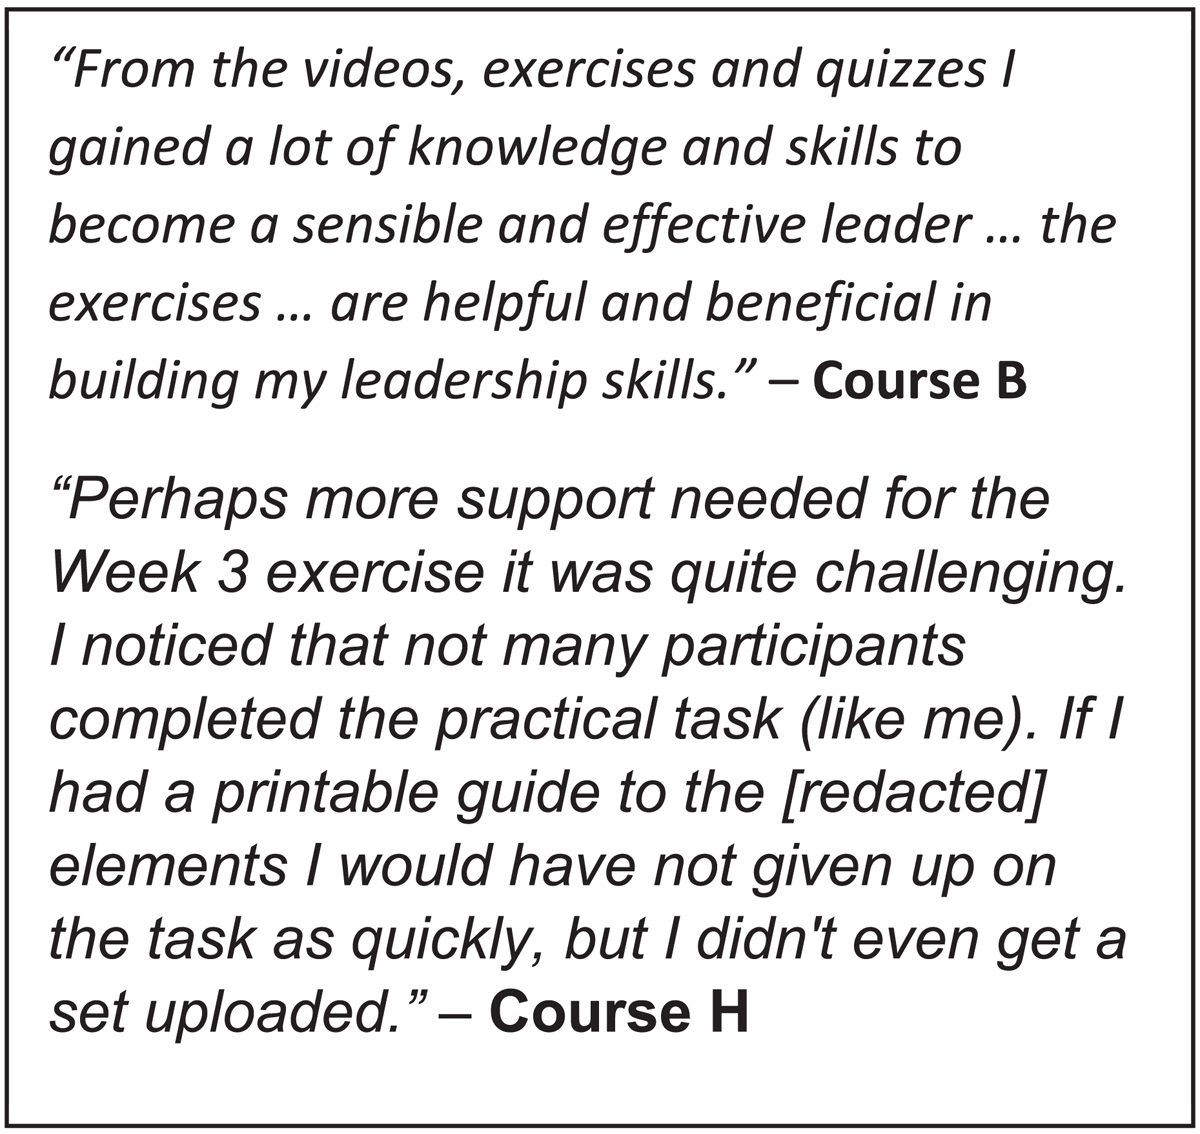
Figure 11
Quotes from Learner Feedback.
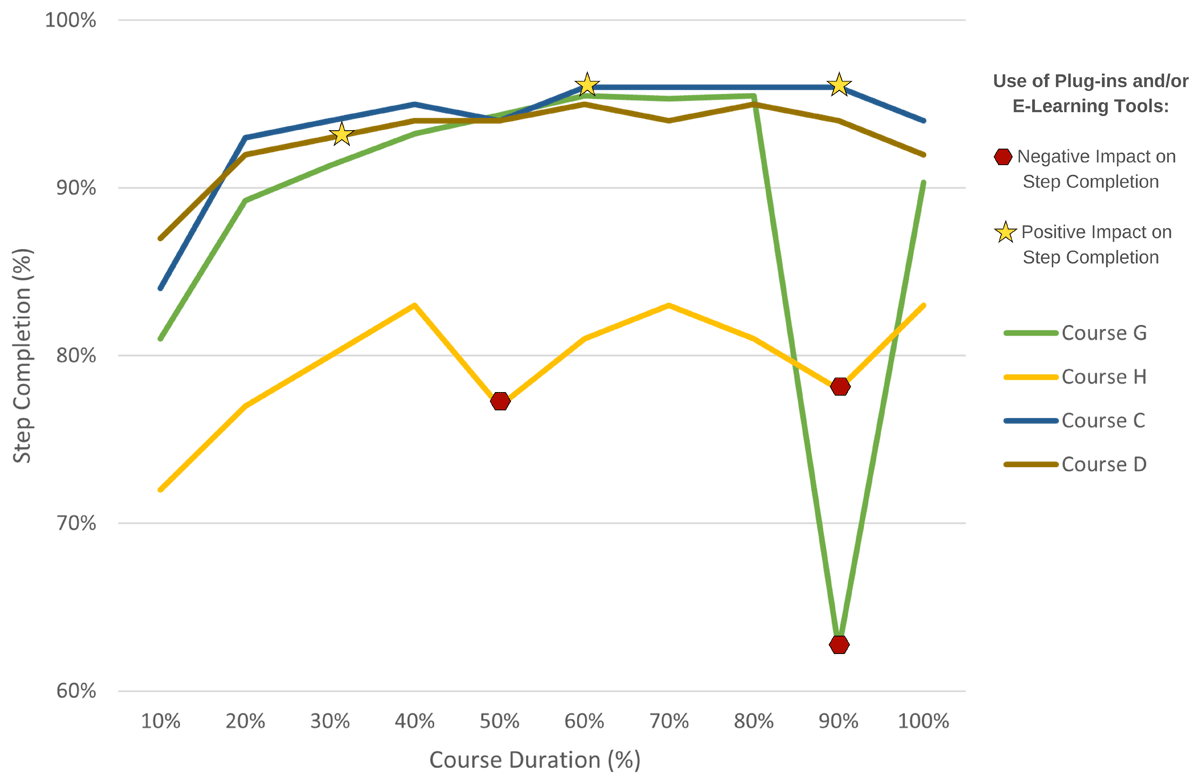
Figure 12
Impact of Plug-ins and E-Learning Tools on Step Completion Rates (%) on FutureLearn Courses.
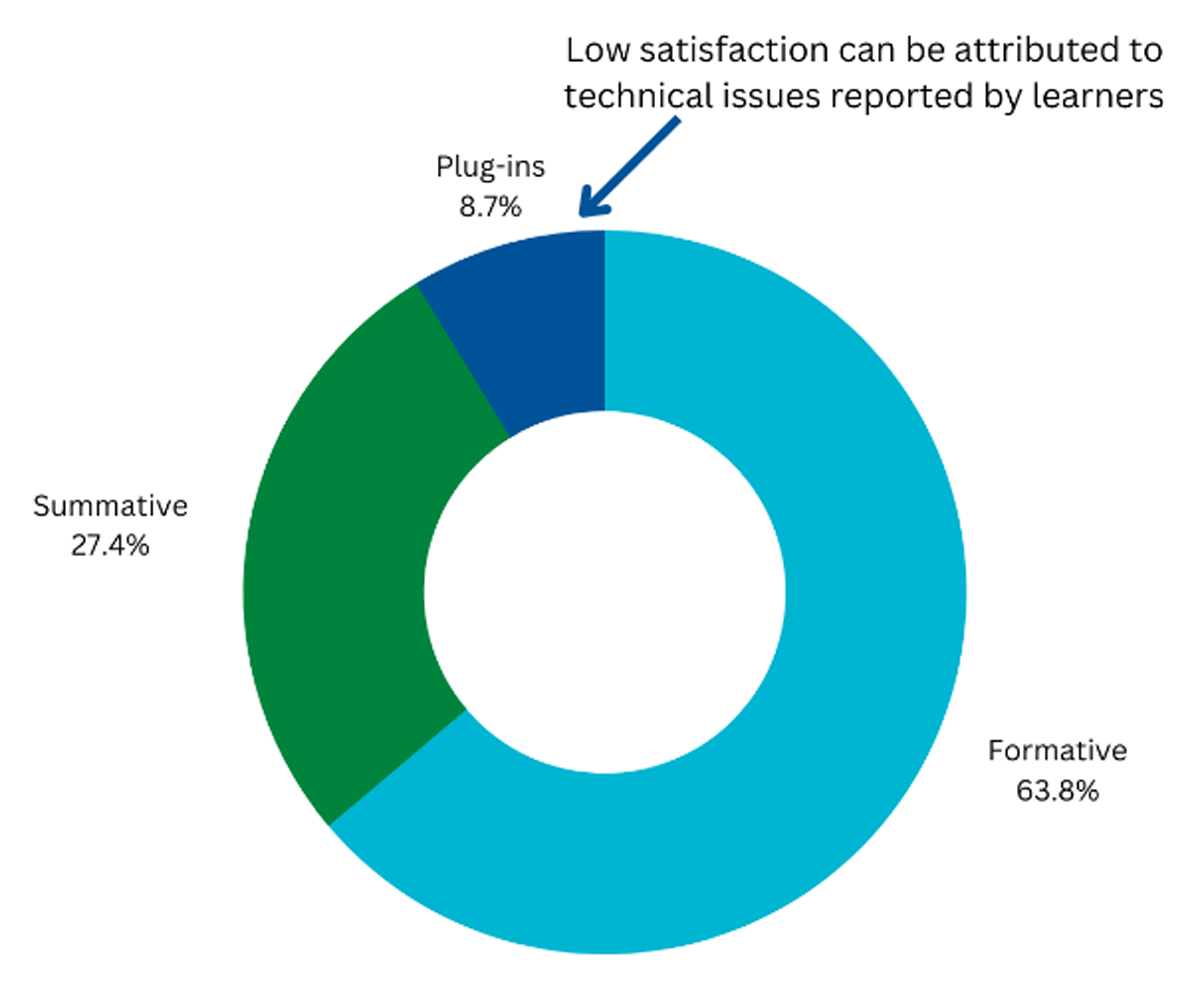
Figure 13
Coursera Item Feedback: Learner Satisfaction with Assessment Types (%).
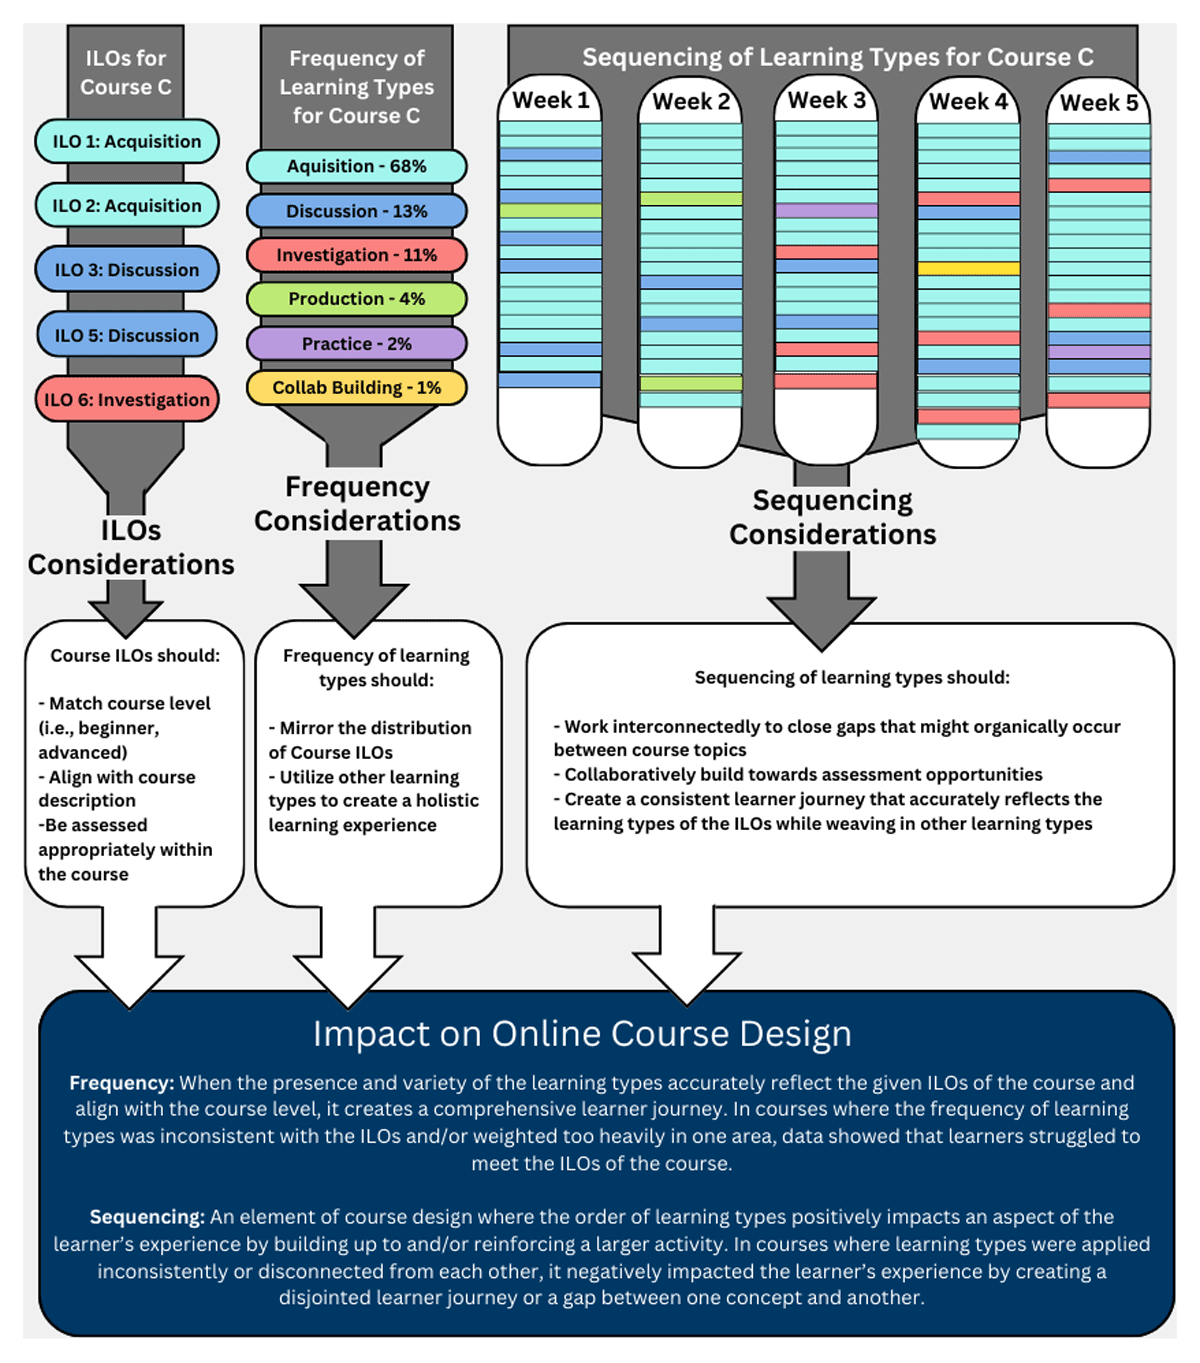
Figure 14
Impact of Frequency and Sequencing of Learning Types (Course C).