
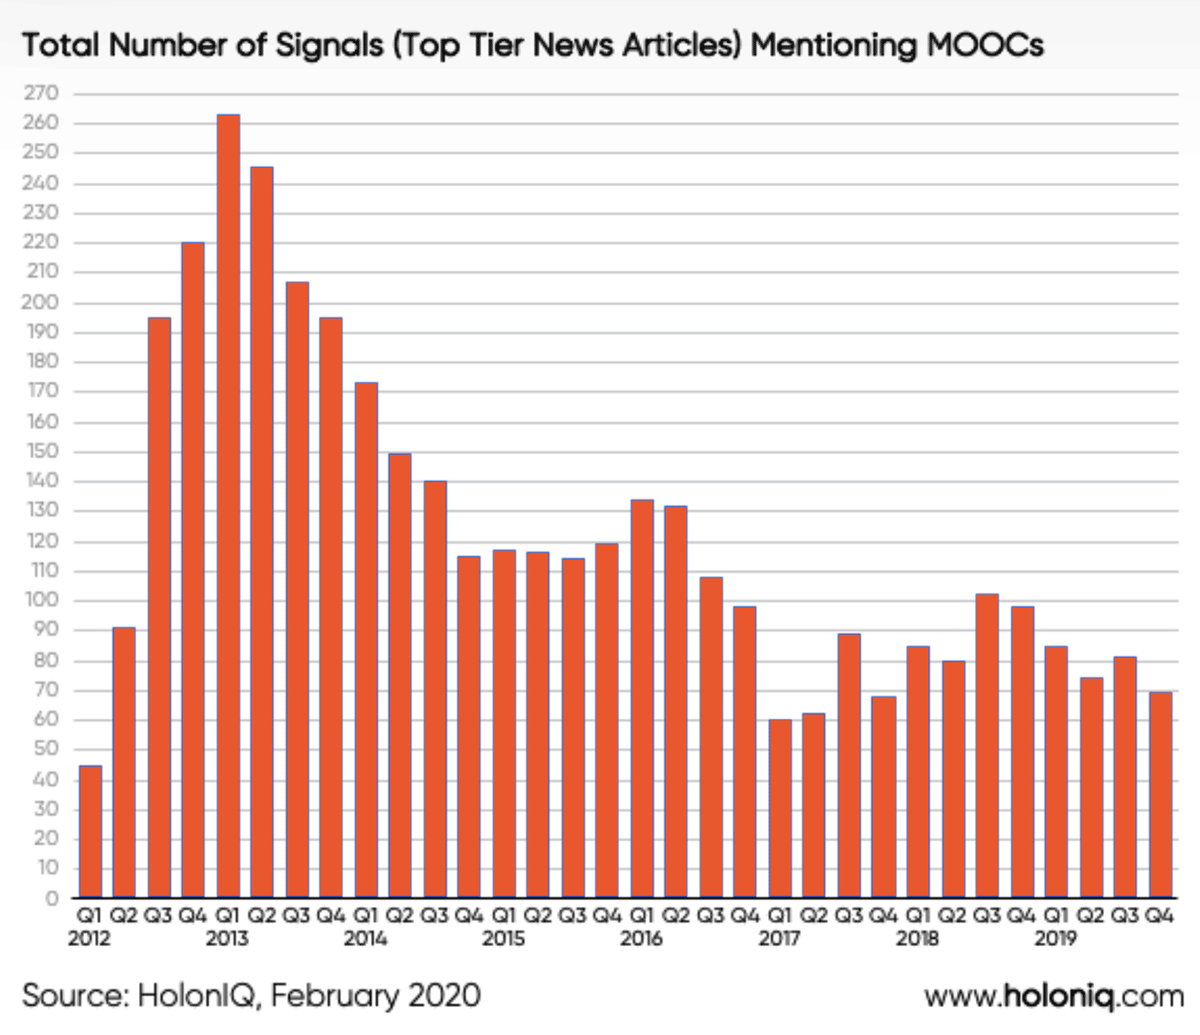
Figure 1
Changes in level of interest – approximate number of articles – on the topic of MOOCs over time.
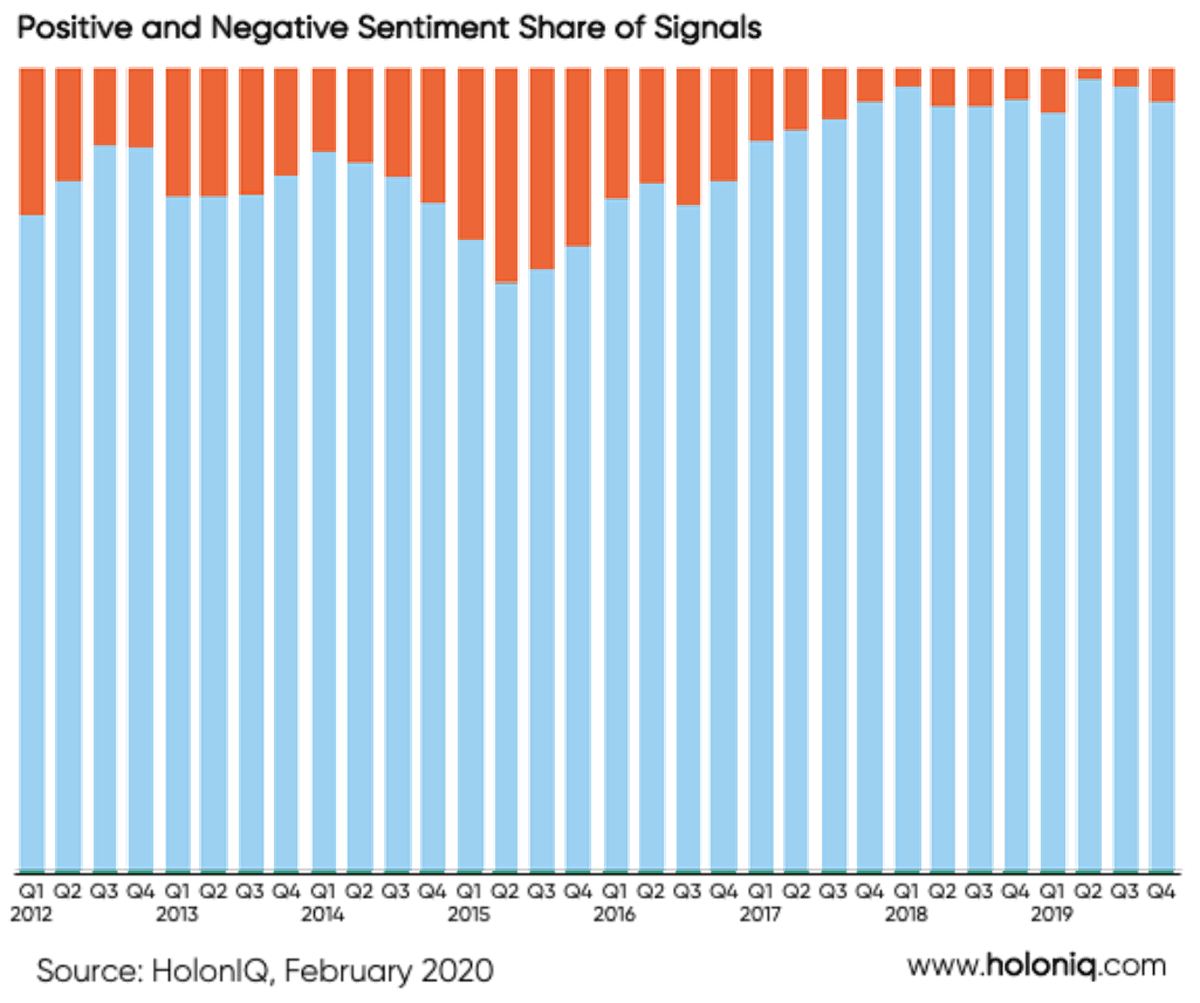
Figure 2
Changes in level of positive and negative sentiment in articles on the topic of MOOCs over time. Proportion of sentiment which is negative is shown in orange; positive sentiment is shown in blue.
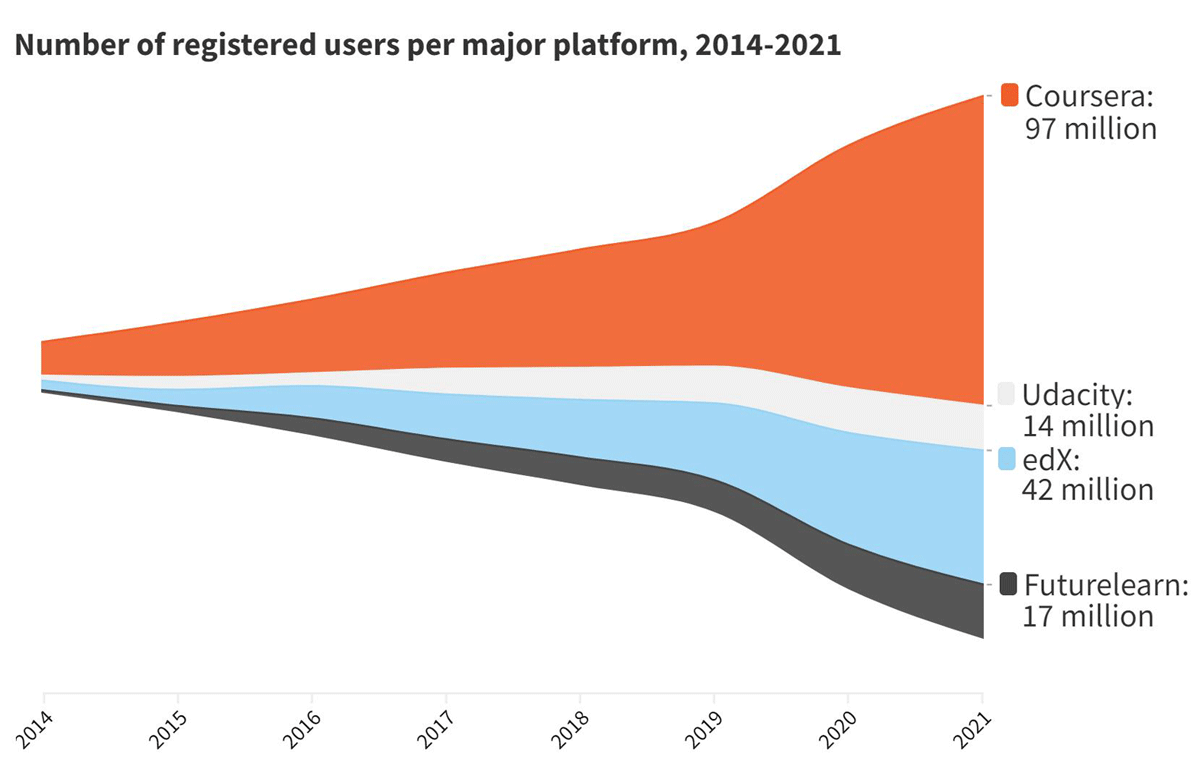
Figure 3
Growth in number of registered users for four of the largest platforms – Coursera, edX, FutureLearn, Udacity (data sources: EdSurge 2015; Shah 2014, 2015, 2016, 2017, 2018, 2019, 2020, 2021a). Note increase associated with the Covid-19 pandemic.
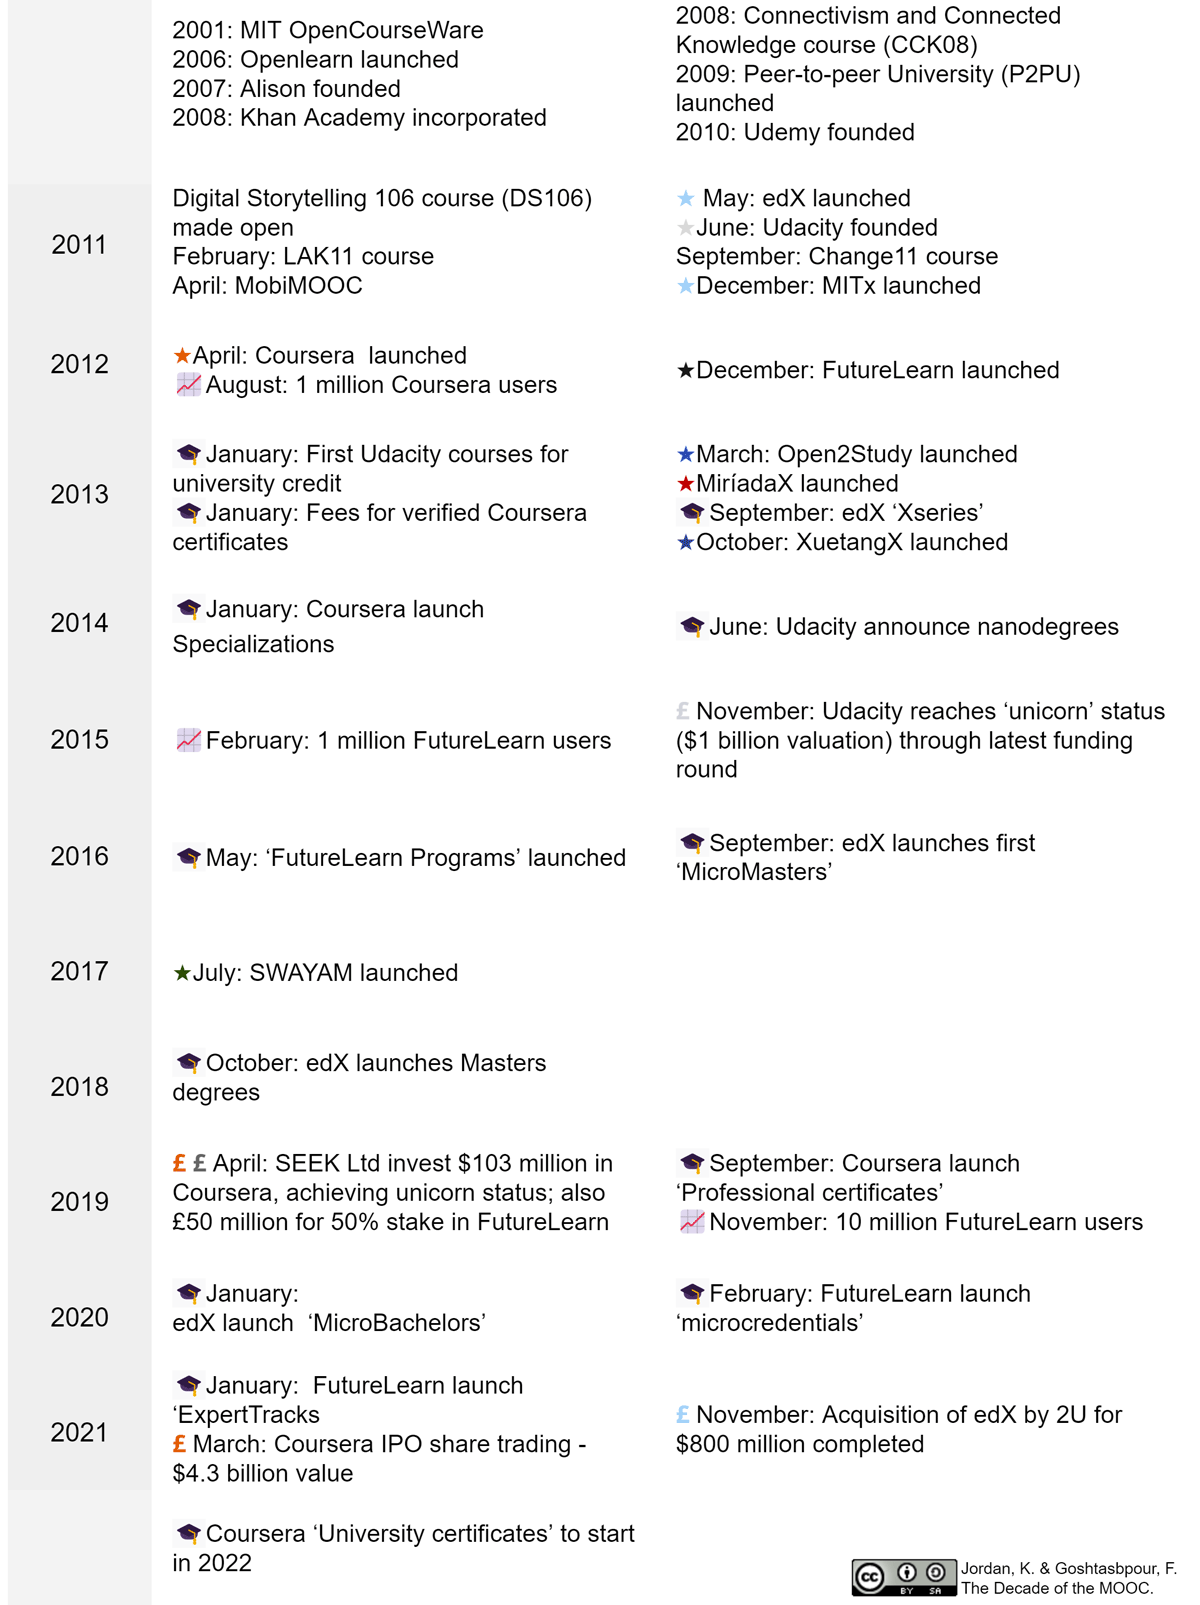
Figure 4
Timeline of major trends within the field of MOOCs across the past decade.
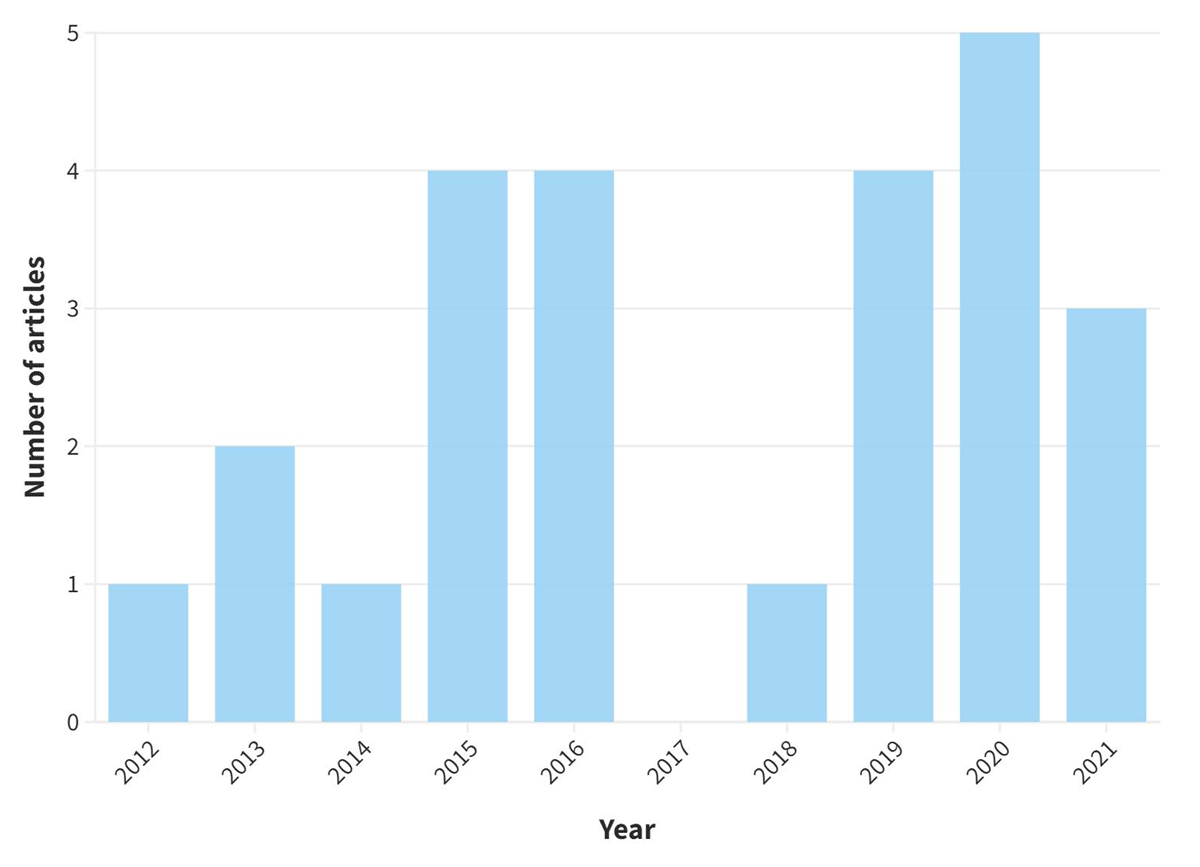
Figure 5
Number of MOOC-focused papers published in JIME by year, since 2012.
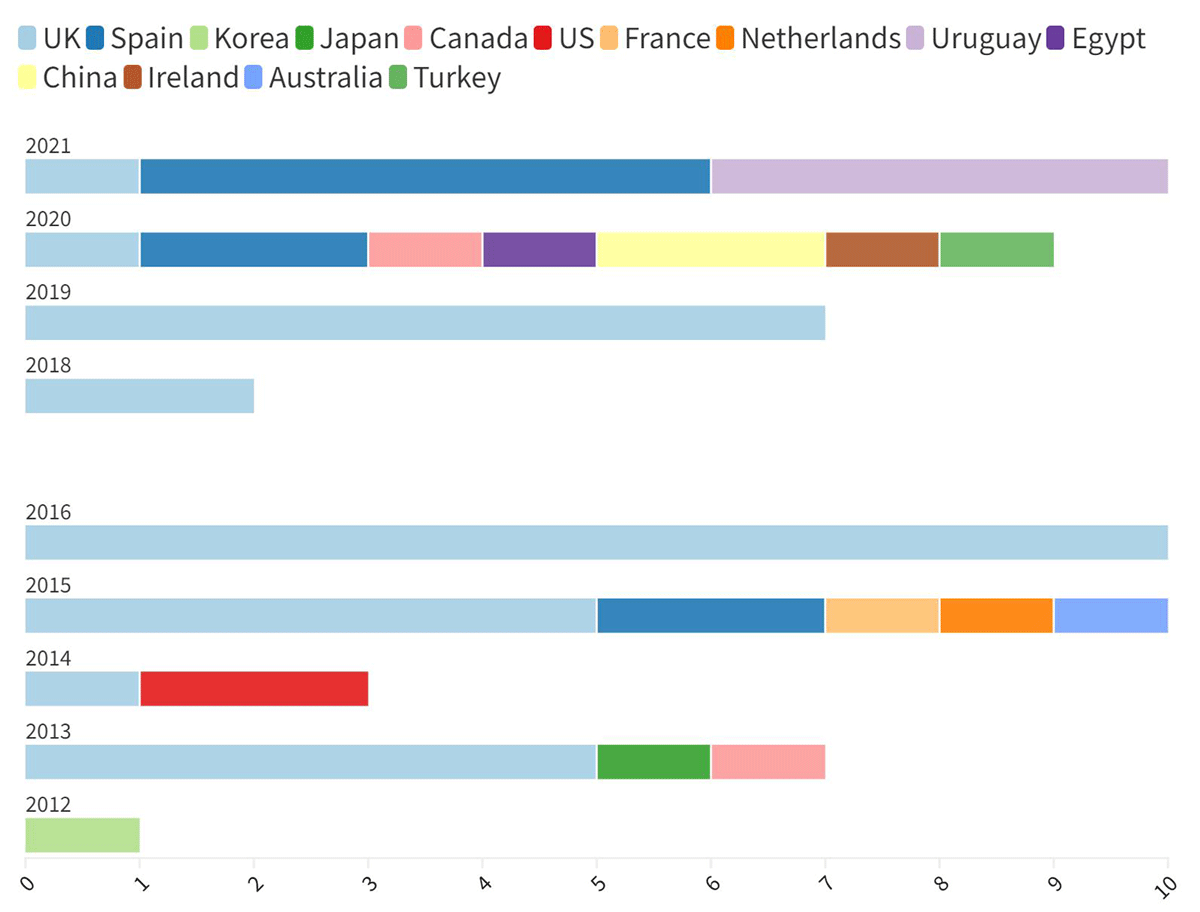
Figure 6
Geographical location of authors of the MOOC-focused papers published in JIME by year, since 2012.
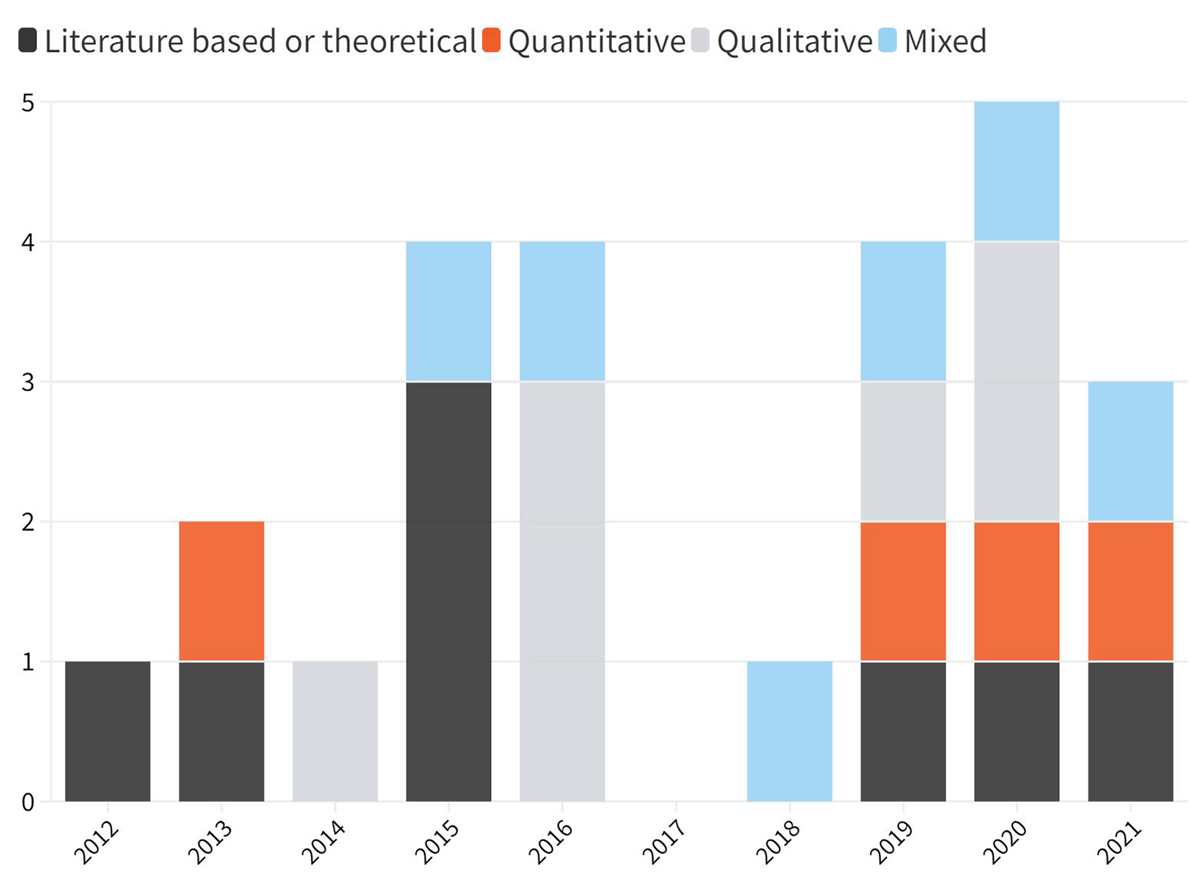
Figure 7
Methods used in the articles, according to year.
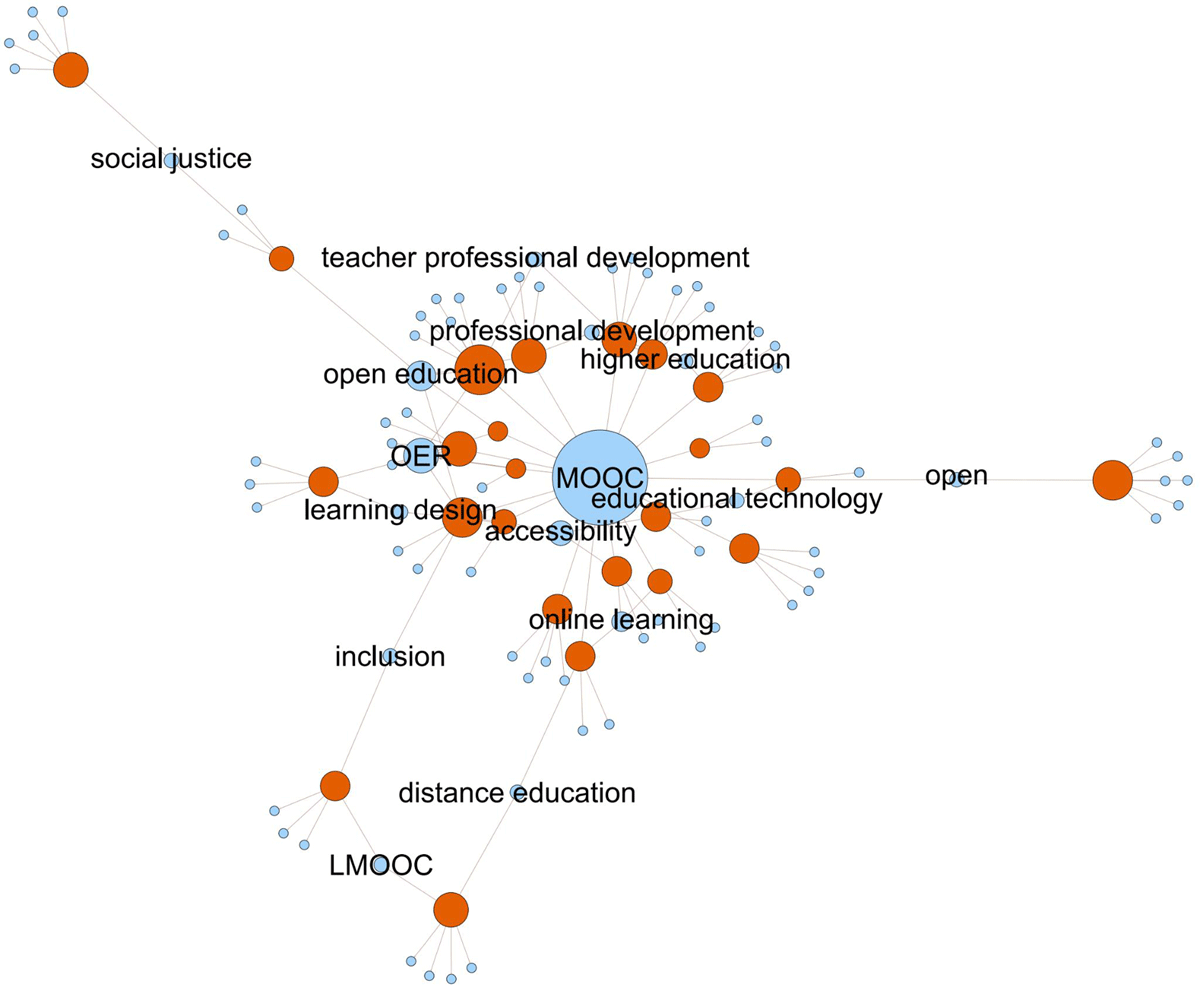
Figure 8
Network of keywords (blue nodes) associated with the 25 articles (orange nodes) in the virtual special collection. Keywords which were used by two or more articles are labelled.
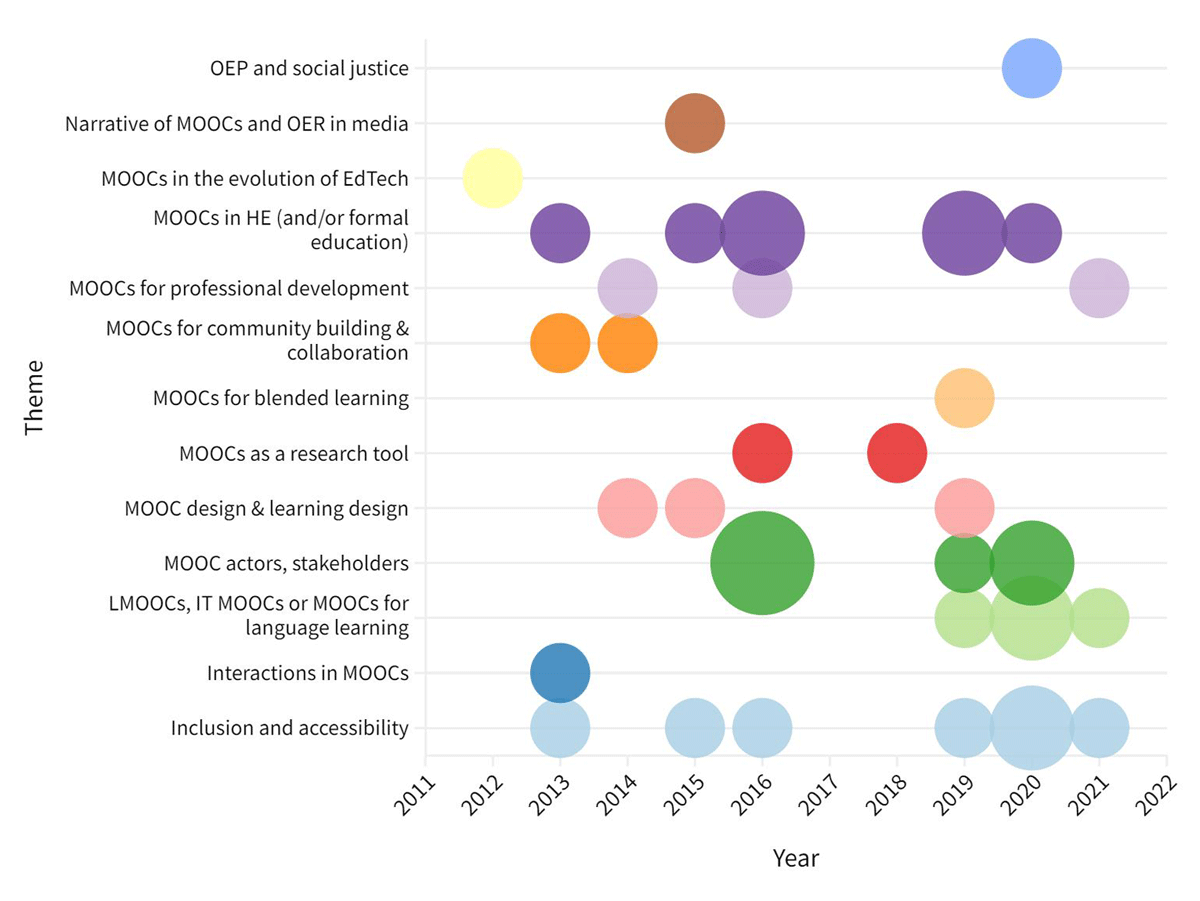
Figure 9
Emergent themes identified through open coding of the 25 articles. Note that at this stage, a single article could be tagged with more than one theme.
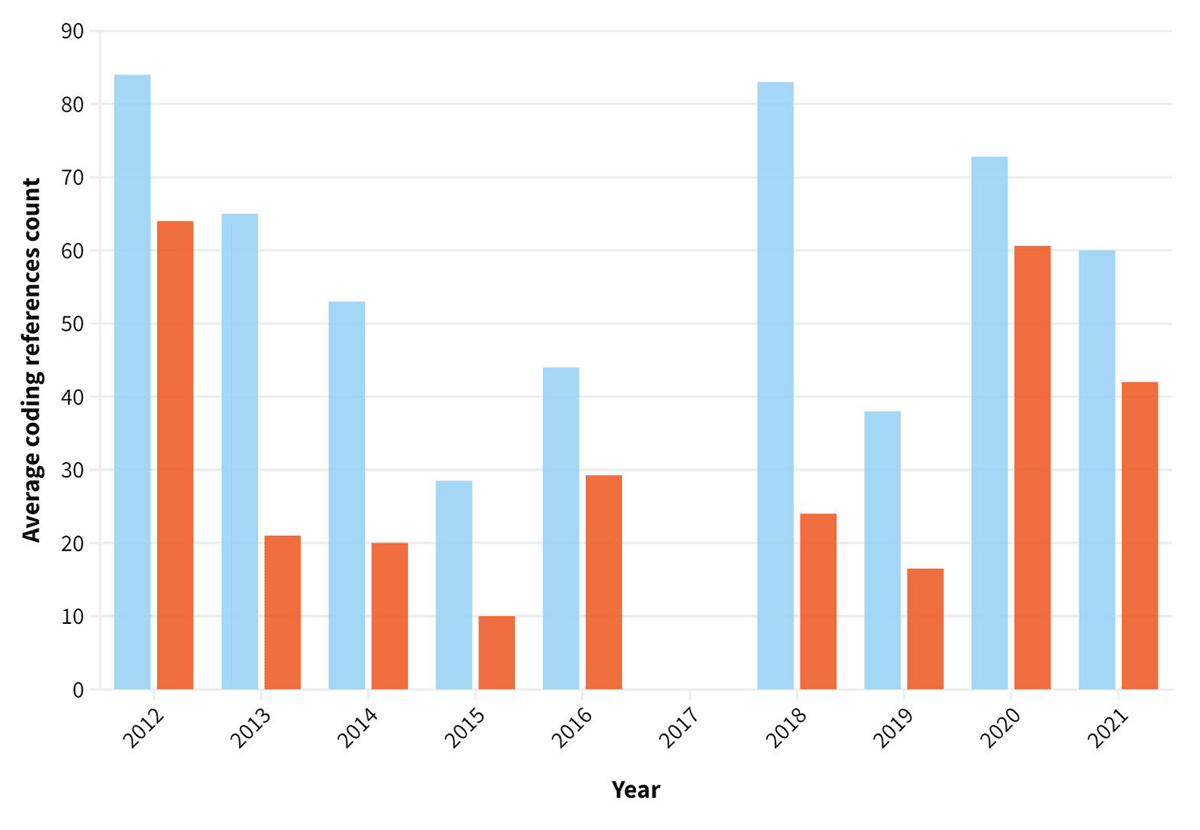
Figure 10
Levels of positive (blue) and negative (orange) sentiment in the articles within the special collection. The average figures per year are shown, as the number of papers published per year varied.
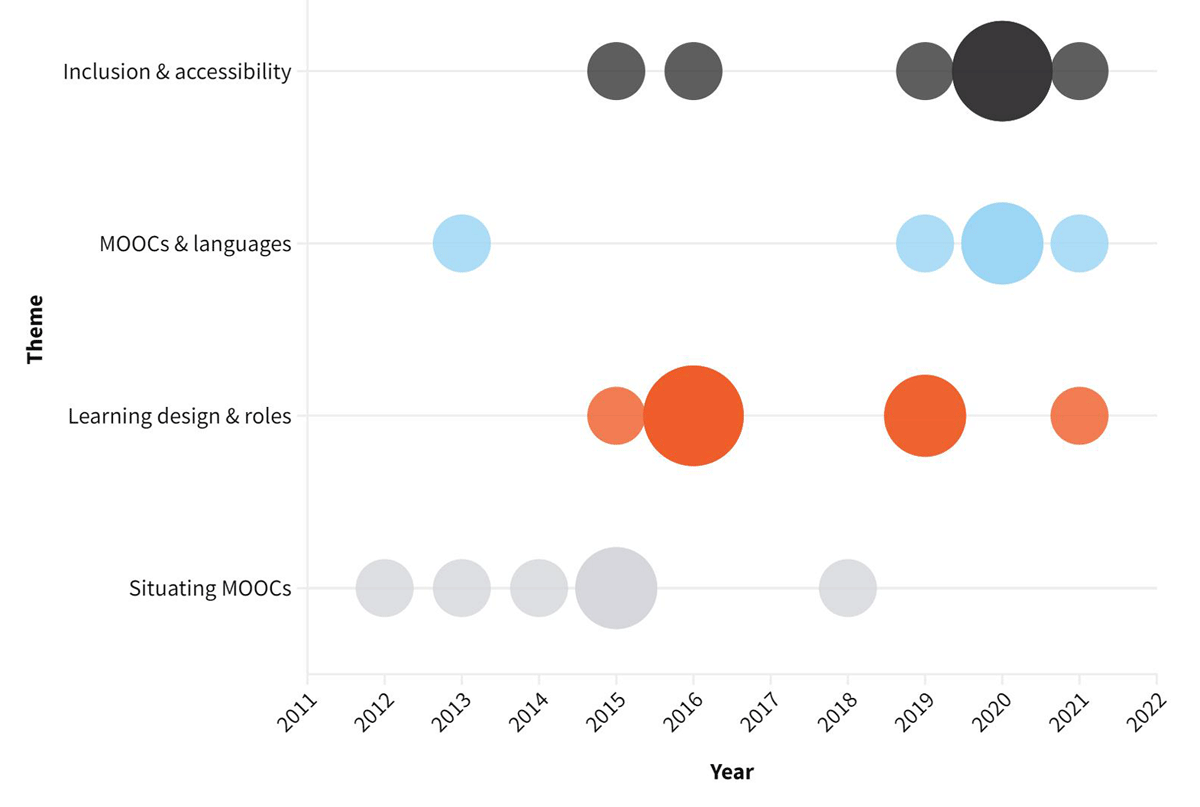
Figure 11
Number of papers published in JIME according to the four main themes, by year.