
Table 1
Interview participants’ demographics.
| Name | Age (years) | Gender | Faculty | Years teaching |
|---|---|---|---|---|
| Alice | 40–49 | F | Arts | 15+ |
| Robert | 30–39 | M | Arts | 10–15 |
| Olivia | 30–39 | F | Communication, Art, and Technology | 5–9 |
| Thomas | 30–39 | M | Communication, Art, and Technology | 0–5 |
| James | 30–39 | M | Education | 5–9 |
| Joanne | 40–49 | F | Environment | 0–5 |
| Katherine | 50–49 | F | Forestry/Land and Food Systems | 15+ |
| Patricia | 20–29 | F | Humanities | 0–5 |
| William | 40–49 | M | Science and Management | 10–15 |
| Margaret | 40–49 | F | Social and Applied Sciences | 15+ |
| Tracy | 60–69 | F | Social Sciences | 15+ |
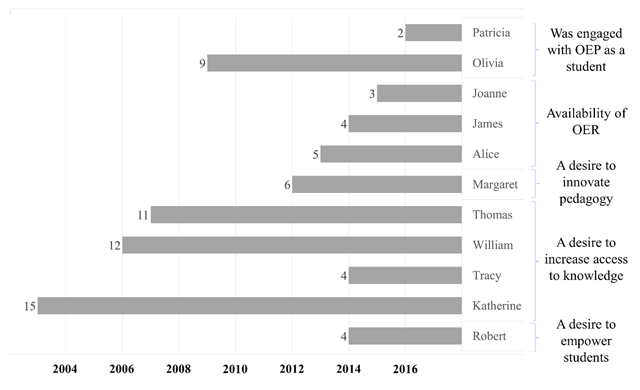
Figure 1
Participant’s years of engagement with OEP and general catalyst for that change.
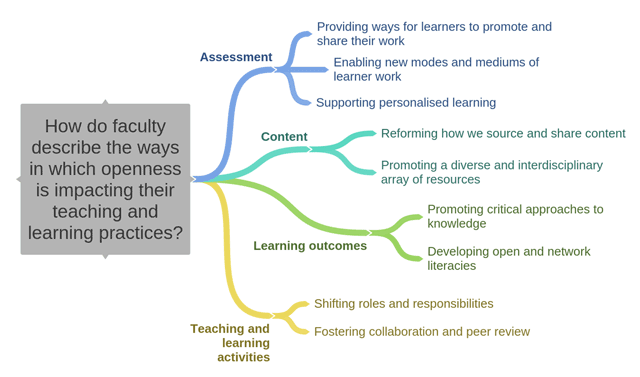
Figure 2
Themes that emerged as faculty members described how openness is impacting their pedagogy.