
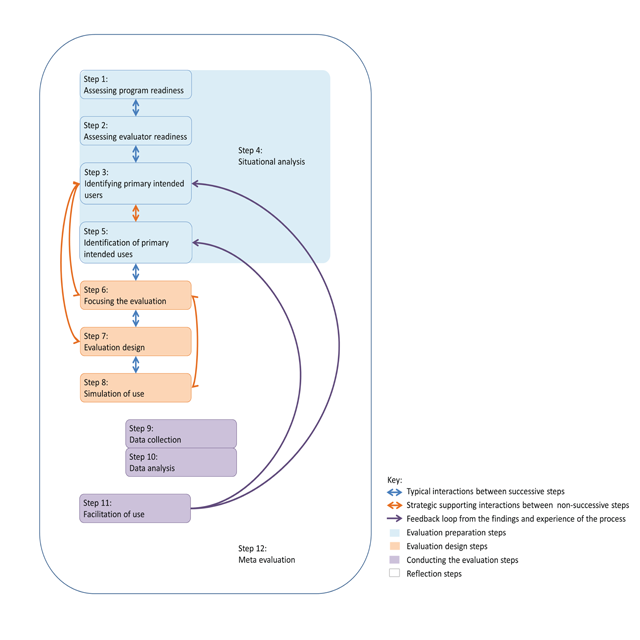
Figure 1
Utilization Focused Evaluation Framework (Adapted from Ramírez & Brodhead, 2013).
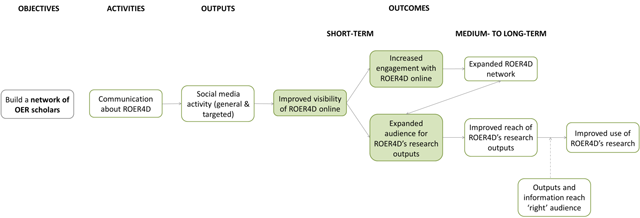
Figure 2
Logical framework looking at ROER4D’s Networking objective relating to Twitter.
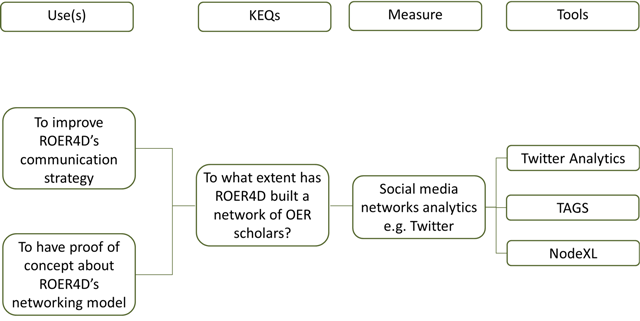
Figure 3
Flowchart linking the uses, KEQs, measures and Tools relating to ROER4D’s Twitter activity.
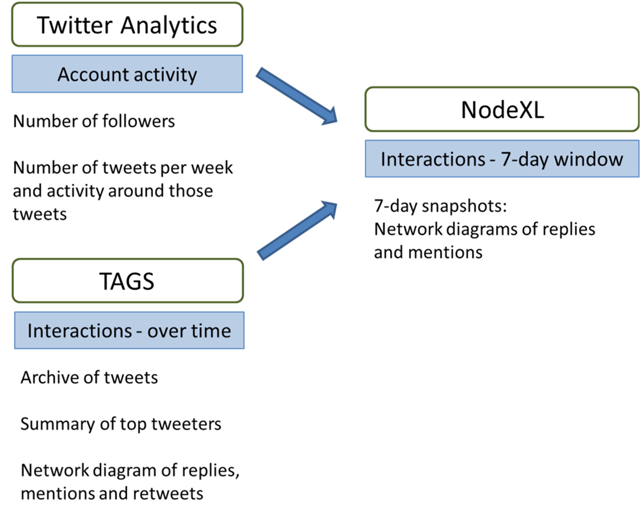
Figure 4
Workflow of ROER4D’s Twitter tools and data collection.
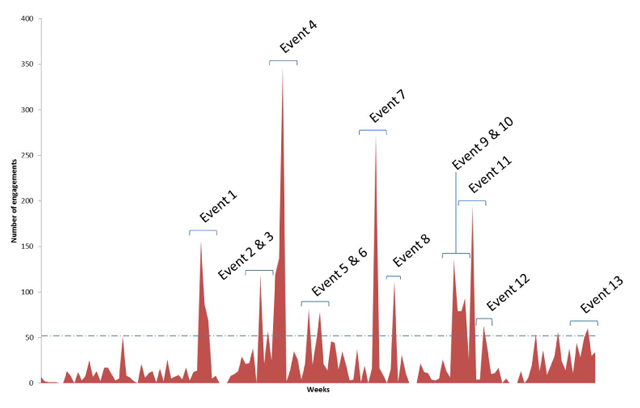
Figure 5
Graph showing the ROER4D’s Twitter account engagements per week over the course of the project. Peaks over 50 engagements per week (above dashed line) correspond with conferences, workshops and event weeks.
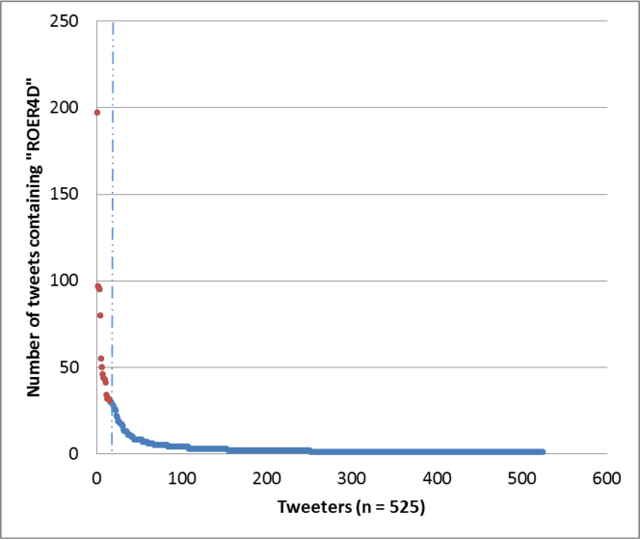
Figure 6
Graph of number of tweets containing the phrase ‘ROER4D’ showing the core group of 16 highly engaged Tweeters (before dashed line), who tweeted the phrase more than 30 times.
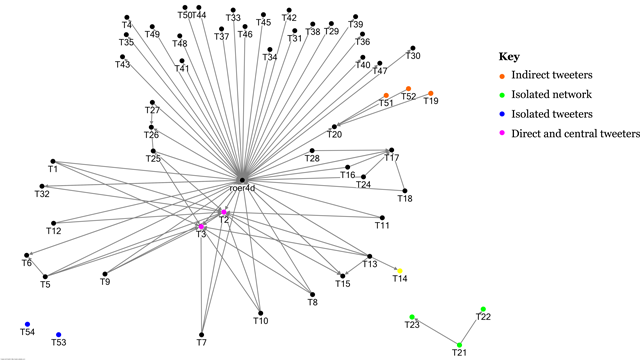
Figure 7
Directed network diagram showing the replies and mentions relationships between the Tweeters who have used the phrase ‘ROER4D’ over a 7-day period. The distances between nodes are arbitrary.
| Average number of engagements | |
|---|---|
| All event weeks | 110.9 |
| Up to week 75 | 104.1 |
| From week 75 to week 150 | 118.3 |
| All normal weeks | 13.0 |
| Up to week 75 | 15.3 |
| From week 75 to week 150 | 10.9 |
Table 1
Measures at weeks 1, 75 and 150 of the ROER4D project’s activity on Twitter.
| Related project outcomes (see pg. 4) | Measure | Number in week 1 | Number at 75 weeks | Average number per week (up to week 75) | Number at 150 weeks (cumulative) | Average number per week (from week 75 to week 150) | % change between week 75 and week 15 averages |
|---|---|---|---|---|---|---|---|
| 1, 3 | Number of followers | 5 | 460 | 6.1 | 825 | 8.9 | 45.9% |
| 1 | Number of impressions | 600 | 155, 350 | 2071.3 | 245, 525 | 1202.3 | –42.0% |
| 1, 2 | Number of retweets | 1 | 582 | 7.8 | 1 178 | 7.9 | 1.3% |
| 2 | Number of @Replies | 2 | 36 | 0.5 | 113 | 1.0 | 100.0% |