
Table 1
Summary of demographic characteristics of respondents to the survey, and those who submitted text responses.
| Demographic factors | Entire survey (total n = 3509) | Free-text sample (total n = 480) | ||
|---|---|---|---|---|
| Job position | n | Percentage | n | Percentage |
| Professor | 714 | 20.3 | 113 | 23.5 |
| Lecturer | 748 | 21.3 | 121 | 25.0 |
| Researcher | 1474 | 42.0 | 179 | 37.1 |
| Graduate student | 253 | 7.2 | 25 | 5.2 |
| Other | 320 | 9.1 | 42 | 9.2 |
| Discipline | n | Percentage | n | Percentage |
| Arts & Humanities | 81 | 2.3 | 18 | 3.8 |
| Social Sciences | 285 | 8.1 | 45 | 9.4 |
| Formal Sciences | 50 | 1.4 | 3 | 0.6 |
| Natural Sciences | 2107 | 60.0 | 276 | 57.5 |
| Professions | 970 | 27.6 | 134 | 27.9 |
Table 2
Emergent coding scheme for benefits.
| Benefits | n | Percentage (of 189) |
|---|---|---|
| Benefits for younger academics | 13 | 6.9 |
| Directory of academics | 16 | 8.5 |
| Discussions | 21 | 11.1 |
| Dissemination | 26 | 13.8 |
| Find information and papers | 17 | 9.0 |
| Find potential collaborators | 22 | 11.6 |
| Helping others | 12 | 6.3 |
| Improve scientific process | 6 | 3.2 |
| Raise own profile | 19 | 10.1 |
| Recruitment and opportunities | 16 | 8.5 |
| Stay up-to-date | 23 | 12.2 |
| Support multiple profiles | 13 | 6.9 |
| Track impact | 15 | 7.9 |
Table 3
Emergent coding scheme for problems.
| Problems | n | Percentage (of 345) |
|---|---|---|
| Concerns about commercialism | 8 | 2.3 |
| Digital inclusion issues | 7 | 2.0 |
| Digital literacy issues | 29 | 8.4 |
| Forbidden by institution | 6 | 1.7 |
| Not perceived to be useful | 70 | 20.3 |
| Prefer other networking | 39 | 11.3 |
| Privacy and security concerns | 36 | 10.4 |
| Social aversion | 54 | 15.7 |
| Spam | 19 | 5.5 |
| Time concerns | 106 | 30.7 |
| Too many sites | 28 | 8.1 |
| Unreliable information online | 25 | 7.2 |
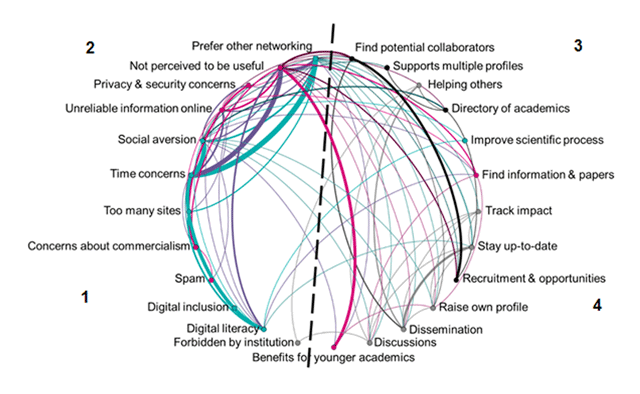
Figure 1
Network of co-occurring themes in the qualitative analysis. Benefits are arranged to the right of the dashed line, and problems to the left. Colour coding of nodes denotes the clusters.
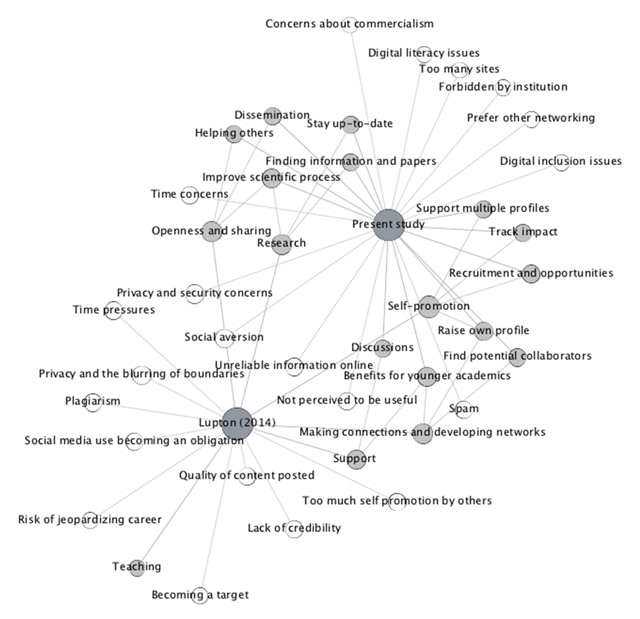
Figure 2
Mapping results from Lupton (2014) to present study. Benefits are shown in grey; problems are shown in white.
Table 4
Clusters identified by co-coding in the analysis.
| Cluster 1 | Cluster 2 |
|---|---|
| – Not perceived to be useful | – Prefer other networking |
| – Privacy and security concerns | – Social aversion |
| – Unreliable information online | – Time concerns |
| – Concerns about commercialism | – Too many sites |
| – Spam | – Digital inclusion |
| + Find information and papers | – Digital literacy |
| + Benefits for younger academics | + Improve scientific process |
| Cluster 3 | Cluster 4 |
| + Find potential collaborators | – Forbidden by institution |
| + Support multiple profiles | + Helping others |
| + Directory of academics | + Track impact |
| + Recruitment and opportunities | + Stay up-to-date |
| + Raise own profile |